Download presentation
Presentation is loading. Please wait.

2
Weather forecasting began in the mid 1800’s when basic tools, like the thermometer and barometer, were invented Global Weather Reporting Weather observations at stations around the world Records temperature and pressure every few hours Also measure precipitation, surface wind direction and speed, and the type and amount of cloud cover. World Weather Watch A program designed to promote the rapid exchange of weather information Helps developing countries establish or improve their meteorological services Offers advice on the effect of weather on natural resources and on human activities

3
All data collected is transferred to weather maps Allows meteorologists to understand the current weather and to predict future weather events Uses symbols and colors to indicate certain characteristics

4
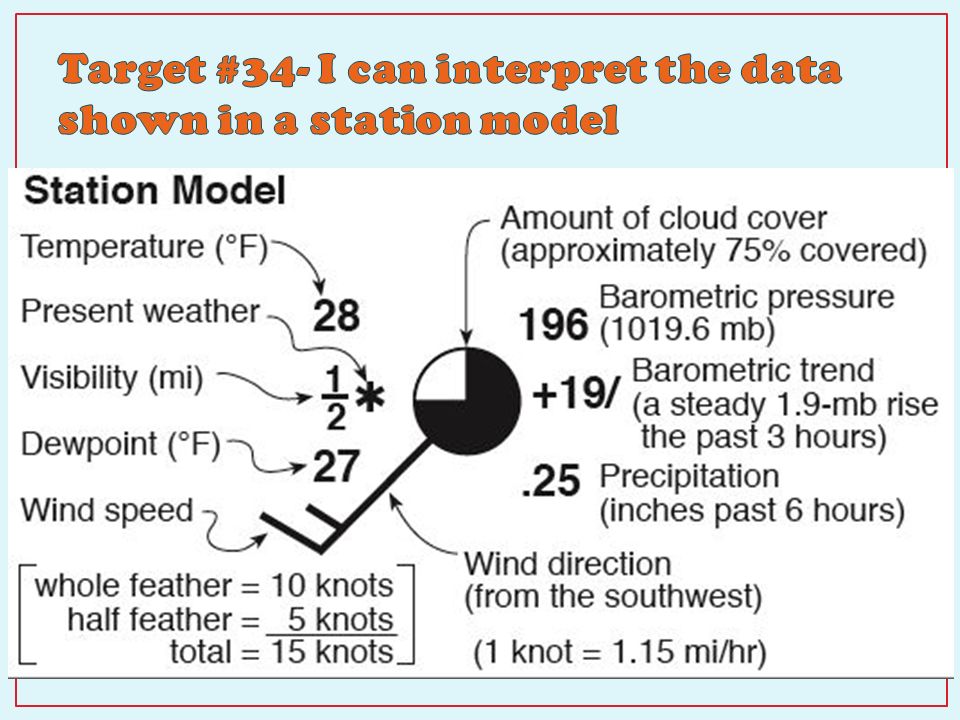
Station model: a pattern of meteorological symbols that represents the weather at a particular observing station and that is recorded on a weather map Examples of data used Cloud cover Wind speed & direction Types of precipitation Storm activity Air temperature Dew point

8
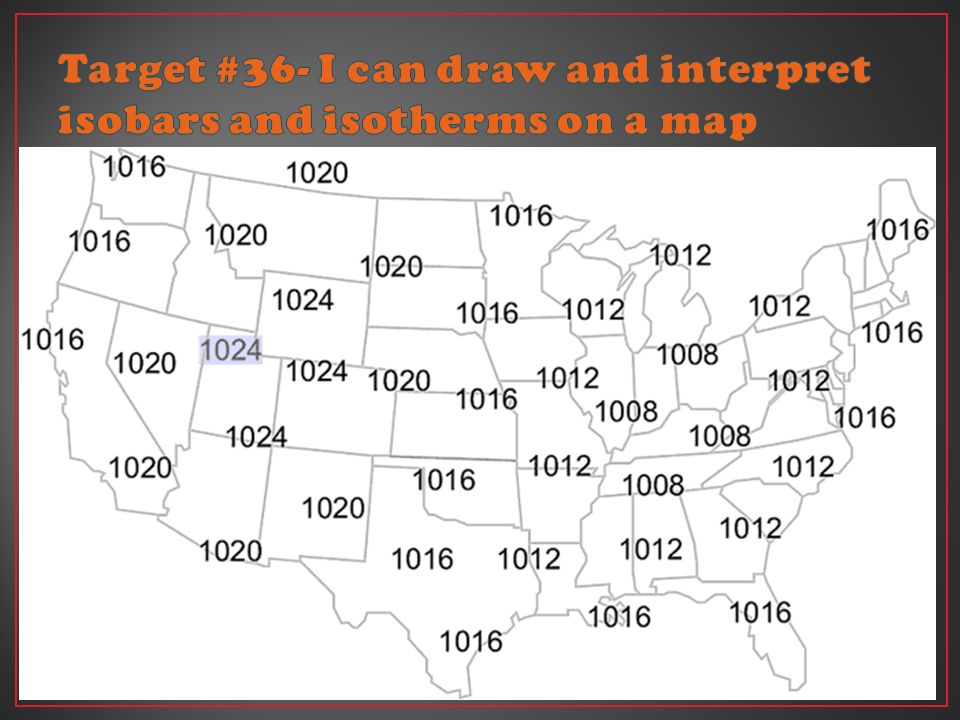
Scientists use lines on weather maps to connect points of equal measurement. Lines that connect points of equal temperature are called isotherms Lines that connect points of equal atmospheric pressure are called isobars

9
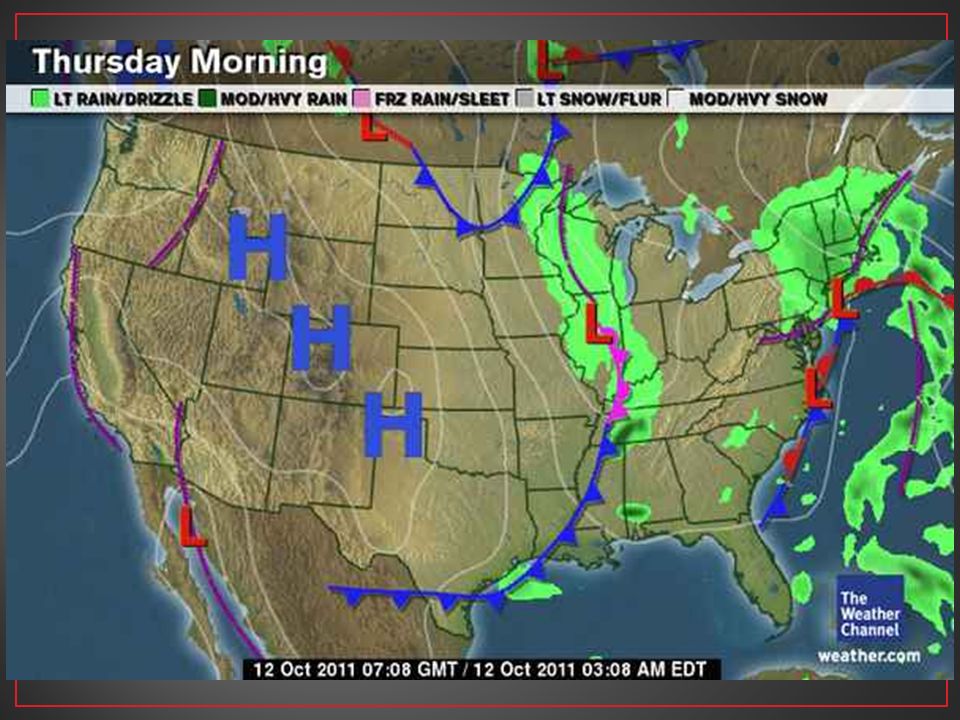
The spacing and shape of the isobars help meteorologists interpret their observations about the speed and direction of wind Closely spaced bars indicate a rapid change in pressure and high wind speeds Widely spaced isobars generally indicate a gradual change in pressure and low wind speeds Isobars that form circles indicate centers of high or low air pressure Marked with an H (high) or an L (low)
 or an L (low)")
12
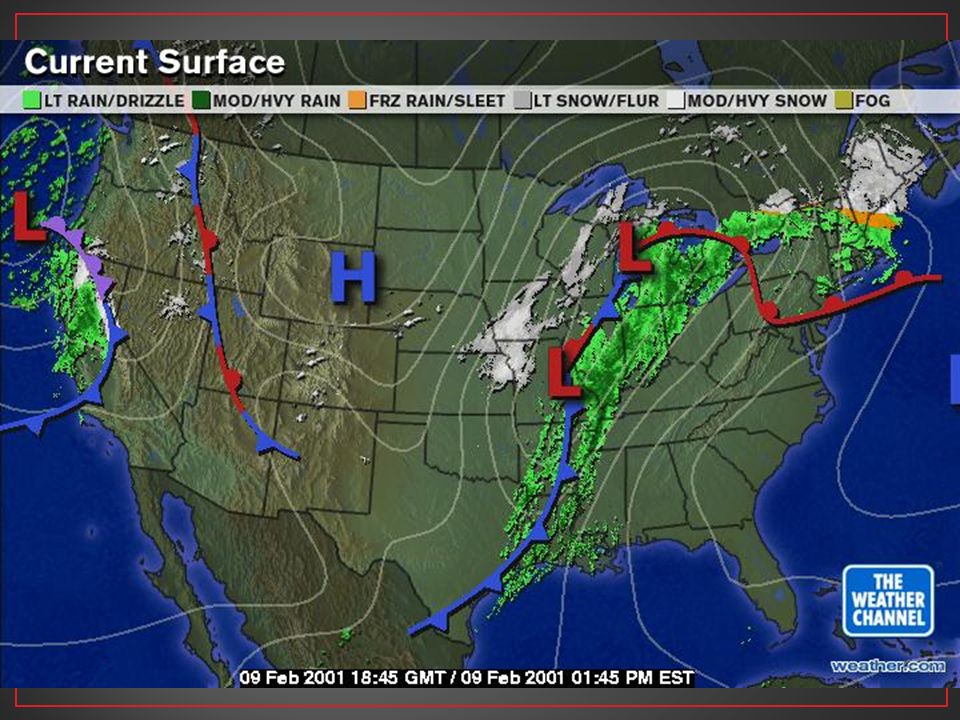
Weather maps are used to illustrate many different features Isobars Highs and lows in pressure Fronts Warm, cold, occluded, stationary Conditions Precipitation Direction of air flow

Similar presentations


>")


