Download presentation
Presentation is loading. Please wait.

1
Monitoring Fluid Responsiveness Murat Sungur, MD Erciyes University Medical School Department of Medicine Division of Critical Care Medicine

2
If we are giving fluids we should have a cardiovascular response. SV and CO should rise

3
Stroke volume Preload Fluid responsiveness Fluid unresponsiveness Fluid responsiveness is related to cardiac responsiveness

4
Do we need monitoring ? Phycial exam Chest X-ray Urine output Heart rate Blood pressure Or just a fluid challenge with crystalloids or colloids !

5
«Crying baby may be thirsty or hungry» CONCEPT ! Quantitation of the cardiovascular response during volume infusion. Prompt correction of fluid deficits. Minimizing the risk of fluid overload and its potentially adverse effects, especially on the lungs. Crit Care Med 2006; 34:1333–1337

6
Cristalloids500 – 1000 ml, or Colloids300 – 500 ml Safety limit: CVP of 15 mmHg !!

7
CVP as a Preload Marker Chest 2008;134;172-178

8
CVP does not predict actual blood volume Chest 2008;134;172-178

9
CVP measurement is methodologically difficult 50 health care worker Anesth Analg 2009;108:1209 –11

10
Stroke volume Preload Fluid responsiveness is related to cardiac responsiveness Normal heart Failing heart Fluid responsiveness Fluid unresponsiveness

11
Pre-infusion CVP values are similar in responders and non-responders Crit Care Med 2007; 35:64–68

12
Cristalloids500 – 1000 ml, or Colloids300 – 500 ml Safety limit: CVP of 15 mmHg !!

13
Problems with fluid challenge Not a test, a treatment Irreversible Significant amount of volume should be given Only 50 % of the patients are responsive CVP is not a good predictor of preload Should be repeated multiple times Cristalloids500 – 1000 ml, or Colloids300 – 500 ml

14
Multiple fluid challenges increases the risk for volume overload Sepsis in European intensive care units: Results of the SOAP Study. Crit Care Med 2006; 34:344–353.

15
Initial resuscitation (first 6 hrs) ● Begin resuscitation immediately in patients with hypotension or elevated serum lactate 4 mmol/L; do not delay pending ICU admission (1C) ● Resuscitation goals (1C) –CVP 8–12 mm Hg –Mean arterial pressure 65 mm Hg –Urine output 0.5 mLkg1hr1 –Central venous (superior vena cava) oxygen saturation 70% or mixed venous 65% Who knows how much CVP affected from PEEP or hyperinflation
 ● Begin resuscitation immediately in patients with hypotension or elevated serum lactate 4 mmol/L; do not delay pending ICU admission (1C) ● Resuscitation goals (1C) –CVP 8–12 mm Hg –Mean arterial pressure 65 mm Hg –Urine output 0.5 mLkg1hr1 –Central venous (superior vena cava) oxygen saturation 70% or mixed venous 65% Who knows how much CVP affected from PEEP or hyperinflation")
16
Both sides of the heart can be assessed PAWP, an important indicator of pulmonary edema can be measure CO can be measured Mixed venous oxygen saturation, an important parameter of Co and tissue oxygenation can be measured PULMONARY ARTERY CATHETER

17
PAC Misuse Iberti JAMA 1990;264:2928-2932 Gnaegi Crit Care Med 1997;25:213-220 Burns Am J Crit Care 1996;5:49-54

18
Cost versus length of stay Connors* et al conducted a prospective, multi-center cohort study PAC vs Non-PAC groups Compared survival, cost, intensity of care and length of stay Multiple complicated statistical analysis of the data Increased mortality in PAC group (odds ratio:1.24) Connors J JAMA,1996 276(11):889-897
 Connors J JAMA, (11):")
19
PAC may be associated with increased mortality Connors JAMA 1996;276:889-897

20
Sandham et al. NEJM 2003 Objective: To compare goal-directed therapy guided by a PAC with standard therapy among high-risk elderly patients undergoing surgery Design: RCT, not masked Patients: surgical Intervention: PAC vs standard care Primary Outcome: in-hospital mortality Secondary: 6-month mortality, 12-month mortality, in- hospital morbidity: MI, arrythmias, pneumonia, PE, renal/liver insufficiency, sepsis from CR-BSI Sandham JD et al. N Engl J Med 2003; 348:5-14, Jan 2, 2003

21
PAC directed therapy does not decrease mortality Sandham JD et al. N Engl J Med 2003; 348:5-14, Jan 2, 2003 Standard Care (n=997) PAC group (n=997) % In-hospital mortality *7.77.8 % 6-mo mortality11.912.6 % 12-mo mortality16.117.0 Hospital LOS (days)10 Myocardial infarction3.44.3 CHF11.212.6 Supravent. tachycardia9.18.9 Pulmonary embolism (%) #00.9 Renal insufficiency9.87.4 Hepatic insufficiency2.72.4 Sepsis from CR-BSI1.3 Adverse events from PAC or CVP placement 0.71.5
 PAC group (n=997) % In-hospital mortality * % 6-mo mortality % 12-mo mortality Hospital LOS (days)10 Myocardial infarction CHF Supravent. tachycardia Pulmonary embolism (%) #00.9 Renal insufficiency Hepatic insufficiency Sepsis from CR-BSI1.3 Adverse events from PAC or CVP placement")
22
We need dynamic and non-invasive parameters that shows preload and cardiac reserve rather than static preload parameters

23
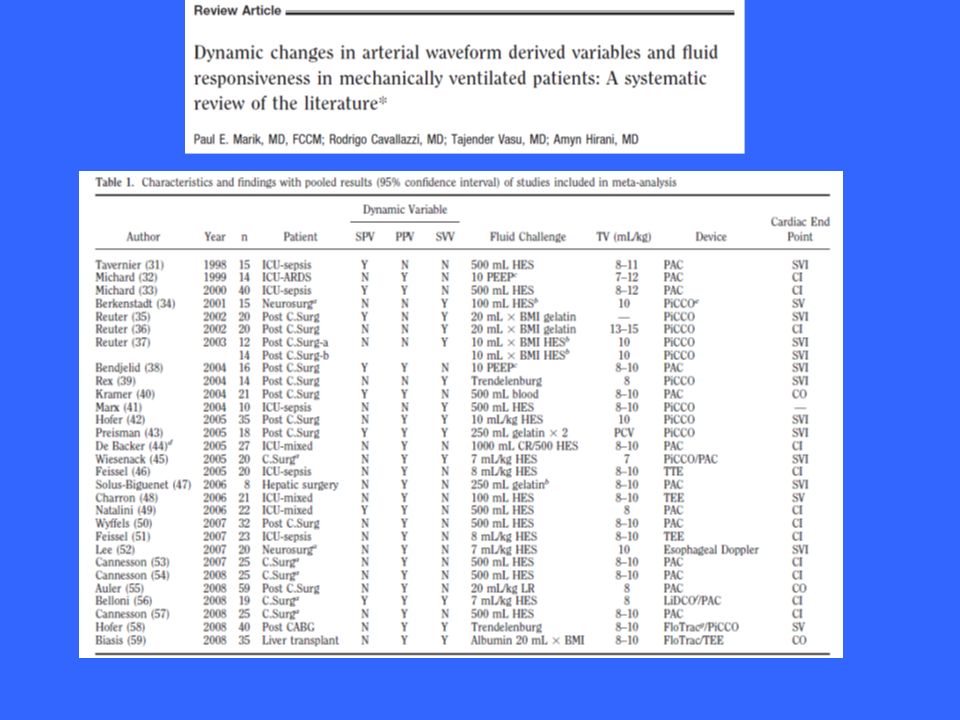
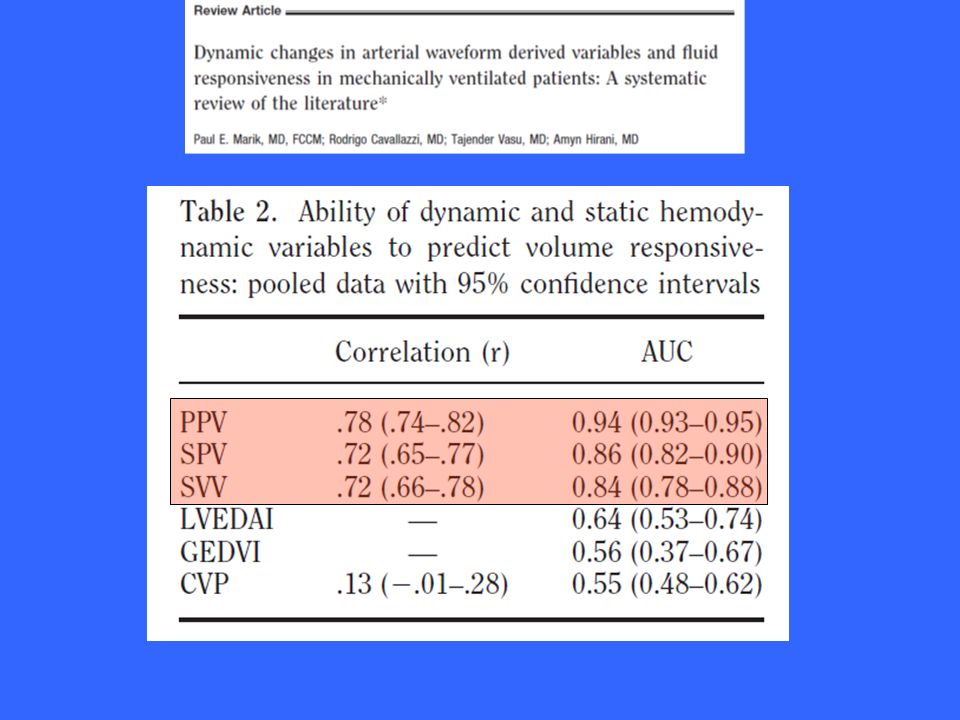
Pulse Pressure Variation Anesthesiology 2005; 103:419–28

24
Stroke volume Preload Fluid responsiveness Fluid unresponsiveness Fluid responsiveness is related to cardiac responsiveness Pulse pressure variation

25
Pulse pressure variation may be a better tool to predict fluid resposiveness Am J Respir Crit Care Med Vol 162. pp 134–138, 2000

26
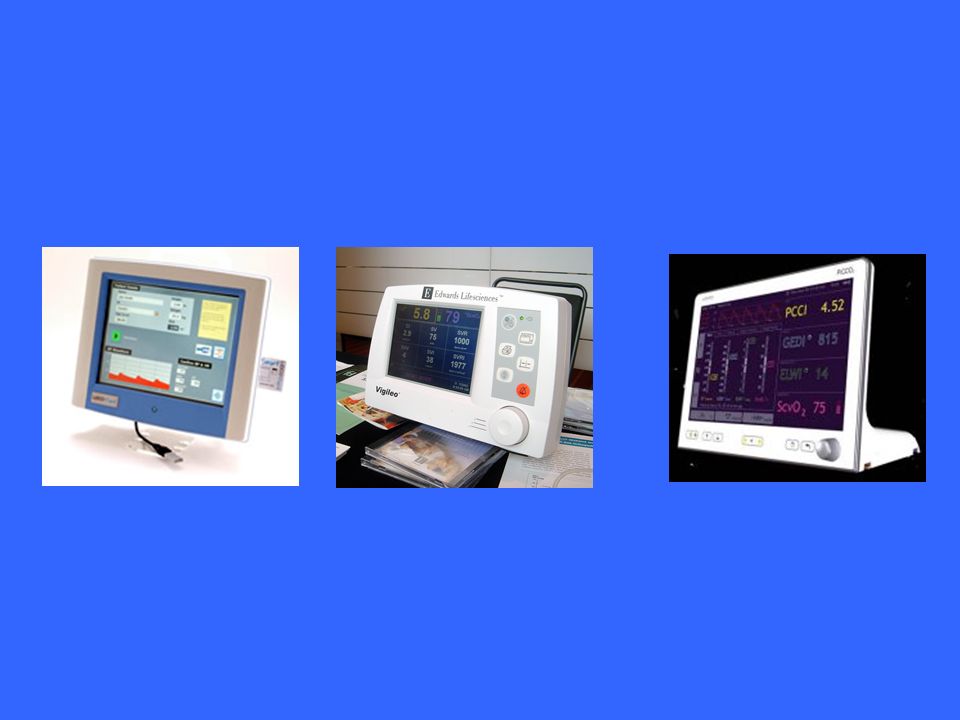
Stroke volume variation SVV = SV max – SV min / SV mean

28
Crit Care Med 2011; 39: 402-3

31
Problems with PPV and SVV Spontaneously breathing patients Arrhythmias Significant tachycardia Very low tidal volumes

32
Passive Leg Raising Venous blood from legs and abdomen increases preload İt is just like fluid challenge but it is reversible Needs real time CO monitoring Should be quick and for 30 – 90 seconds

33
PLR compared with volume expansion HR SV VF Baseline 1 PLR Baseline 2 Post Volume expansion HR SV VF HR SV VF HR SV VF 500 ml colloid infusion Crit Care Med 2010; 38:819–825 SPONTANEOUSLY BREATHİNG PATİENTS

34
PLR accurately predict fluid responsiveness Crit Care Med 2010; 38:819–825

35
SAME STUDY PROTOCOL WITH VENTILATED PATIENTS Crit Care Med 2006; 34:1402–1407 ALERT: Do not use PLR in patients with abdominal hypertension

36
Echocardiography to asses fluid status and responsiveness Static parameters –LVEDA –IVC Dynamic parameters –SVV with repeated SV measurements –Change in IVC/SVC diameter –IA septum position For assessment of –Heart lung interactions –Passive leg raising –Fluid challenge

37
Summary There are many parameters to use Static measurements are not accurate We need less invasive and more dynamic parameters PPV and SVV are good parameters to use Echocardiography done by intensivist will be more and more popular

Similar presentations


 for severe sepsis and septic shock treatment>")


