Download presentation
Presentation is loading. Please wait.

1
Evidence and Information for Policy Service Availability Mapping Presentation to the MERG Geneva, Switzerland October, 2004

2
Evidence and Information for Policy Emerging challenges in international public health –Global agencies focus on national level (MDG) but subnational matters for countries –Health sector reform – decision-making decentralized to districts –Increases in resources linked to performance-based disbursement –Rapid scale up of interventions against AIDS, TB and malaria will have to be monitored closely –Attention to health system requirements alongside vertical initiatives
 but subnational matters for countries –Health sector reform – decision-making decentralized to districts –Increases in resources linked to performance-based disbursement –Rapid scale up of interventions against AIDS, TB and malaria will have to be monitored closely –Attention to health system requirements alongside vertical initiatives")
3
Evidence and Information for Policy Responding to challenges –Low cost rapid method to supplement household surveys, clinic-based statistics and facility surveys –Information for action at district and national levels –Tools that are feasible, useful, cost-effective –Integrate into existing efforts to strengthen health information systems –One monitoring and evaluation system in health

4
Evidence and Information for Policy The vision SAM as a country owned monitoring tool meeting the needs of multiple partners. At national level, SAM is used to track equity between districts and identify major gaps in service availability. At district level, SAM is used for monitoring service availability alongside supervisory visits. Disease-specific programmes use SAM, thus avoiding fragmentation and duplication. SAM results are widely disseminated and used by health sector and civil society, including other sectors. National planners are able to map all facilities and all services on a regular basis.

5
Evidence and Information for Policy Application 1. Data collected using PDAs by district health teams 2. PDA is synchronized with PC for data transfer 3. Data is analysed and maps produced using HealthMapper

6
Evidence and Information for Policy District questionnaire Questionnaire overview: –Section 1: Availability of services and service providers, by district –Section 2: Estimated coverage of specific interventions, by district –Section 3: Availability of services, by facility

7
Evidence and Information for Policy Facility questionnaire Questionnaire overview: - Section 1: General characteristics - Section 2: General purpose equipment - Section 3: Injection and sterilization equipment - Section 4: Human resources - Section 5: Trained staff - Section 6: Drugs and commodities - Section 7: Lab tests - Section 8: Information on interventions available in the facility

8
Evidence and Information for Policy SAM implementation Implemented Uganda Zambia Planned Burkina Faso DR Congo Cote d`Ivoire Mozambique Senegal South Africa Tanzania Sri Lanka Laos Viet Nam Cost ~ USD300 per districts (in- country costs) Time ~ 4-8 weeks Ongoing Kenya
 Time ~ 4-8 weeks Ongoing Kenya")
9
Evidence and Information for Policy Infrastructure topics In-patient, maternity, and delivery beds available in all facilities Blood transfusion services Laboratory services Communication and technology resources Injection practices

10
Evidence and Information for Policy

12
Human resource topics Number of: –Doctors –Nurses –Clinical officers –Dentists –Laboratory technicians –HMIS personnel –Medical records personnel

13
Evidence and Information for Policy

17
Using SAM to look at inequities: Health staff by district: (ass.) doctors, nurses, and midwives per 10,000 population, excluding Kampala and Jinja districts Nurse and midwives per 10,000 (assistant) Doctors per 10,000 Kabarole Apac Adjumani Luwero More doctors, more nurses Fewer doctors, more nurses Fewer doctors, fewer nurses Bushenyi Busia Kalangala Kotido Arua Yumbe Masindi Moroto Kasese Hoima Masaka Mbale National average per 10,000 people 1.1 (ass.) doctors 2.9 nurses & midwives Nakapiripirit Kanungu Kumi Nebbi Kisoro Moyo Kaberamaido Kitgum Rukungiri Tororo Soroti Bundibugyo Kiboga Nakasongola Kiboga Rakai Mpigi Mukono Kyenjojo Mubende Kayunga Ntungamo Kapchorwa Kibaale Mbarara Palissa Bugiri Lira Sironko Katakwi IgangaMayuge Kamwenge Kamuli
 doctors, nurses, and midwives per 10,000 population, excluding Kampala and Jinja districts Nurse and midwives per 10,000 (assistant) Doctors per 10,000 Kabarole Apac Adjumani Luwero More doctors, more nurses Fewer doctors, more nurses Fewer doctors, fewer nurses Bushenyi Busia Kalangala Kotido Arua Yumbe Masindi Moroto Kasese Hoima Masaka Mbale National average per 10,000 people 1.1 (ass.) doctors 2.9 nurses & midwives Nakapiripirit Kanungu Kumi Nebbi Kisoro Moyo Kaberamaido Kitgum Rukungiri Tororo Soroti Bundibugyo Kiboga Nakasongola Kiboga Rakai Mpigi Mukono Kyenjojo Mubende Kayunga Ntungamo Kapchorwa Kibaale Mbarara Palissa Bugiri Lira Sironko Katakwi IgangaMayuge Kamwenge Kamuli")
18
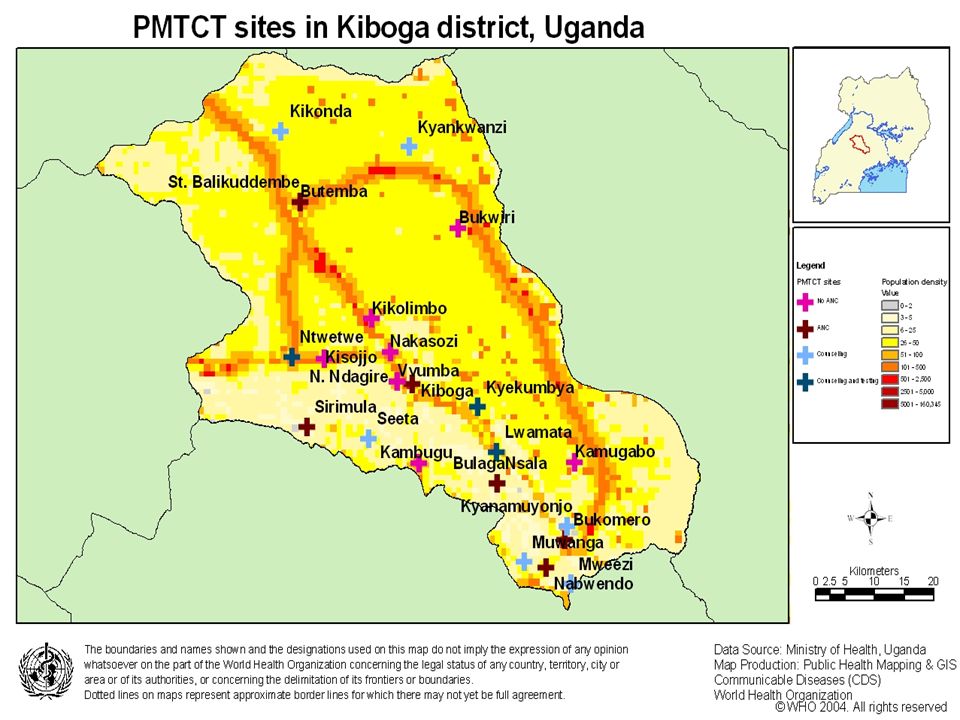
Evidence and Information for Policy HIV/AIDS Availability of: –PMTCT –T&C –ART therapy –ART drug supply

19
Evidence and Information for Policy

24
Percent of districts with ART, PMTCT or HIV testing & counselling services, SAM Uganda, 2004

25
Evidence and Information for Policy Percent of districts that have at least one laboratory that can do specified tests, SAM Uganda 2004

26
Evidence and Information for Policy Maternal and child health topics Availability of: –C-section –Emergency blood transfusions –IMCI training –Safe motherhood/live saving skills

27
Evidence and Information for Policy

29
Findings The SAM can provide a snapshot of service availability for HIV/AIDS, health services and other services. HealthMapper and palm pilot are a useful way of collecting information that will be relevant for health planning and monitoring. A national monitoring system of the scale up of AIDS-related services needs to be put in place. This should depend on district reports, with special visits to the clinics providing the services. The SAM and HealthMapper can be used to track progress on a regular basis and can also monitor system wide effect on service availability. Goal is to take the SAM to the district level. The district should be enabled to plan and monitor service availability through mapping of facilities and services on a regular basis related to regular supervision and drug supplies.

30
Evidence and Information for Policy THANK YOU

Similar presentations


 Policy Domains Learning for all Low-income Countries Middle-income Countries OECD Countries.>")
 – Executive Team Friday, 7 October 2011.>")


 Tool and other Mechanisms to Monitor Transition Status Track 1 Implementers.>")

. P.O Box 10443, Kampala Tel: +256 414 532580/1, Fax +256 414 541288 Website:>")
