Download presentation
Presentation is loading. Please wait.

1
Puerto Rico Coastal Hazards Mapping By David M. Bush State University of West Georgia

2
The original source of much of this information is: Bush, David M., Bruce R. Richmond, and William J. Neal, 2001. Coastal Zone Hazard Maps: Eastern Puerto Rico. Environmental Geosciences, 8(1), p. 38-60.
, p")
3
Puerto Rico Coastal Hazards Maps Goal—to develop a tool for quick visualization of multiple coastal hazards A basis for hazard mitigation and management recommendations To be of use to: –Coastal planners –Managers –Property owners –Potential property owners

4
PR Shoreline Setting Compartmentalized Geologic/oceanographic processes and hazards can be considered on a compartment-by-compartment basis Highly developed in places

5
Six Types of Hazards Considered 1.Shoreline-setting hazards (long-term problems) 2.Marine hazards (short-term impacts of storms) 3.Earthquake and slope hazards (ground shaking, landslides, liquefaction) 4.Riverine hazards (historical floods) 5.Development hazards (high-density or dangerous settings) 6.Engineering hazards (stabilization, nourishment, sand mining)
 2.Marine hazards (short-term impacts of storms) 3.Earthquake and slope hazards (ground shaking, landslides, liquefaction) 4.Riverine hazards (historical floods) 5.Development hazards (high-density or dangerous settings) 6.Engineering hazards (stabilization, nourishment, sand mining)")
6
Puerto Rico is the smallest and easternmost of the Greater Antilles

7
The insular shelf around Puerto Rico is variable, but very narrow on the north.

8
A side-looking airborne radar (SLAR) image clearly shows the physiography of the 150 x 50-km island of Puerto Rico. Several small rivers drain to the north, and the northern coastal lowlands are wide compared to the southern. Courtesy of Simulation Systems, Inc.

9
Natural Hazards (after Bryant, 1991) Of the top 25 natural hazards, those affecting coasts: 2. Tropical cyclones 6. Extratropical storm 7. Tsunami 8. Sea-level rise 10. Beach erosion 13. Ocean waves 14. Localized strong wind 15. Subsidence

10
Examples of Natural Hazards Affecting Puerto Rico Landslides—from rainfall and earthquakes Waves and surge from winter storms Hurricanes and tropical storms –Rainfall –Overwash –Erosion –Flooding –Wind Rainfall from tropical waves

11
NOAA satellite image of Hugo nearing Puerto Rico

12
Major hurricanes affecting Puerto Rico seem to follow one of two main paths. Hugo is #13. Hugo 1989

13
USGS figure of path of the eye of Hurricane Hugo as it crossed the Virgin Islands and Puerto Rico

14
San Juan National Weather Service radar positions of Hugo’s eye. Note irregular path of storm center when viewed in detail. Also note the deflection (loop) in the path which resulted in an extended battering of St. Croix. St. Croix
 in the path which resulted in an extended battering of St. Croix. St. Croix.")
15
Direct wave impact on first row of buildings, Condado area of San Juan

16
Sand washover along the Pi ones shoreline after Hurricane Hugo. An estimated 500,000 cubic meters of sand was washed ashore along this stretch (Bush, 1991).
..")
17
Overwash from Hugo extended several kilometers along the Puerto Rico shoreline and extended 10’s of meters inland. From Bush (1991).
..")
18
Post-Hugo field study estimated storm surge along several coastal reaches. From Bush, 1991

19
Hugo was a relatively dry hurricane and caused only local flooding as here at the R o de la Plata mouth.

20
Hugo caused hundreds of small landslides in the mountains of Puerto Rico.

21
USGS map showing landslide susceptibility in the municipality of Comer o, Puerto Rico.

22
Swell from North Atlantic winter storms cause the largest waves hitting the northern coast of Puerto Rico. Here are tracks of several storms studied by Fields and Jordan (1972).
..")
23
The 1991 Halloween Nor’easter caused storm-wave swash flooding and overwash along the northern coast of Puerto Rico as here in Isabela. Photo taken January 1992

24
Three Kings Day storm, 1992, Puerto Rico, 24-hour rainfall totals for selected areas. From El Nuevo D a newspaper.

25
Flash flood from 1992 Three Kings Day flood, PR

26
Coastal Erosion Another major natural hazard in Puerto Rico Many ways to measure A simple way is a “geoindicators” assessment (Bush et al., 1999)
")
27
Geoindicators of Erosion Dunes scarped or breached Bluffs steep with no talus ramp Peat, mud, or tree stumps exposed on beach Beach narrow or no high-tide beach Overwash passes or fans Vegetation ephemeral or toppled along scarp line

28
Geoindicators of Severe Erosion Dunes absent with overwash common Active wave scarping of bluffs or dune remnants Tidal channels exposed in surf zone Vegetation absent Engineering structures now on beach or offshore

29
Geoindicators of Accretion or Long-Term Stability Dunes and beach ridges robust, unbreached, vegetated Bluffs vegetated with stable (vegetated) ramp at toe Overwash absent Vegetation well-developed from interior maritime forest, to dune shrubs, and pioneer beach grass
 ramp at toe Overwash absent Vegetation well-developed from interior maritime forest, to dune shrubs, and pioneer beach grass")
30
Erosion rates for Puerto Rico were calculated in detail from aerial photography by Thieler and Danforth (1993).
.")
31
Beach and dune sand mining may be the greatest contributor to coastal erosion in the Caribbean.

32
1977 photo of impact of beach sand mining in Puerto Rico

33
Tap roots of pine trees left stranded by erosion (1991 photo). Beach sand mining along the Pi ones shoreline in Puerto Rico to build the international airport contributed to a severe erosion problem culminating in a massive seawall built in 2000.

34
Aerial view of Pi ones area taken after Hurricane Hugo (1989). Sand mining created a severe erosion problem.

35
Artificial dunes were built in the mid 1980’s to combat the Pi ones erosion problem. Swell from a January, 1988 winter storm removed most of the dunes. The poles had been covered by over 10 feet of sand.

36
Another source of erosion information in Puerto Rico is a qualitative discussion by Morelock (1978). White bars show his critical erosion areas. XXX’s are seawalls.

37
As in many places, a major contributor to coastal hazard problems is overbuilding at the coast. Here is the Condado sector of San Juan. Condado Lagoon

38
The walled city of Old San Juan sits safely high atop an eolianite ridge A squatter development called La Perla built outside the walls on the slopes of the ridge places many homes and people in a hazardous location. La Perla

39
Seismic Hazards Puerto Rico sits amid several active Caribbean and Atlantic tectonic zones Hazards include ground shaking, liquefaction potential, and tsunamis

40
Generalized tectonic setting. From McCann (1984)
")
41
From McCann (1984)
")
42
October 1918 Mona Passage earthquake, Modified Mercalli Scale. From McCann (1984). Mercalli Scale of V can be enough to cause liquefaction in which case all major metropolitan areas of Puerto Rico are at risk.
. Mercalli Scale of V can be enough to cause liquefaction in which case all major metropolitan areas of Puerto Rico are at risk..")
43
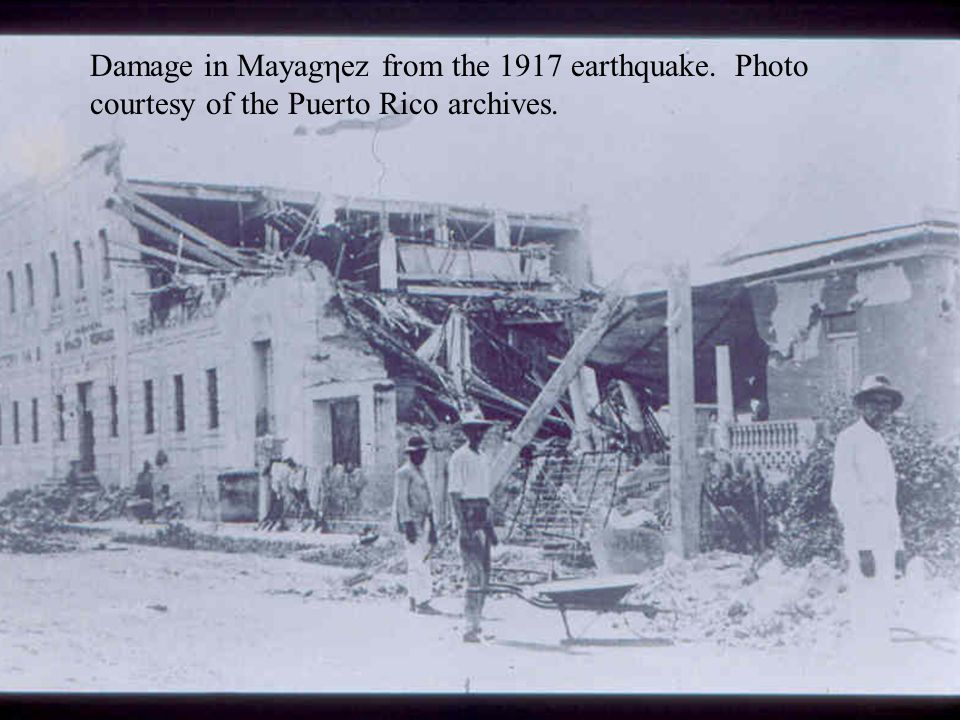
Damage in Mayag ez from the 1917 earthquake. Photo courtesy of the Puerto Rico archives.

45
Modified Mercalli Scale from November 1867 Virgin Islands earthquake.

46
Much of the metropolitan San Juan development is on artificial fill emplaced before or without strict codes or enforcement. A disaster waiting to happen.

47
Tropical weathering provides unstable material easily destabilized by ground shaking during an earthquake or by intense rains.

48
Notches cut into the weathered hillside for home sites create oversteepened slopes with increased potential for landslides.

49
Some slope stabilization efforts have been undertaken such as in this example from the Luquillo National Forest.

50
Hazard Categories considered in coastal hazard map preparation 1.Shoreline Setting Hazards 2.Marine Hazards 3.Slope and Seismic Hazards 4.Riverine Hazards 5.Development Hazards 6.Engineering Hazards

51
Hazard Categories Shoreline Setting Hazards—long-term severe shoreline problems (e.g., erosion). Marine Hazards—short-term storm impacts (e.g., waves, storm surge) Slope and Seismic Hazards—areas prone to landslides during earthquakes and heavy rains (e.g., steep slopes, weathered rock), or prone to liquefaction during earthquakes (artificial fill)
 Slope and Seismic Hazards—areas prone to landslides during earthquakes and heavy rains (e.g., steep slopes, weathered rock), or prone to liquefaction during earthquakes (artificial fill).")
52
Hazard Categories Riverine Hazards—areas with historical floods, dams upstream, etc. Development Hazards—high-density development or low-density development in dangerous location Engineering Hazards—shoreline engineering negatively impacting shoreline (e.g., breakwater blocking longshore sand movement) or areas where natural protection has been removed (e.g., beach or dune sand mining)
 or areas where natural protection has been removed (e.g., beach or dune sand mining).")
53
Methodology 1.USGS topographic quadrangle maps are used as bases 2.Quads were numbered moving clockwise starting in San Juan 3.Within each quad, the shoreline is divided into natural geomorphic units representing "reaches" or "stretches" (coastal cells or coastal compartments).
.")
54
Methodology, continued 4.The individual shoreline stretches are numbered sequentially 5.Published data evaluated to determine hazards that have been, are, or could be active within each shoreline stretch 6.If a hazard is present within only part of a stretch it is counted as one-half of a hazard

55
Methodology, conclusion 7.Each coastal stretch is designated a relative hazard rating based on the following: E = Extreme—more than 4 identifiable hazards H = High—3 to 4 identifiable hazards M = Moderate—at least 2 hazards L = Low—1 or no hazard

56
U.S. Geological Survey Topographic maps were used as bases. They were numbered clockwise, starting in San Juan (Map 1). Only this portion of the island was mapped. Puerto Rico Culebra Vieques
. Only this portion of the island was mapped. Puerto Rico Culebra Vieques.")
57
List of Coastal Hazards Maps Map 1. San Juan Map 2. Carolina Map 3. Río Grande Map 4. Fajardo and Cayo Icacos (west) Map 5. Fajardo and Cayo Icacos (east) Map 8. Vieques Map 7/9. Punta Puerca and Naguabo Map 10. Humacao Map 11. Punta Guayanés Map 12/13. Punta Tuna and Yabucoa Map 35. Vega Alta Map 36. Bayamón
 Map 5. Fajardo and Cayo Icacos (east) Map 8. Vieques Map 7/9. Punta Puerca and Naguabo Map 10. Humacao Map 11. Punta Guayanés Map 12/13. Punta Tuna and Yabucoa Map 35. Vega Alta Map 36. Bayamón.")
58
A portion of the Carolina, PR quadrangle. Shoreline stretches delineation begins on these.

59
Carolina, PR, geologic quad. Shoreline stretches easily identifiable between rocky headlands (Quaternary eolianite, Qe).
..")
60
Aerial view of area shown on quads, view to west. Boca de Cangrejos Punta Cangrejos

61
USGS Hydrologic Atlases provide data on historical flooding such as this from Haire (1975). Shades of blue represent different floods.

62
Coastal Flood Zones Incursion of marine waters from storm surge and storm- wave swash is a hazard especially on the northern coast.

63
Historical storm-wave swash coastal flooding caused by swell from North Atlantic winter storms. Mapped by Fields and Jordan (1972).
..")
64
Storm surge from Hurricane Hugo was minimal, but enough to ground this ferry in Fajardo.

65
Their ship has come in!

66
Storm surge potential in Puerto Rico is relatively low because of the narrow, steep insular shelf. Surge from Hugo was typically about 1.5 meters shown here to scale on two typical shoreline types found in Puerto Rico. Thus, storm surge flooding is not normally a major problem.

67
A portion of the Carolina, PR, Coastal Hazard Map.

68
A portion of Coastal Hazard Map 36. Bayamón.

69
The portion of Coastal Hazard Map 1, San Juan.

70
Conclusions Hazard maps compile already existing data Maps allow at-a-glance visualization of important processes Spreadsheet compiles existing or easily measured parameters Can be expanded or altered to suit local needs Low cost

71
El Morro Fort guards the entrance to San Juan Harbor

72
References Cited Bush, David M., 1991, Impact of Hurricane Hugo on the Rocky Coast of Puerto Rico, (in) Finkl, Charles W., and Pilkey, Orrin H., (eds.), Impacts of hurricane Hugo: September 10-22, 1989, Journal of Coastal Research, Special Issue #8, p. 49-67. Bush, David M., William J. Neal, Robert S. Young, and Orrin H. Pilkey, 1999. Utilization of Geoindicators for Rapid Assessment of Coastal-hazard Risk and Mitigation, Ocean and Coastal Management, vol. 42, no. 8, p. 647-670. Bush, David M., Bruce R. Richmond, and William J. Neal, 2001. Coastal Zone Hazard Maps: Eastern Puerto Rico. Environmental Geosciences, 8(1), p. 38-60. Bryant, E.A., 1991. Natural Hazards. Cambridge University Press, 294 p. Fields, F.K., and Jordan, D.G., 1972, Storm-wave swash along the north coast of Puerto Rico: U.S. Geological Survey Hydrologic Investigations: Atlas H.A. 432, in two sheets. Haire, W. J., 1975. Floods in the Carolina-Rio Grande area, northeastern Puerto Rico. U. S. Geological Survey Hydrologic Atlas HA-533, 1 sheet. McCann, W.R., 1984, On the earthquake hazard of Puerto Rico and the Virgin Islands; In Workshop on Geologic Hazards in PR, April 4-6, 1984, San Juan, PR; U.S. Geological Survey Open-File Report 84-761. Thieler, E.R. and Danforth, W.W., 1993. Historical Shoreline Changes in Puerto Rico, 1901-1987. Reston, Virginia: U.S. Geological Survey Open-File Report No. 93- 574, 267 p., 39 plates
, p Bryant, E.A., Natural Hazards. Cambridge University Press, 294 p. Fields, F.K., and Jordan, D.G., 1972, Storm-wave swash along the north coast of Puerto Rico: U.S. Geological Survey Hydrologic Investigations: Atlas H.A. 432, in two sheets. Haire, W. J., Floods in the Carolina-Rio Grande area, northeastern Puerto Rico. U. S. Geological Survey Hydrologic Atlas HA-533, 1 sheet. McCann, W.R., 1984, On the earthquake hazard of Puerto Rico and the Virgin Islands; In Workshop on Geologic Hazards in PR, April 4-6, 1984, San Juan, PR; U.S. Geological Survey Open-File Report Thieler, E.R. and Danforth, W.W., Historical Shoreline Changes in Puerto Rico, Reston, Virginia: U.S. Geological Survey Open-File Report No , 267 p., 39 plates.")
Similar presentations


 Kelin Whipple Ph.D. (Mentor) Mathew Rossi (Graduate Student) Arizona State University School of Earth.>")


= Distance between crests, Wave height (H) = Vertical distance between the crest and the trough.>")