Download presentation
Presentation is loading. Please wait.

1
ACCELERATING SUSTAINABLE POVERTY REDUCTION THROUGH COMMUNITY EMPOWERMENT 1 Deputy Minister for Poverty, Labor and SMEs Ministry of National Development Planning/National Development Planning Agency (Bappenas) Jakarta, May 25, 2010
 Jakarta, May 25, 2010")
2
I.Poverty reduction in the national development framework II.Poverty Situation in Indonesia III.National Program for Community Empowerment (PNPM Mandiri) IV.PNPM Monitoring 2 Outline
 IV.PNPM Monitoring 2 Outline")
3
Poverty Reduction in Indonesias National Development LTNDP MDGs & Other International Conventions Implementation Of Poverty Reduction Programs MTNDP Strategic Plan Sectors program National Development Agenda 2004-2009 1. Realizing a safe & Peaceful Indonesia 2. Realizing a Just & Democratic Indonesia 3. Enhancing the Prosperity of the People: a.Reducing the number of poor and open unemployment b.Improving the quality of human resources c.Improving the quality of environment and natural resources management d.Increasing the infrastructure Regionals Program National Budget Regional Budget Annual Work Plan Poverty Reduction as the priority of national development National Poverty Reduction Strategy

4
MEDIUM TERM DEVELOPMENT GOAL 2005 2006 2007 2008 2009 Economic growth 5.7% 5.5 % 6.3% 6.1% 4.5% Unemployment 11.24% 10.28% 9.11% 8.39% 7.87% Poverty rate 15.97% 17.75 % 15.42% 15.42% 14.15% PROJECTION 2010 PROJECTION 2014 Economic growth 5.5% -5.6% 7.0%-7.7% Unemployment 7.6% 5%-6% Poverty rate 12.0%-13.5% 8%-10% Source: Medium Term Development Goal (RPJM) 2004-2009 and 2010-2014 4 SOCIAL AND ECONOMIC WELFARE PEACE AND SAFETY JUSTICE AND DEMOCRACY Economic Development and Peoples Welfare Governance Reform Democracy Law Supremacy and combating Corruption Inclusive Growth and Justice 3 AGENDA IN 2004-2009 5 DEVELOPMENT AGENDA IN THE RPJM 2009-2014
 and SOCIAL AND ECONOMIC WELFARE PEACE AND SAFETY JUSTICE AND DEMOCRACY Economic Development and Peoples Welfare Governance Reform Democracy Law Supremacy and combating Corruption Inclusive Growth and Justice 3 AGENDA IN DEVELOPMENT AGENDA IN THE RPJM")
5
TRIPLE-TRACK DEVELOPMENT STRATEGY Pro-Growth : Strategy to increase and accelerate economic growth through promoting investment, exports, and businesses including the improvement of investment climate. Pro-Job : Strategy to create employment opportunities including the the establishment of a flexible labor market and creating a conducive industrial relations. Pro-Poor : Strategy to reduce poverty and to revitalize agriculture sector, forestry, maritime, rural economy. In the medium and long-term period the poverty alleviation strategy is also aimed at increasing the capacity and quality of the community level contributed to local development, and to provide access for the poor in basic services including education, health, sanitation/clean water, as well as rural infrastructure.

6
Economic Growth and Stability Employment Creation Poverty Reduction Peoples Welfare Basic Needs Improvement Programs Social Protection System Harmonization Community Empowerment Programs PNPM: Small-scale infrastructure Economic productivity Environment improvement Human resources improvement Fiscal-Monetary Policies Infrastructure Acceleration Package Investment Climate Package Energy policy SMEs Package Etc. Price Stabilization (rice, education, health, basic infrastructure) CCT & other social programs Labor-related Programs Framework fro Welfare Improvement
 CCT & other social programs Labor-related Programs Framework fro Welfare Improvement.")
7
3 CLUSTERS OF THE POVERTY REDUCTION PROGRAMS POVERTY REDUCTION PROGRAMS Cluster 1 Program on Social Welfare and Social Security Cluster 2 Community Empowerment Programs Cluster 3 SMEs Programs Target: very poor, poor and near poor HH Target: Poor Communities Target: SMEs S E L F R E L I A N C E

8
8 II. Poverty Situation in Indonesia

9
Tingkat Kemiskinan di Indonesia: 1976-2009 Sources: Central Statistics Agency 9 Notes: Methodology improvement in 1996. Poverty Trend in Indonesia: 1976-2009

10
Inequal distribution of poor people across regions 57.1% poor lives in Java-Bali 21% poor lives in Sumatera 21.9% poor are spreaded in the rest of the country

11
Sources: Susenas 2009, CSA

12
12 III. National Program for Community Empowerment (PNPM Mandiri)
")
13
A national program to reduce poverty through community empowerment with the objective of increasing community capacity & self-help group to achieve better standard of living & welfare poverty reduction is more sustainable 1. PNPM Mandiri 2. Why is PNPM? Harmonize empowerment activities implemented by various ministries to reduce inefficiency & overlapped activities, mechanisms, and communitys institutions. Better targeting the poor at sub districts and villages.

14
PNPM Components: a.Community Empowerment Facilitator provision to increase community awareness and capacity to form a self-help group & advisory body at the village. Output: formation of self-help group and elected advisory body. b.Community grant Provide community grant to the formed self-help group, to finance identified activities, selected in the advisory bodys forum. The grant is an open menu for: a) basic infrastructure (rural road & irrigations, school/health post renovations, etc); b) economic activities, etc. c. Local government and stakeholder capacity building A set of activities for strengthening local government & stakeholder capacity to create a positive, conducive, & synergetic environment for the community, in particular for the poor. d.Program Management: MIS, Monitoring & Evaluation, operational supports
 basic infrastructure (rural road & irrigations, school/health post renovations, etc); b) economic activities, etc. c. Local government and stakeholder capacity building A set of activities for strengthening local government & stakeholder capacity to create a positive, conducive, & synergetic environment for the community, in particular for the poor. d.Program Management: MIS, Monitoring & Evaluation, operational supports.")
15
8. Beneficiaries 3. Poverty Reflections 2. Community Meetings 1. Socialisation in the communities 6. Planning 5. Community Organizating 7. Implementation 4. Social Mapping How does the empowerment process work?

16
MARKET LINKAGES Microfinance Smallholder development Information technology Renewable energy Non-bank (micro-credit institutions) SOCIAL PROTECTION Womens participation Justice for the Poor Helping Marginal Groups Budget transparency Community trust funds Sustainability RESPONSIVE GOVERNMENT/EMPOWERED COMMUNITIES Strengthening bottom-up planning and budgeting; Improving local government representation and responsiveness (sub-districts, village heads, village legislative bodies, etc) Improving social service delivery to the poor. Pro-poor planning and budgeting Putting poverty reduction activities in the hand of the community for sustainability Block grant tansfer to the poor communities

17
1.Harmonize PNPM-core programs by: Formulate a General guidelines & manuals Monitoring-evaluation, MIS, Complain handling Technical ops. Manuals of each core program Focus location of PNPM core to poor kecamatan and desa to provide platform for PNPM-Support later on. 2.Increase coordination by establishing PNPM National Oversight Body & PNPM Coordination Team at provincial and district level. 3.Identify and integrate PNPM-support from sectoral programs onto PNPM-Core. 4.Improve facilitators quality (training) & mobilization 1.Harmonize PNPM-core programs by: Formulate a General guidelines & manuals Monitoring-evaluation, MIS, Complain handling Technical ops. Manuals of each core program Focus location of PNPM core to poor kecamatan and desa to provide platform for PNPM-Support later on. 2.Increase coordination by establishing PNPM National Oversight Body & PNPM Coordination Team at provincial and district level. 3.Identify and integrate PNPM-support from sectoral programs onto PNPM-Core. 4.Improve facilitators quality (training) & mobilization Sinchronize community participatory planning process into the regular/local government development plan. Improve integration and synergy between PNPM- Core and Support Integrated MIS for better monitoring and evaluation Increase Local Government Ownership for a decentralized program. Sinchronize community participatory planning process into the regular/local government development plan. Improve integration and synergy between PNPM- Core and Support Integrated MIS for better monitoring and evaluation Increase Local Government Ownership for a decentralized program. Harmonization Stages 2009 - 2015 2007-2008 (Transition)
 & mobilization 1.Harmonize PNPM-core programs by: Formulate a General guidelines & manuals Monitoring-evaluation, MIS, Complain handling Technical ops. Manuals of each core program Focus location of PNPM core to poor kecamatan and desa to provide platform for PNPM-Support later on. 2.Increase coordination by establishing PNPM National Oversight Body & PNPM Coordination Team at provincial and district level. 3.Identify and integrate PNPM-support from sectoral programs onto PNPM-Core. 4.Improve facilitators quality (training) & mobilization Sinchronize community participatory planning process into the regular/local government development plan. Improve integration and synergy between PNPM- Core and Support Integrated MIS for better monitoring and evaluation Increase Local Government Ownership for a decentralized program. Sinchronize community participatory planning process into the regular/local government development plan. Improve integration and synergy between PNPM- Core and Support Integrated MIS for better monitoring and evaluation Increase Local Government Ownership for a decentralized program. Harmonization Stages (Transition).")
18
No.Employed staffPersons/years 1.National Level61 2.Province Level220 3.District Level686 4.Sub-District Level - Sub-District Facilitator - UPK Management Staff (from the community) 9,570 13,113 5.Village Level: Village Facilitator11,998 Total of employed staff35,648 Employment at the community level (work-days)**741,868 Impact of PNPM on employment (2009) ** 2009 is not a full year data yet. In 2007 total employment generated at the community level was: 9,97 mill work-days; In 2008: 16,8 million work-days.

19
Impact on increases per capita consumption among poor households Households in the first quintile of predicted per capita consumption saw approximately 10% greater gains in comparison with control areas between 2002 and 2007. Impact on expands access to health care: Household heads in PNPM areas were 11% more likely to see expanded access to outpatient care.

20
Impact on Poverty Reduction Households in poor kecamatan are 9-12% more likely to move out of poverty than households in control areas.

21
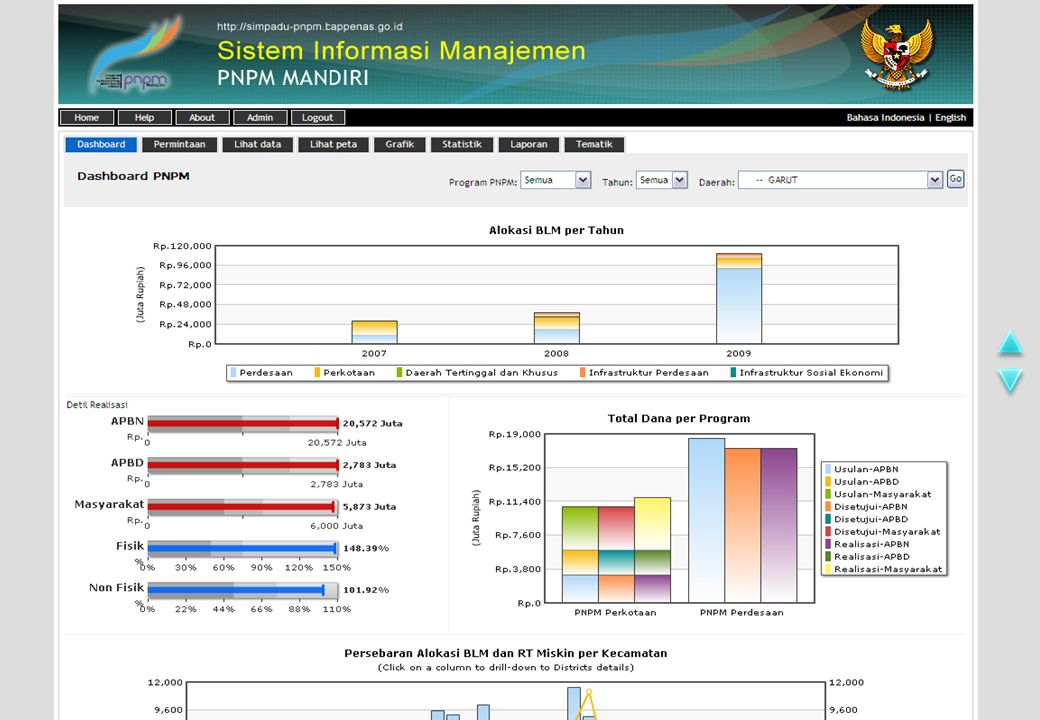
21 IV. PNPM Mandiri Monitoring system (SIMPADU)
")
22
SIMPADU PNPM integrates data from 5 core programs within PNPM Mandiri. Planning and realization data of PNPM activities Provincial, district, and sub-district level Time period from 2007 to 2010 Display demographic data from Podes 2006 (village data) and PPLS 2008 (poor HH data by name by address) What is inside SIMPADU PNPM? 22
 and PPLS 2008 (poor HH data by name by address) What is inside SIMPADU PNPM. 22.")
23
Features for Public Users 23 DASHBOARD CREATE QUERIES VIEW DATA VIEW MAP National – Province – District Total of 3 years, or by year By Program National – Province – District Total of 3 years, or by year By Program Available for anyone with internet access Create specific queries based on province, district, sub-district, type of activities, or time period Create specific queries based on province, district, sub-district, type of activities, or time period To view details of proposed and realized activities, together with the profile of particular sub-district To view details of proposed and realized activities, together with the profile of particular sub-district To create queries spatially

24
24 Features for Internal Users Only accessible for the Management & Control Team, in order to conduct for advanced analysis Maximum, Minimum, Average, Variants, Deviation Maximum, Minimum, Average, Variants, Deviation Create Reports of Proposed Activities, Progress of Activities, Realization of Activities, and Community Participation Create Reports of Proposed Activities, Progress of Activities, Realization of Activities, and Community Participation View Data Distribution Spatially GRAPHICS STATISTICS REPORTS THEMATIC MAPS Visual Analysis: Baseline Data, Realization of Activities, Demography data, and Disaster Data Visual Analysis: Baseline Data, Realization of Activities, Demography data, and Disaster Data

26
FUND ALLOCATION COMPARED TO THE NUMBER OF POOR PEOPLE IN EACH PROVINCE 26 *) Fund form National Budget and Regional Budget, year 2010
 Fund form National Budget and Regional Budget, year 2010")
27
THE COVERAGE OF PNPM MANDIRI (NUMBER OF SUB-DISTRICT) 27
 27")
28
THE USE OF BLOCK GRANT BY THE COMMUNITIES *) Data based on PNPM Rural, PNPM Urban, and PNPM Underdeveloped and Special Region, 2009 Health, 22.13% Education, 2.01% Social, 9.38% Agriculture, 0.54% Transportation, 52.475% Economy, 10.65% Environment, 0.99%
 Data based on PNPM Rural, PNPM Urban, and PNPM Underdeveloped and Special Region, 2009 Health, 22.13% Education, 2.01% Social, 9.38% Agriculture, 0.54% Transportation, % Economy, 10.65% Environment, 0.99%")
29
Distribution of Households without proper access to Sanitation 29 Variable: Percentage of Households without Access to Sanitation RangesColorLegend -No Data 0 – 12.00 12.01 – 24.00 24.01 – 36.00 36.01 – 48.00 48.01 – 60.00 > 60.00

30
PNPM Fund Distribution for Sanitation by District Level in East Java, 2009 30 Variable: Access/Transportation RangesColorLegend -No Data 0 – 15,000,000 15,000,000.01– 25,000,000 25,000,000.01– 35,000,000 35,000,000.01– 45,000,000 45,000,000.01– 55,000,000 > 55,000,000

31
THANK YOU 31

Similar presentations

 A Review and Implications for Agricultural/Rural Statistics Ernst Lutz Rural Development Department, Africa Region,>")


 Ms. Noeleen Heyzer Under Secretary-General and Executive Secretary.>")


