Download presentation
Presentation is loading. Please wait.

1
Geology and Nonrenewable Mineral Resources
Chapter 16 Geology and Nonrenewable Mineral Resources

2
Geologic Processes Plate Tectonics
Section 16-1 & 16-2 Geologic Processes Plate Tectonics

3
GEOLOGIC PROCESSES The earth is made up of a core, mantle, and crust and is constantly changing as a result of processes taking place on and below its surface. The earth’s interior consists of: Core: innermost zone with solid inner core and molten outer core that is extremely hot. Mantle: solid rock with a rigid outer part (asthenosphere) that is melted pliable rock. Crust: Outermost zone which underlies the continents.
 that is melted pliable rock. Crust: Outermost zone which underlies the continents.")
4
GEOLOGIC PROCESSES Major features of the earth’s crust and upper mantle. Figure 15-2

5
Tectonic plate Inner core
Spreading center Collision between two continents Oceanic tectonic plate Ocean trench Oceanic tectonic plate Plate movement Plate movement Tectonic plate Oceanic crust Oceanic crust Subduction zone Continental crust Continental crust Material cools as it reaches the outer mantle Cold dense material falls back through mantle Hot material rising through the mantle Mantle convection cell Figure 15.3 Natural capital: the earth’s crust is made up of a mosaic of huge rigid plates, called tectonic plates, which move around in response to forces in the mantle. Mantle Two plates move towards each other. One is subducted back into the mantle on a falling convection current. Hot outer core Inner core Fig. 15-3, p. 337

6
GEOLOGIC PROCESSES Huge volumes of heated and molten rack moving around the earth’s interior form massive solid plates that move extremely slowly across the earth’s surface. Tectonic plates: huge rigid plates that are moved with convection cells or currents by floating on magma or molten rock.

7
The Earth’s Major Tectonic Plates
Figure 15-4

8
The Earth’s Major Tectonic Plates
The extremely slow movements of these plates cause them to form boundaries Convergent plate boundaries grind into one another Divergent plate boundaries plates move apart Transform plate boundaries slide past each other Figure 15-4

9
Boundaries Divergent – the plates move apart in opposite directions.

10
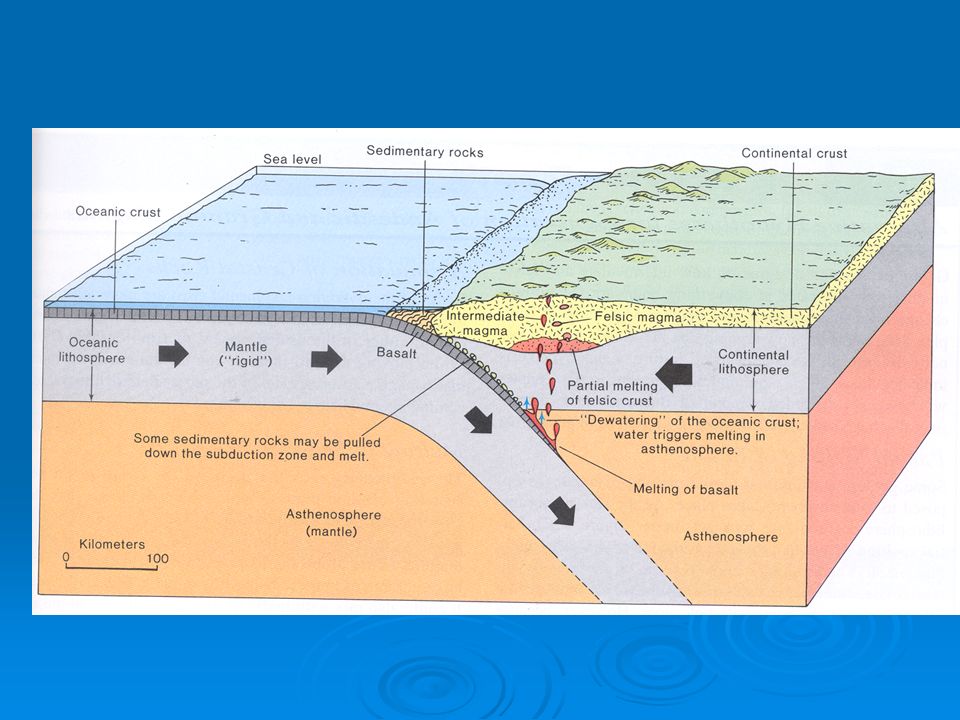
Convergent – the plates push together by internal forces.
At most convergent plate boundaries, the oceanic lithosphere is carried downward under the island or continent. Earthquakes are common here. It also forms an ocean ridge or a mountain range.

12
Boundaries (Continued)
Transform – plates slide next or past each other in opposite directions along a fracture. California will not fall into the ocean!

13
Figure 15.4 Natural capital: the earth’s major tectonic plates. The extremely slow movements of these plates cause them to grind into one another at convergent plate boundaries, move apart from one another at divergent plate boundaries, and slide past one another at transform plate boundaries. QUESTION: What plate are you floating on? Fig. 15-4, p. 338

14
GEOLOGIC PROCESSES The San Andreas Fault is an example of a transform fault. Figure 15-5

15
Pacific Plate The Pacific plate is off the coast of California. Lots of volcanoes and earthquakes occur here. “California will fall into the ocean” idea. It is the largest plate and the location of the ring of fire.

16
Wearing Down and Building Up the Earth’s Surface
Weathering is an external process that wears the earth’s surface down. Figure 15-6

17
Importance Plate movement adds new land at boundaries, produces mountains, trenches, earthquakes and volcanoes.

18
Geologic Hazards & Minerals, Rocks & The Rock Cycle
Section 16-3 & 16-4 Geologic Hazards & Minerals, Rocks & The Rock Cycle

19
MINERALS, ROCKS, AND THE ROCK CYCLE
The earth’s crust consists of solid inorganic elements and compounds called minerals that can sometimes be used as resources. Mineral resource: is a concentration of naturally occurring material in or on the earth’s crust that can be extracted and processed into useful materials at an affordable cost.

20
General Classification of Nonrenewable Mineral Resources
The U.S. Geological Survey classifies mineral resources into four major categories: Identified: known location, quantity, and quality or existence known based on direct evidence and measurements. Undiscovered: potential supplies that are assumed to exist. Reserves: identified resources that can be extracted profitably. Other: undiscovered or identified resources not classified as reserves

21
General Classification of Nonrenewable Mineral Resources
Examples are fossil fuels (coal, oil), metallic minerals (copper, iron), and nonmetallic minerals (sand, gravel). Figure 15-7
, metallic minerals (copper, iron), and nonmetallic minerals (sand, gravel). Figure")
22
Rock Cycle The Rock Cycle – the interaction of processes that change rocks from one type to another Rock Cycle Figure 15-8

23
Steps

24
GEOLOGIC PROCESSES Deposits of nonrenewable mineral resources in the earth’s crust vary in their abundance and distribution. A very slow chemical cycle recycles three types of rock found in the earth’s crust: Sedimentary rock (sandstone, limestone). Metamorphic rock (slate, marble, quartzite). Igneous rock (granite, pumice, basalt).
. Metamorphic rock (slate, marble, quartzite). Igneous rock (granite, pumice, basalt).")
25
Element Abundance Oxygen: The most abundant element in Earth’s crust Nitrogen: The most abundant element in the Earth’s atmosphere. Iron: The most abundant element in the Earth’s core. Aluminum: The element commercially extracted from bauxite

26
Rock Classification Igneous Rock
Description – forms the bulk of the earth’s crust. It is the main source of many non-fuel mineral resources. Examples – Granite, Pumice, Basalt, Diamond, Tourmaline, Garnet, Ruby, Sapphire

27
Sedimentary Rock Description – rock formed from sediments. Most form when rocks are weathered and eroded into small pieces, transported, and deposited in a body of surface water. Examples: sandstone (sand stuck together), Conglomerate (rounded & concrete-looking) and Breccia (like conglomerate but w/ angular pieces)
, Conglomerate (rounded & concrete-looking) and Breccia (like conglomerate but w/ angular pieces)")
28
Metamorphic Rock Description – when preexisting rock is subjected to high temperatures (which may cause it to partially melt), high pressures, chemically active fluids, or a combination of these Location – deep within the earth Ex. limestone under heat becomes marble through crystallization Limestone -> marble sandstone -> quartzite shale -> hornfelds (slate)
, high pressures, chemically active fluids, or a combination of these. Location – deep within the earth. Ex. limestone under heat becomes marble through crystallization. Limestone -> marble. sandstone -> quartzite. shale -> hornfelds (slate)")
29
Removing & Processing Non-Renewable Mineral Resources
Section 16-5 Removing & Processing Non-Renewable Mineral Resources

30
Nonrenewable Resources
Definition – things human use that have a limited supply; they cannot be regrown or replenished by man

31
Dealing with Nonrenewable Resources
Conservation Definition – using less of a resource or reusing a resource, ex. refilling plastic laundry jugs, reusing plastic bags, etc. Problems – this requires a change in our lifestyle and some people will resist.

32
Restoration Definition – recycling our resources
Examples – aluminum, glass, tin, steel, plastics, etc. Problems – recycling a resource often costs more than using the raw material; we don’t have the technology to recycle everything

33
Sustainability Definition – prediction of how long specific resources will last; ex. we have a 200 year supply of coal in the U.S. Knowing this helps people make decisions in resource use Problems – these are only predictions; they may not be accurate

34
Natural Capital Degradation
Extracting, Processing, and Using Nonrenewable Mineral and Energy Resources Steps Environmental effects Mining Disturbed land; mining accidents; health hazards, mine waste dumping, oil spills and blowouts; noise; ugliness; heat Exploration, extraction Processing Transportation, purification, manufacturing Solid wastes; radioactive material; air, water, and soil pollution; noise; safety and health hazards; ugliness; heat Use Figure 15.10 Natural capital degradation: some harmful environmental effects of extracting, processing, and using nonrenewable mineral and energy resources. The energy required to carry out each step causes additional pollution and environmental degradation. Transportation or transmission to individual user, eventual use, and discarding Noise; ugliness; thermal water pollution; pollution of air, water, and soil; solid and radioactive wastes; safety and health hazards; heat Fig , p. 344

35
Harvesting Nonrenewable Resources Costs
Ownership costs – equipment, labor, safety (insurance), environmental costs (reclamation, pollution control, air monitors, water treatment, etc.), taxes External costs – processing the resource, transporting the resource Marginal costs – research: finding new sources of the resource and new ways to harvest it
, environmental costs (reclamation, pollution control, air monitors, water treatment, etc.), taxes. External costs – processing the resource, transporting the resource. Marginal costs – research: finding new sources of the resource and new ways to harvest it.")
36
Benefits Direct – money received for resources; provides many jobs
Indirect – land can be reclaimed (brought back to original condition) and sold for profit.
 and sold for profit.")
37
ENVIRONMENTAL EFFECTS OF USING MINERAL RESOURCES
Minerals are removed through a variety of methods that vary widely in their costs, safety factors, and levels of environmental harm. A variety of methods are used based on mineral depth. Surface mining: shallow deposits are removed. Subsurface mining: deep deposits are removed.

38
Removal Methods Surface Mining
Description – if resource is <200 ft. from the surface, the topsoil is removed (and saved), explosives are used to break up the rocks and to remove the resource, reclamation follows Benefits – cheap, easy, efficient Costs – tears up the land (temporarily), byproducts produce an acid that can accumulate in rivers and lakes
, explosives are used to break up the rocks and to remove the resource, reclamation follows. Benefits – cheap, easy, efficient. Costs – tears up the land (temporarily), byproducts produce an acid that can accumulate in rivers and lakes.")
39
Removal Methods (Continued)
Underground Mining Description – digging a shaft down to the resource, using machinery (and people) to tear off and remove the resource Benefits – can get to resources far underground Costs – more expensive, more time-consuming, more dangerous
 to tear off and remove the resource. Benefits – can get to resources far underground. Costs – more expensive, more time-consuming, more dangerous.")
40
Removal Methods (Continued)
Reclamation Description – returning the rock layer (overburden) and the topsoil to a surface mine, fertilizing and planting it Benefits – restores land to good condition Costs – expensive, time-consuming
 and the topsoil to a surface mine, fertilizing and planting it. Benefits – restores land to good condition. Costs – expensive, time-consuming.")
41
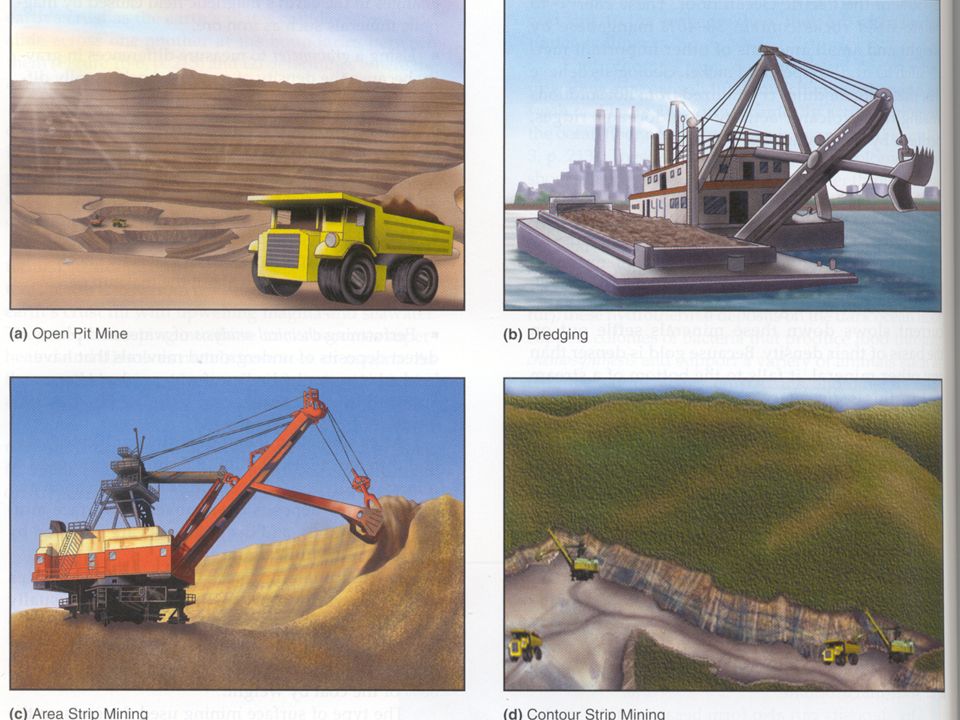
Open-pit Mining Machines dig holes and remove ores, sand, gravel, and stone. Toxic groundwater can accumulate at the bottom. Figure 15-11

42
Area Strip Mining Earth movers strips away overburden, and giant shovels removes mineral deposit. Often leaves highly erodible hills of rubble called spoil banks. Figure 15-12

43
Contour Strip Mining Used on hilly or mountainous terrain.
Unless the land is restored, a wall of dirt is left in front of a highly erodible bank called a highwall. Figure 15-13

44
Mountaintop Removal Machinery removes the tops of mountains to expose coal. The resulting waste rock and dirt are dumped into the streams and valleys below. Figure 15-14

46
Environmental Effects of Using Mineral Resources
Section 16-6 Environmental Effects of Using Mineral Resources

47
ENVIRONMENTAL EFFECTS OF USING MINERAL RESOURCES
The extraction, processing, and use of mineral resources has a large environmental impact. Figure 15-9

48
Mining Impacts Metal ores are smelted or treated with (potentially toxic) chemicals to extract the desired metal. Figure 15-15

49
Supplies of Mineral Resources
Section 16-7 Supplies of Mineral Resources

50
SUPPLIES OF MINERAL RESOURCES
The future supply of a resource depends on its affordable supply and how rapidly that supply is used. A rising price for a scarce mineral resource can increase supplies and encourage more efficient use.

51
Specific Resources & Their Uses
Limestone – abundant locally, formed from layers of seashells and organisms under pressure as they were covered; used in sidewalks, fertilizers, plastics, carpets, and more Lead – used in batteries and cars Clay – used to make books, magazines, bricks, and linoleum Gold – besides being used as money and for jewelry, gold is used in medicine (lasers, cauterizing agents) and in electronics (circuits in computers, etc.)
 and in electronics (circuits in computers, etc.)")
52
United States Central – diamonds (Arkansas), bituminous coal
West – bituminous and subbituminous coal, gold, silver, copper East – anthracite coal, bituminous coal South – some gold (SC), bituminous coal North – bituminous coal, some gold (SD, WI)
, bituminous coal. North – bituminous coal, some gold (SD, WI)")
53
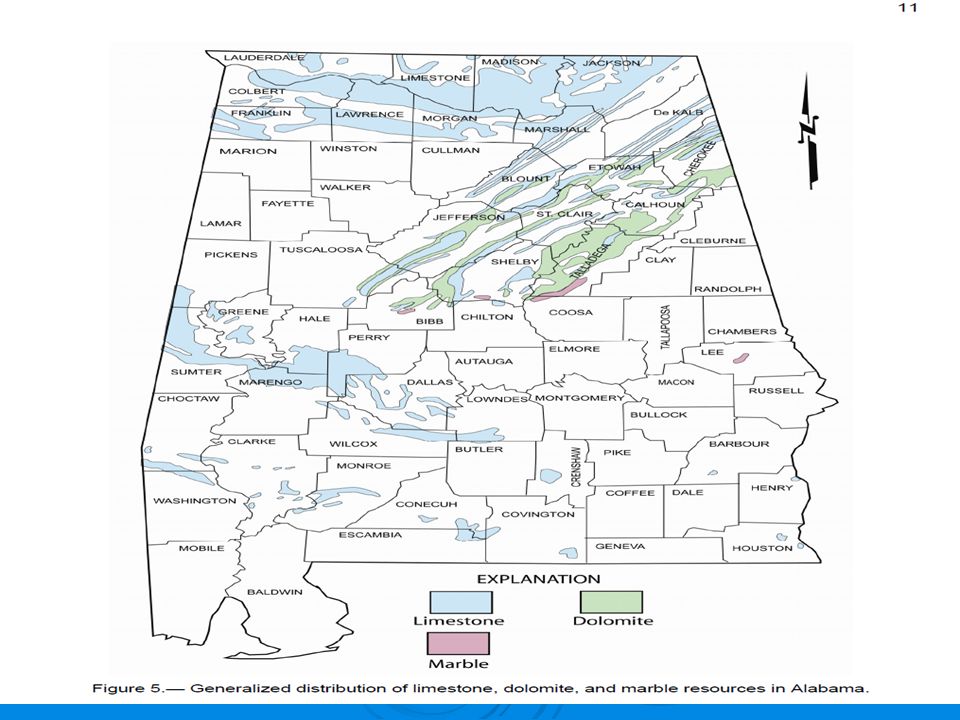
Alabama Crushed stone, including limestone, dolomite, marble, granite, sandstone, and quartzite, contributes to a thriving mineral industry in the state. Stone, along with sand, gravel, and clay, makes up a multi-million dollar nonfuel minerals industry in Alabama. In 2007, the value of these produced minerals was $1.34 billion. Approximately 9.1 metric tons of nonfuel minerals are required every year for every person in the United States to maintain the current standard of living. Materials mined in Alabama such as bauxite, chalk, recovered sulfur, salt, and shale are used extensively in both construction and industry.

55
SUPPLIES OF MINERAL RESOURCES
Depletion curves for a renewable resource using three sets of assumptions. Dashed vertical lines represent times when 80% depletion occurs. Figure 15-16

56
SUPPLIES OF MINERAL RESOURCES
New technologies can increase the mining of low-grade ores at affordable prices, but harmful environmental effects can limit this approach. Most minerals in seawater and on the deep ocean floor cost too much to extract, and there are squabbles over who owns them.

57
Getting More Minerals from the Ocean
Hydrothermal deposits form when mineral-rich superheated water shoots out of vents in solidified magma on the ocean floor. Figure 15-17

58
USING MINERAL RESOURCES MORE SUSTAINABLY
Scientists and engineers are developing new types of materials as substitutes for many metals. Recycling valuable and scarce metals saves money and has a lower environmental impact then mining and extracting them from their ores.

59
Sustainable Use of Nonrenewable Minerals
Solutions Sustainable Use of Nonrenewable Minerals • Do not waste mineral resources. • Recycle and reuse 60–80% of mineral resources. • Include the harmful environmental costs of mining and processing minerals in the prices of items (full-cost pricing). • Reduce subsidies for mining mineral resources. • Increase subsidies for recycling, reuse, and finding less environmentally harmful substitutes. • Redesign manufacturing processes to use less mineral resources and to produce less pollution and waste. Figure 15.18 Solutions: ways to achieve more sustainable use of nonrenewable mineral resources. QUESTION: Which two of the solutions do you think are the most important? • Have the mineral-based wastes of one manufacturing process become the raw materials for other processes. • Sell services instead of things. • Slow population growth. Fig , p. 351
. • Reduce subsidies for mining mineral resources. • Increase subsidies for recycling, reuse, and finding less environmentally harmful substitutes. • Redesign manufacturing processes to use less mineral resources and to produce less pollution and waste. Figure Solutions: ways to achieve more sustainable use of nonrenewable mineral resources. QUESTION: Which two of the solutions do you think are the most important • Have the mineral-based wastes of one manufacturing process become the raw materials for other processes. • Sell services instead of things. • Slow population growth. Fig , p")
60
Case Study: The Ecoindustrial Revolution
Growing signs point to an ecoindustrial revolution taking place over the next 50 years. The goal is to redesign industrial manufacturing processes to mimic how nature deals with wastes. Industries can interact in complex resource exchange webs in which wastes from manufacturer become raw materials for another.

61
Case Study: The Ecoindustrial Revolution
Figure 15-19

62
Sulfuric acid producer
Sludge Pharmaceutical plant Local farmers Sludge Greenhouses Waste heat Waste heat Waste heat Fish farming Waste heat Surplus natural gas Electric power plant Fly ash Oil refinery Surplus sulfur Waste calcium sulfate Figure 15.19 Solutions: the industrial ecosystem in Kalundborg, Denmark, reduces waste production by mimicking a natural food web. The wastes of one business become the raw materials for another. QUESTION: Is there an industrial ecosystem near where you live or go to school? If not, why not? Waste heat Cement manufacturer Surplus natural gas Sulfuric acid producer Wallboard factory Area homes Fig , p. 352

Similar presentations