Download presentation
Presentation is loading. Please wait.

1
Customer Base 200,000 Satisfied 70% (140,000) Dissatisfied 30% (60,000) New Customers Needed 24.86% Don’t Complain 90% (54,000) Do Complain 10%(6,000) Not Retained 78% Retained 22% Not Retained 10% Retained 90% Not retained 5% Retained 95% 133,000 -7,000 5,400 -600 11,800 -42,120 49,720
 Dissatisfied 30% (60,000) New Customers Needed 24.86% Don’t Complain 90% (54,000) Do Complain 10%(6,000) Not Retained 78% Retained 22% Not Retained 10% Retained 90% Not retained 5% Retained 95% 133,000 -7,000 5, , ,120 49,720")
2
Customer PerformanceRetained Customers Lost Customers New Customers Overall Performance # of Customers150,000-50,00050,000200,000 Revenue per C.$800$200$400 Sales Revenue (millions)$120$10$20$150 Percent Margin50%25% 43.8% Margin per C.$400$50$100 Gross Profit (millions)$60.0$2.5$5.0$67.5 Marketing Expense per C.$60 $300 Marketing Expenses (mill.)$9.00$3.00$15.00$27.0 Net Marketing Contribution (millions) $51.00-$0.50-$10.00$40.5 Operating Expenses (millions) $33.0 Net Profit Before Taxes (millions) $7.5
$120$10$20$150 Percent Margin50%25% 43.8% Margin per C.$400$50$100 Gross Profit (millions)$60.0$2.5$5.0$67.5 Marketing Expense per C.$60 $300 Marketing Expenses (mill.)$9.00$3.00$15.00$27.0 Net Marketing Contribution (millions) $51.00-$0.50-$10.00$40.5 Operating Expenses (millions) $33.0 Net Profit Before Taxes (millions) $7.5")
3
Customer PerformanceRetained Customers Lost Customers New Customers Overall Performance # of Customers160,000-40,00040,000200,000 Revenue per C.$800$200$400 Sales Revenue (millions)$128$8$16$152 Percent Margin50%25% 43.8% Margin per C.$400$50$100 Gross Profit (millions)$64.0$2.0$4.0$70.0 Marketing Expense per C.$65 $300 Marketing Expenses (mill.)$10.40$2.60$12.00$25.0 Net Marketing Contribution (millions) $53.60-$0.60-$8.00$45.0 Operating Expenses (millions) $33.0 Net Profit Before Taxes (millions) $12.0
$128$8$16$152 Percent Margin50%25% 43.8% Margin per C.$400$50$100 Gross Profit (millions)$64.0$2.0$4.0$70.0 Marketing Expense per C.$65 $300 Marketing Expenses (mill.)$10.40$2.60$12.00$25.0 Net Marketing Contribution (millions) $53.60-$0.60-$8.00$45.0 Operating Expenses (millions) $33.0 Net Profit Before Taxes (millions) $12.0")
4
Definitely Will Not Repurchase Will Not Repurchase Probably Will Not Repurchase Probably Will Repurchase Plan to Repurchase Definitely Will Repurchase Intention to RepurchasePercentProbability Definitely Will Repurchase25%1.00 Plan to Repurchase35%.80 Probably Will Repurchase20%.60 Probably Will Not Repurchase15%.40 Will Not Repurchase3%.20 Definitely Will Not Repurchase2%0.00 Total:100%.72 Customer Retention72%

5
Customer Life (purchase periods) Customer Life (N) (given rate of customer retention) CR = Customer Retention Rate Retention rate
 Customer Life (N) (given rate of customer retention) CR = Customer Retention Rate Retention rate")
6
Period Cash Flow Present Value of $1 Present Value of Cash Flow 0-$511.00-$51,00 1$30.909$27,30 2$42.826$34,70 3$44.751$33,00 4$49.683$33,50 5$55.621$34,20 Net Present Value of Cash Flow$111,70

8
Strategic market planning Offensive and defensive strategies Building a marketing plan

9
Specify strategic direction for each product/market and to allocate resources in a way that will bring about desired short- and long-run performance Requires an assessment of: ◦ Business performance ◦ Market attractiveness ◦ Competitive position

10
Market forces ◦ Market size ◦ Growth rate ◦ Buyer power Competitive environment ◦ Number of competitors ◦ Price rivalry ◦ Ease of entry Market access ◦ Customer familiarity ◦ Channel access ◦ Sales requirements

11
Differentiation position ◦ Product quality ◦ Service quality ◦ Brand image Cost position ◦ Unit cost ◦ Transaction cost ◦ Marketing expenses Marketing position (presence) ◦ Market share ◦ Brand awareness ◦ Distribution
 ◦ Market share ◦ Brand awareness ◦ Distribution")
12
Invest to grow ◦ Invest marketing resources to grow the market or market share Improve position ◦ Invest to improve and/or strengthen competitive position New market entry ◦ Invest to enter new attractive markets or develop new product markets

13
Protect position ◦ Invest to protect market share and competitive advantage Optimize position ◦ Optimize price-volume and marketing resources to maximize profits Monetize ◦ Manage market position for maximum cash flow with limited marketing resources Harvest/Divest ◦ Manage the product for maximum short-run cash flow or minimum losses

14
New market entry Improve position Invest to grow Improve position Protect position Invest to grow Protect position Improve position Optimize position Harvest Improve position Optimize position Invest to grow Protect position Optimize position Harvest or DivestMonetize, Harvest, or Divest Market attractiveness Competitive position

15
Creativity versus structure Why marketing plan? ◦ Identifying opportunities ◦ Focused market strategy ◦ Resource allocation ◦ Performance roadmap Building a marketing plan

16
Part I – Situation analysis (where are we now?) ◦ Step 1: Current situation ◦ Step 2: SWOT analysis Part II – Marketing strategy (where do we want to go?) ◦ Step 3: Strategic market plan ◦ Step 4: Marketing mix strategy Part III – Performance plan (what is the expected impact?) ◦ Step 5: Develop a revenue plan + marketing budget ◦ Step 6: Develop a profit plan ◦ Step 7: Performance review
 ◦ Step 1: Current situation ◦ Step 2: SWOT analysis Part II – Marketing strategy (where do we want to go ) ◦ Step 3: Strategic market plan ◦ Step 4: Marketing mix strategy Part III – Performance plan (what is the expected impact ) ◦ Step 5: Develop a revenue plan + marketing budget ◦ Step 6: Develop a profit plan ◦ Step 7: Performance review")
17
Analyzing customers ◦ Needs analysis ◦ Decision making processes Analyzing context ◦ Demographic environment ◦ Economic environment ◦ Socio-cultural environment ◦ Political/legal environment ◦ Technological environment ◦ Natural environment Analyzing the company ◦ Analysis of the business model ◦ Competitive advantage ◦ Collaborators and complementers analysis Analyzing competitors

19
Part I – Situation analysis (where are we now?) ◦ Step 1: Current situation ◦ Step 2: SWOT analysis Part II – Marketing strategy (where do we want to go?) ◦ Step 3: Strategic market plan ◦ Step 4: Marketing mix strategy Part III – Performance plan (what is the expected impact?) ◦ Step 5: Develop a revenue plan + marketing budget ◦ Step 6: Develop a profit plan ◦ Step 7: Performance review
 ◦ Step 1: Current situation ◦ Step 2: SWOT analysis Part II – Marketing strategy (where do we want to go ) ◦ Step 3: Strategic market plan ◦ Step 4: Marketing mix strategy Part III – Performance plan (what is the expected impact ) ◦ Step 5: Develop a revenue plan + marketing budget ◦ Step 6: Develop a profit plan ◦ Step 7: Performance review")
20
External factors ◦ Opportunities ◦ Threats Internal factors ◦ Strengths ◦ Weaknesses

21
Part I – Situation analysis (where are we now?) ◦ Step 1: Current situation ◦ Step 2: SWOT analysis Part II – Marketing strategy (where do we want to go?) ◦ Step 3: Strategic market plan ◦ Step 4: Marketing mix strategy Part III – Performance plan (what is the expected impact?) ◦ Step 5: Develop a revenue plan + marketing budget ◦ Step 6: Develop a profit plan ◦ Step 7: Performance review
 ◦ Step 1: Current situation ◦ Step 2: SWOT analysis Part II – Marketing strategy (where do we want to go ) ◦ Step 3: Strategic market plan ◦ Step 4: Marketing mix strategy Part III – Performance plan (what is the expected impact ) ◦ Step 5: Develop a revenue plan + marketing budget ◦ Step 6: Develop a profit plan ◦ Step 7: Performance review")
22
Purpose ◦ A marketing plan lays out a campaign to fulfill a company’s marketing strategy Content ◦ Executive summary ◦ Table of contents ◦ Summary of current situation ◦ Assessment of market opportunity ◦ Summary of the company’s marketing strategy ◦ A marketing budget ◦ Forecast unit sales and revenues ◦ Plan for monitoring and evaluating action plans

23
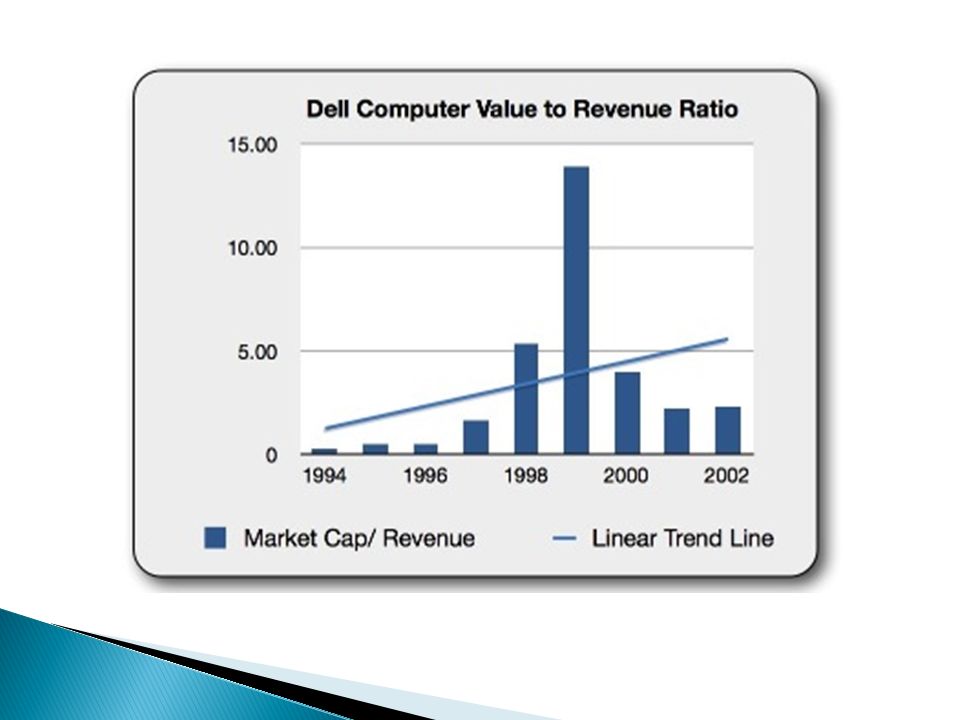
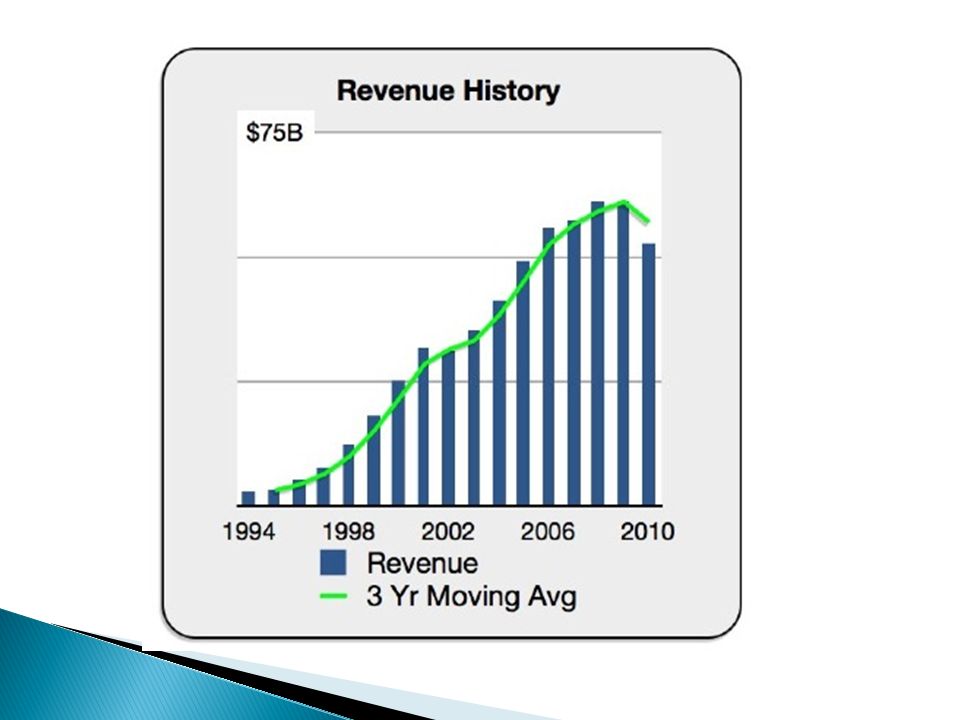
Graphs copied from: ◦ www.value-based- marketing.com/uncategorized/what-would-you- do-with-dell-computer/#more-21 What would you do with Dell computer?

24
”Create a better way to buy a computer” Reduced distribution costs: By cutting out the middleman, distribution costs were reduced giving the company a competitive price position. ◦ Improve the buying experience: Dell’s knowledgeable staff had expertise to help customers who were frequently unknowing. In contrast, IBM, Apple and others were selling through resellers who were not necessarily knowledgeable about the product. Michael Dell surmised that customers would find value in talking to staff who had good product knowledge and could help guide purchase decisions to suit the customers’ needs. ◦ Guide future product development: The direct selling model gave Dell first-hand knowledge of customers’ needs.

28
Improve core business Shift portfolio to higher-margin offerings Balance liquidity, profitability, and growth

29
Pride & Ferrell: Ch. 1, 2 & 3 Best, Roger J. (2009): Market-Based Management: Strategies for Growing Customer Value and Profitability, 5th ed., Pearson Prentice Hall, New Jersey (ISBN-13: 978-0-13-233653-6)
: Market-Based Management: Strategies for Growing Customer Value and Profitability, 5th ed., Pearson Prentice Hall, New Jersey (ISBN-13: ).")
Similar presentations


 –Chapter 12 (Offensive Strategies) –Systemsoft Case Wednesday (6-2) – Chapter 13.>")
 and/or brand(s). A small business typically creates.>")


