Download presentation
Presentation is loading. Please wait.

1
The Chinese Economy in the Past Three Decades: Achievements and Problems Andong Zhu Tsinghua University Beijing IDEAs Conference 2007.6

2
Outline Introduction The Chinese Economy in the First Three Decades after the Revolution The Achievements of the Chinese Economy in the Past Three decades The Problems of the Chinese Economy in the Past Three decades Conclusion

3
The Chinese Economy in the First Three Decades after the Revolution The Initial Condition The Achievement during This Period

4
A Family in the Old China

5
1948: Hyper-inflation in China

6
The Achievements Preliminarily Industrialized the Economy Established a Independent and Comprehensive Industrial system GDP Growth Rate Averaged at 6.68% per year during 1953-1978 Life Expectancy increased from around 35 to about 67 years.

9
Outline Introduction The Chinese Economy in the First Three Decades after the Revolution The Achievements of the Chinese Economy in the Past Three decades The Problems of the Chinese Economy in the Past Three decades Conclusion

10
The GDP Growth Rate of China and the World

11
The Rapid Increase of GDP

14
Outline Introduction The Chinese Economy in the First Three Decades after the Revolution The Achievements of the Chinese Economy in the Past Three decades The Problems of the Chinese Economy in the Past Three decades Conclusion

15
Is the Chinas Economic Growth Sustainable?

16
Pollution in the World:1999

17
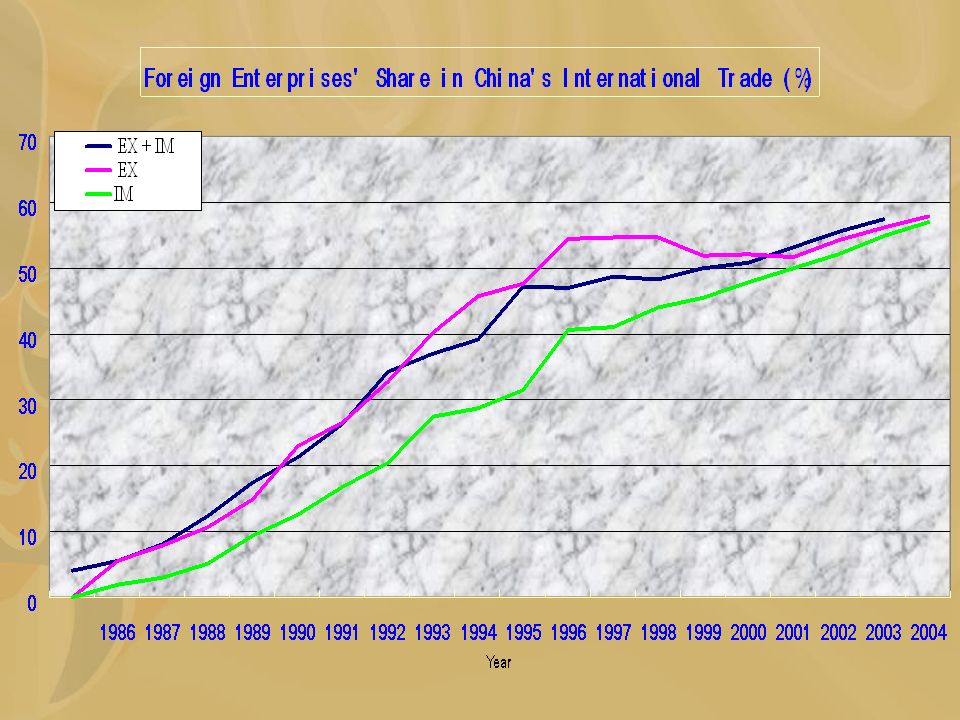
The Over-dependency on Foreign Trade

18
The Over-dependency on Investment

19
China s Changing Economic Structure, 1981-2003 (%) 1981- 1985 1986- 1990 1980- 1990 1996- 2000 2001- 2003 Share of GDP (expenditure approach): a Private Consumption52.251.046.547.245.1 Public Consumption14.012.512.812.212.8 Fixed Capital Formation28.129.233.735.039.5 Exports b 7.912.719.020.125.7 Net Exports-0.3-0.41.03.02.3 Contribution to GDP growth: a Private Consumption53.647.544.451.830.4 Public Consumption12.411.211.016.39.5 Fixed Capital Formation31.221.938.740.057.9 Exports b 12.722.823.626.548.7 Net Exports-8.39.21.24.01.4
 Share of GDP (expenditure approach): a Private Consumption Public Consumption Fixed Capital Formation Exports b Net Exports Contribution to GDP growth: a Private Consumption Public Consumption Fixed Capital Formation Exports b Net Exports")
20
The Changing Structure of the U.S economy, 1981-2004 (%) 1961- 1969 1970- 1979 1980- 1990 1991- 2000 2001- 2004 Share of GDP: Private Consumption61.762.464.567.370.2 Private Investment15.616.816.715.715.6 Government Spending22.221.020.618.618.5 Net Exports0.6-0.2-1.8-1.6-4.3 Contribution to GDP growth: Private Consumption59.762.569.472.277.7 Private Investment16.921.311.421.810.0 Government Spending24.017.721.013.524.1 Net Exports-0.6-1.5-1.7-7.5-11.8
 Share of GDP: Private Consumption Private Investment Government Spending Net Exports Contribution to GDP growth: Private Consumption Private Investment Government Spending Net Exports")
22
Decreasing Consumption Rate

23
Income Inequality in China:1979~2004

24
Sweden 25, India 32.5, United States 40.8, China 44.7, Brazil 59.1 Gini Coefficient for Chinas Income Distribution

25
The Increasing Inequality According to a recent study, In urban area, the top 10% familys income is 31 times of the bottom 10% familys income, rather than 9 times, as some statistics show. If we consider both the urban and rural area, the ratio is 55, rather than 21 times.

26
Inequality and Social Development In China

27
The Change of Life Expectancy in the World 1960198020011980-19602001-1980 Argentina65.269.674.14.44.5 Australia70.774.479.13.74.6 Brazil54.862.668.37.85.7 Canada71.174.779.13.64.4 China36.366.870.530.53.6 France70.274.279.23.95 India44.354.2639.88.8 Indonesia41.554.866.313.311.5 Japan67.776.181.18.45 Korea, Rep.54.266.873.612.76.8 Malaysia54.366.972.712.65.8 Mexico57.366.873.49.46.6 United States69.873.777.53.9 East Asia & Pacific38.864.369.225.54.9 High income68.973.878.14.84.3 Middle income44.965.669.720.74.1 Low income43.953.258.99.35.7 World50.262.666.612.34

28
International Comparison of the Expenditure Structure on Health Health expenditure, total (% of GDP) Public Share of Total Health Expenditure (%) Private Share of Total Health Expenditure (%) 19902000199020002000-1990199020002000-1990 Australia7.888.367.3972.415.0232.9927.6-5.39 Austria7.1873.5269.75-3.7726.7630.33.54 Brazil6.568.345.8840.84-5.0454.8859.24.32 Canada9.049.174.6771.98-2.6925.44282.56 China3.485.361.7836.6-25.1837.3663.426.04 France8.619.578.1676-2.1622.07241.93 India4.24.921.4317.76-3.6778.5782.23.63 Indonesia1.632.734.9723.7-11.2767.4876.38.82 Japan5.917.877.6676.672223.31.3 Nigeria2.692.236.820.91-15.8963.279.216 Turkey3.64560.9971.210.2138.4628.9-9.56 Sweden8.468.489.8377.26-12.5710.6422.712.06 United Kingdom6.017.384.3680.96-3.414.98194.02 United States11.881339.6544.314.6660.6155.7-4.91 Zambia3.35.678.1862.14-16.0421.2137.916.69 East Asia & Pacific 3.314.6748.9438.12-10.8350.5761.9511.37 High income8.6810.1959.9159.08-0.8340.2240.90.68 Middle income5.15.9249.851.011.2151.5748.9-2.67 Low income3.564.2937.0826.34-10.7469.9573.663.72 World8.129.3157.5157.790.2841.3842.220.84
 Public Share of Total Health Expenditure (%) Private Share of Total Health Expenditure (%) Australia Austria Brazil Canada China France India Indonesia Japan Nigeria Turkey Sweden United Kingdom United States Zambia East Asia & Pacific High income Middle income Low income World")
29
public spending in education / GDP, compare China and selected countries 1970198019991970-19801980-1999 Australia3.715.214.491.5-0.72 Austria4.475.356.290.880.94 Canada8.496.75.51-1.79-1.19 China1.252.512.791.260.28 France4.74.935.890.230.96 India2.452.834.060.381.23 Indonesia2.621.65..-0.97.. Japan3.895.723.541.83-2.18 Turkey2.082.2540.171.75 Sweden7.358.687.771.33-0.91 United States7.396.65.07-0.79-1.53 United Kingdom5.325.574.470.25-1.1 East Asia & Pacific3.152.512.13-0.64-0.38 High income4.585.455.270.87-0.18 Upper middle income3.964.234.470.270.24 Middle income3.573.794.520.220.73 Lower middle income3.223.314.610.091.3 Low income..3.12.83..-0.27 World3.713.814.380.10.57

30
International Comparison of Secondary School enrollment (%) 1970198019991970-19801980-1999 Australia82.171.2156.4-11.085.3 Brazil25.933.5103.27.669.8 China24.345.962.821.616.9 France73.484.6108.711.124.1 India24.229.948.75.718.8 Indonesia16.129.054.912.925.9 Japan86.693.2102.16.68.8 Korea, Rep.41.678.197.436.519.3 Malaysia34.247.770.313.522.6 United States83.791.294.67.53.4 East Asia & Pacific23.843.360.819.517.5 High income75.186.3105.311.219.1 Upper middle income34.649.588.314.938.8 Middle income27.451.169.923.718.7 Lower middle income25.851.565.025.713.6 Low income17.628.744.511.115.8 World34.148.966.714.717.8
 Australia Brazil China France India Indonesia Japan Korea, Rep Malaysia United States East Asia & Pacific High income Upper middle income Middle income Lower middle income Low income World")
31
International Comparison of the Expenditure Structure on Education Lower secondarySecondaire 1er cycle Lower secondarySecondaire 1er cycle ns qz ns qz Primary educationEnseignement primaire Primary educationEnseignement primaire Secondary educationEnseignement secondaire Secondary educationEnseignement secondaire ns qz ns qz ns qz ns qz ns qz ns qz ns qz ns qz ns qz ns qz Secondary educationEnseignement secondaire Secondary educationEnseignement secondaire ns qz ns qz ns qz ns qz ns qz ns qz ns qz ns qz ns qz ns qz ns qz ns qz ns qz ns qz ns qz ns qz ns qz ns qz ns qz ns qz ns qz ns qz Secondary educationEnseignement secondaire Secondary educationEnseignement secondaire ns qz ns qz ns qz ns qz ns qz ns qz ns qz ns qz ns qz ns qz ns qz ns qz ns qz ns qz ns qz ns qz Secondary educationEnseignement secondaire Secondary educationEnseignement secondaire ns qz ns qz ns qz ns qz ns qz ns qz ns qz ns qz ns qz ns qz ns qz ns qz ns qz ns qz ns qz ns qz Secondary educationEnseignement secondaire Secondary educationEnseignement secondaire ns qz ns qz ns qz ns qz ns qz ns qz ns qz ns qz ns qz ns qz ns qz ns qz ns qz ns qz ns qz ns qz ns qz ns qz ns qz ns qz Secondary educationEnseignement secondaire Secondary educationEnseignement secondaire ns qz ns qz ns qz ns qz ns qz ns qz ns qz ns qz ns qz ns qz ns qz ns qz ns qz ns qz Secondary educationEnseignement secondaire Secondary educationEnseignement secondaire ns qz ns qz ns qz ns qz ns qz ns qz ns qz ns qz ns qz ns qz ns qz ns qz ns qz ns qz Average duration of early childhood education in yearsDurée moyenne de la préscolarité en années Average duration of early childhood education in yearsDurée moyenne de la préscolarité en années UniversityUniversity UniversityUniversity M + WH + F M + WH + F MenHommes MenHommes WomenFemmes WomenFemmes Lower secondarySecondaire 1er cycle Lower secondarySecondaire 1er cycle ns qz ns qz Primary educationEnseignement primaire Primary educationEnseignement primaire Secondary educationEnseignement secondaire Secondary educationEnseignement secondaire ns qz ns qz ns qz ns qz ns qz ns qz ns qz ns qz ns qz ns qz Secondary educationEnseignement secondaire Secondary educationEnseignement secondaire ns qz ns qz ns qz ns qz ns qz ns qz ns qz ns qz ns qz ns qz ns qz ns qz ns qz ns qz ns qz ns qz ns qz ns qz ns qz ns qz Average duration of early childhood education in yearsDurée moyenne de la préscolarité en années Average duration of early childhood education in yearsDurée moyenne de la préscolarité en années Secondary educationEnseignement secondaire Secondary educationEnseignement secondaire ns qz ns qz ns qz ns qz ns qz ns qz ns qz ns qz ns qz ns qz Secondary educationEnseignement secondaire Secondary educationEnseignement secondaire ns qz ns qz ns qz ns qz ns qz ns qz ns qz ns qz ns qz ns qz ns qz ns qz ns qz ns qz ns qz ns qz ns qz ns qz ns qz ns qz ns qz ns qz Pre-primary (age 3+) Primary, secondary and post-secondary non-tertiary TertiaryAll levels of education Public sources Private sources 1 Public sources Private sources 1 Public sources Private sources 1 Public sources Private sources 1 Argentinamm88.611.467.432.677.222.8 Chile70.229.869.230.822.877.255.144.9 China54.645.455.844.256.843.255.844.2 India 2, 3 95.34.795.34.799.70.396.23.8 Indonesia 4, 5 5.394.776.623.443.856.264.535.5 Jamaica49.450.661.838.270.429.662.237.6 Malaysiammmm92.77.3mm Peru 2 80.319.776.823.254.545.571.628.4 Philippines 3 mm66.833.2mmmm Thailand 4 92.67.497.82.283.316.794.65.4 Uruguay87.412.693.66.4mmmm WEI mean ** 66.933.178.321.762.837.271.728.3 OECD mean 81.718.392.17.979.220.888.012.0
 Primary, secondary and post-secondary non-tertiary TertiaryAll levels of education Public sources Private sources 1 Public sources Private sources 1 Public sources Private sources 1 Public sources Private sources 1 Argentinamm Chile China India 2, Indonesia 4, Jamaica Malaysiammmm mm Peru Philippines 3 mm mmmm Thailand Uruguay mmmm WEI mean ** OECD mean")
32
The Excessive Savings in China: 1981-2004

33
The over deposit Gap between deposit and loan increased from 1995 (billion) 199519992003200420052006 101504005709201067
")
34
What are the Major Reasons of Inequality in China Monopoly? Corruption? Privatization? Foreign Capital?

35
The Laid-off/privatization Movement Urban employment State-owned Units Collective -owned Units Mining and Quarrying Manufacturi ng highest level 27331(2005) 11261(1995) 3628(1991) 932(1995)9803(1995) lowest level19040(1995) 6488(2005)810(2005) 558(2005)8043(2000) change8291-4773-2818-374-1760
 11261(1995) 3628(1991) 932(1995)9803(1995) lowest level19040(1995) 6488(2005)810(2005) 558(2005)8043(2000) change")
36
The Laid-off/privatization Movement

37
Informalizing Labor Market

40
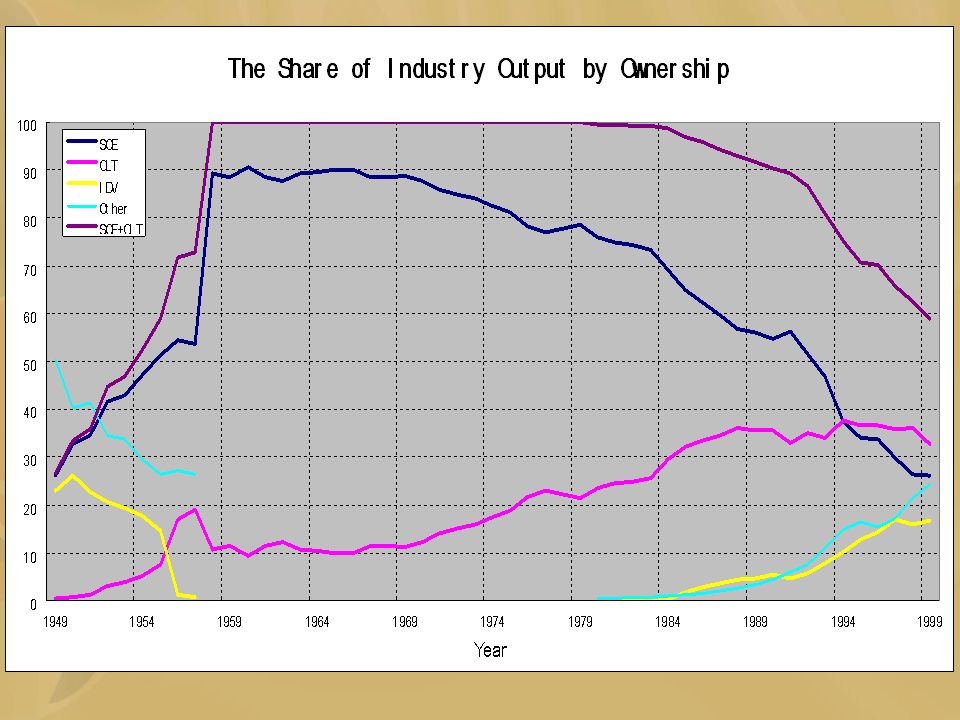
Share in Industry Output by Ownership (%)
")
41
Foreign Capitals Share in Different Industries in China:2005

42
Share of Different Ownership in Different Industries in China:2005

43
Take away Profits, Leave GDP and… Pollution

44
Pollution in the World:1999

45
Searching a Job Or a War

46
Conclusion The growth pattern of China has to be changed, or it will not sustain face the dangers of re-colonizing Foreign Capital Controls the Economy; Locked at the low-Ladder of the World Economy How? Strengthen the State and Empower the Working Class

47
End Thank You!

48
Chinas Basic Economic Statistics, 1981-2001 (percent) 6th Five Year Plan (1981-85) 7th Five Year Plan (1986- 90) 8th Five Year Plan (1991-95) 9th Five Year Plan (1996-00) 1981- 1995 1996- 2001 Real GDP growth (Official)10.787.9212.008.2610.238.10 Real GDP growth (Maddison) 1 8.875.738.686.31 2 7.76 Inflation rate 3 3.647.2612.450.607.780.50 Energy consumption growth4.995.205.86-0.435.350.16 Gross domestic savings (% of GDP)34.0435.9840.7641.2636.9341.11 Investment (% of GDP)34.0836.8639.6437.6436.8637.69 State Investment (% of Gross investment) 67.0964.9161.1852.5164.3951.64 State Investment (% of GDP) 22.8723.9224.2519.7623.7419.47 Consumption (% of GDP)66.2463.5259.3859.3463.0559.42 Government Expenditure (% of GDP)23.2918.1113.4314.3418.2815.24 Net Exports (% of GDP)-0.30-0.311.513.460.303.29 Foreign direct investment (% of GDP)0.330.904.314.391.854.29 FDI (% of gross investment)0.952.4910.6211.584.6911.33 Household final consumption growth 4 11.285.8810.017.789.066.81 General government consumption growth 4 11.666.9011.408.749.999.19 Gross consumption growth 4 11.346.0210.267.969.217.30 Gross Investment Growth 4 19.705.7023.159.9816.1810.48 State Investment Growth 4 15.365.5617.798.2512.907.99
 6th Five Year Plan ( ) 7th Five Year Plan ( ) 8th Five Year Plan ( ) 9th Five Year Plan ( ) Real GDP growth (Official) Real GDP growth (Maddison) Inflation rate Energy consumption growth Gross domestic savings (% of GDP) Investment (% of GDP) State Investment (% of Gross investment) State Investment (% of GDP) Consumption (% of GDP) Government Expenditure (% of GDP) Net Exports (% of GDP) Foreign direct investment (% of GDP) FDI (% of gross investment) Household final consumption growth General government consumption growth Gross consumption growth Gross Investment Growth State Investment Growth")
49
Chinas Basic Economic Statistics, 1981-2001 (percent) 6th Five Year Plan (1981- 85) 7th Five Year Plan (1986- 90) 8th Five Year Plan (1991- 95) 9th Five Year Plan (1996-00) 1981-1996- 19952001 Government budget Balance(% of GDP) -0.22-0.79-1.03-1.53-0.68-1.71 New government debt(% of GDP)1.51.892.393.931.934.08 SOE output share in industry output71.357.8945.1929.0358.13 SOE employment growth2.342.851.72-6.152.3-6.08 City collective enterprise employment growth 6.641.33-2.33-13.141.88-13.26 Staff and workers employed by manufacturing sector, growth 5 3.22.810.51-9.422.17-9.03 total Staff and workers, growth 5 3.432.621.19-5.292.41-5.1 Total employment growth3.325.5111.153.281.18 Share of employment in formal sector97.8993.1281.0260.6790.6858.07 Change of formal sector employment share in total employment -0.55-2.8-0.84-5.93-1.4-5.54 Gini coefficient26.1534.8138.540.3
 6th Five Year Plan ( ) 7th Five Year Plan ( ) 8th Five Year Plan ( ) 9th Five Year Plan ( ) Government budget Balance(% of GDP) New government debt(% of GDP) SOE output share in industry output SOE employment growth City collective enterprise employment growth Staff and workers employed by manufacturing sector, growth total Staff and workers, growth Total employment growth Share of employment in formal sector Change of formal sector employment share in total employment Gini coefficient")
50
1988:

51
1988 9 ( )
")
Similar presentations