Download presentation
Presentation is loading. Please wait.

1
Presenting the Thirteen’th wave Latinobarometro 2009 Washington D.C., February 26th, 2009 Marta Lagos

2
LATINOBARÓMETRO HISTORY 1994: First funding from the European Union for a four country study in the southern cone of Latin American. - Argentina- Chile –- Brazil - Uruguay 1995: First wave is applied in eight countries with the support of the European Union and local funding. –- Argentina- Paraguay- Chile- México –- Brazil - Peru- Uruguay- Venezuela From 1996: the study expands to 17 countries with funds of IADB, local governments, U.S. Government and the UNDP. – - Argentina- Brazil- Bolivia- Chile – - Colombia- Costa Rica- Ecuador- El Salvador – - Guatemala- Honduras- México- Nicaragua – - Panama- Paraguay- Peru- Uruguay – - Venezuela Other donor institutions join Latinobarómetro, today multiple financing: IADB, SIDA, local governments, private institutions, U.S. Government, World Bank, ILO, Think Tanks and the European Union. 2004: The study expands also to Republica Dominicana, 18 countries are measured. 2006: Opening of the first ONLINE Data Bank in spanish in the continent.

3
LATINOBARÓMETRO www.latinobarometro.org www.latinobarometro.org Represents the adult population of each country, 500 million all over the region. Sample error fluctuate by country between 2,8% and 4,1% Sample size of 1000 y 1200 cases. Sample error 3% 210.000 face to face interviews and 1000 variables applied in 12 years. Comparative information sources: GLOBAL BAROMETERS WORLD VALUES SURVEY CSES EUROPEAN SOCIAL SURVEY EUROBAROMETER GENERAL SOCIAL SURVEY OWN SOURCES

4
The relationship between Democracy and Development: The impact of growth

5
RECOVERING THE PAST

6
GROWTH PER COUNTRY Country20002001200220032004200520062007 Argentina- 0.8- 4.4- 10.98.89.09.28.58.7 Bolivia2.51.72.52.74.24.44.84.6 Brazil4.31.32.71.15.72.93.75.4 Chile4.53.42.23.96.05.64.35.1 Colombia2.92.22.54.64.75.77.08.2 Costa Rica1.81.12.96.44.35.98.87.3 Ecuador2.85.34.23.68.06.03.92.7 El Salvador2.21.72.3 1.93.14.24.7 Guatemala3.62.33.92.53.23.35.35.7 Honduras5.72.73.84.56.26.16.3 Mexico6.60.00.81.44.03.24.83.2 Nicaragua4.13.00.82.55.34.33.93.8 Panama2.70.62.24.27.57.28.71.2 Paraguay- 3.32.10.03.84.12.94.36.8 Peru3.00.25.04.05.16.77.68.9 Dominican Rep.5.71.85.8- 0.31.39.310.78.5 Uruguay- 1.4- 3.4- 11.02.211.86.67.07.4 Venezuela3.73.4- 8.9- 7.818.310.3 8.4 Total4.00.3- 0.42.16.14.85.65.7

7
IMAGE OF PROGRESS LATIN AMERICA 1995-2008 Q. Would you say that this country is progressing, at a standstill, or in decline?. Source: Latinobarómetro 1995-2008.

8
Source: Latinobarómetro 2001-2008 COUNTRY’S FUTURE ECONOMIC SITUATION LATIN AMERICA 2001-2008 / TOTALS BY COUNTRY 2008 Q. Over the next 12 months do you think that, in general, the country’s economic situation will be much better, a little better, about the same, a little worse or much worse than now? *Answer shown ‘much better’ plus ‘a little better’.

9
FUTURE PERSONAL ECONOMIC SITUATION LATIIN AMERICA 2001- 2008 / TOTALS BY COUNTRY 2008 Source: Latinobarómetro 2001-2008 Q. Over the next 12 months do you think that your economic situation and that of your family will be much better, a little better, about the same, a little worse or much worse than now? *Answer shown ‘much better’ plus ‘a little better’.

10
Q. How concerned would you say you are that you will be left without work or unemployed during the next 12 months? Very concerned, concerned, a little concerned, or not at all concerned, do not work ? *Answer shown ‘Very concerned’ plus ‘concerned’. REDUNDANCY INDEX LATIN AMERICA 2002-2008 / 2008 TOTAL BY COUNTRY Source: Latinobarómetro 2002-2008

11
TRUST IN BANKS LATIN AMERICA 2003 - 2008 / TOTAL COUNTRY 2008 Q. Please, look at this card and tell me how much trust you have in each of the following groups, institutions or persons mentioned on the list? a lot, some, a little, or no trust… in? *Answer shown ‘Banks ’.** Answer shown ‘a lot’ plus ‘ some’. Source: Latinobarómetro 2003-2008

12
HAVE YOU EVER USED INTERNET IN YOUR LIFE? LATIN AMERICA 2002 - 2008 / LATIN AMERICA 2008. Source: Latinobarómetro 2002 – 2008. Q1. Have you ever used e-mail? Have you ever used e-mail to communicate? Yes, every day Yes, occasionally Yes, Almost never, No, never. * Answer shown ‘Yes’ Q2. No matter where you have access to the internet, What do you frequently use internet for? Use e-mail/ Search information/ Entertainment/ Work/Study/ doing paperwork/Shopping/ Other. ** Answer multiple total number over 100%. Ever in life Why use it?

13
INTEREST IN INTERNATIONAL AFFAIRS LATIN AMERICA 2004 - 2008 / TOTAL COUNTRY 2008. Q. How much interest do you have in international affairs? A lot of interest/ Some interest/ Little interest/ No interest.* Answer shown ‘ A lot of interest ´ plus ´Some interest´. Source: Latinobarómetro 2004-2008

14
Source: Latinobarómetro 1997 - 2008. THERE CAN BE NO DEMOCRACY WITHOUT A NATIONAL CONGRESS LATIN AMERICA 1997 – 2008 /TOTALS BY COUNTRY 2008. Q. ¿There are people who say that without a national congress there can be no democracy, while others say that democracy can work without a National Congress. What is closer to your way of thinking? *Answer shown ‘ Without a national congress there can be no democracy’.

15
Source: Latinobarómetro 1997 - 2008. THERE CAN BE NO DEMOCRACY WITHOUT POLITICAL PARTIES LATIN AMERICA 1997 – 2008 / TOTALS BY COUNTRY 2008. Q. There are people who say that without political parties there can be no democracy, while others say that democracy can work without parties. What is closer to your views? *Answer shown ‘Without political parties there can be no democracy’

16
TRUST THE GOVERNMENT TO DO WHAT IS RIGHT LATIN AMERICA 2001 – 2008 / TOTALS BY COUNTRY 2008. Source: Latinobarómetro 2001 – 2008. Q. I am going read a statement. Please, tell me if you strongly agree, somewhat agree, somewhat disagree or strongly disagree. “You can generally trust the people who run our government to do what is right”.*Answer shown only ‘Strongly agree’ plus ‘Agree’.

17
Q. ¿Do you approve or disapprove the way the President (NAME OF PRESIDENT) is running the country? Answer shown ‘Approve’. Source: Latinobarómetro 2002-2008. GOVERNMENT APPROVAL LATIN AMERICA 2002 – 2008 / TOTALS BY COUNTRY 2008.

18
Source: Latinobarómetro 2004-2008 PROGESS IN REDUCING CORRUPTION LATIN AMERICA 2004-2008/ TOTALS BY COUNTRY 2008. Q. How much progress do you think has been made in reducing corruption in State institutions during the last two years? Much,something,Little,Nothing *Answer shown ‘ Much´, plus ´ something ´.

19
FISCAL MORALITY LATIN AMERICA 1998 - 2008 / TOTALS BY COUNTRY 2008. Source: Latinobarómetro 1998 – 2008. Q. On a scale of 1 to 10, where 1 means "not at all justifiable" and 10 means "totally justifiable", how justifiable do you believe it is to evade paying taxes?. * averages shown.

20
The relationship between Democracy and Development: The role of liberty

21
FREEDOM AND SUPPORT FOR DEMOCRACY www.globalbarometer.org SUPPORT FOR DEMOCRACY FREEDOM AS THE MEANING OF DEMOCRACY

22
FREEDOM AND SATISFACTION WITH DEMOCRACY www.globalbarometer.org SATISFACTION WITH DEMOCRACY FREEDOM AS THE MEANING OF DEMOCRACY

23
ECONOMIC SENTIMENT AND SUPPORT FOR DEMOCRACY www.globalbarometer.org SUPPORT FOR DEMOCRACY ECONOMIC SENTIMENT

24
SATISFACTION WITH DEMOCRACY ECONOMIC SENTIMENT ECONOMIC SENTIMENT AND SATISFACTION WITH DEMOCRACY www.globalbarometer.org

25
Latin American Exceptionalism

26
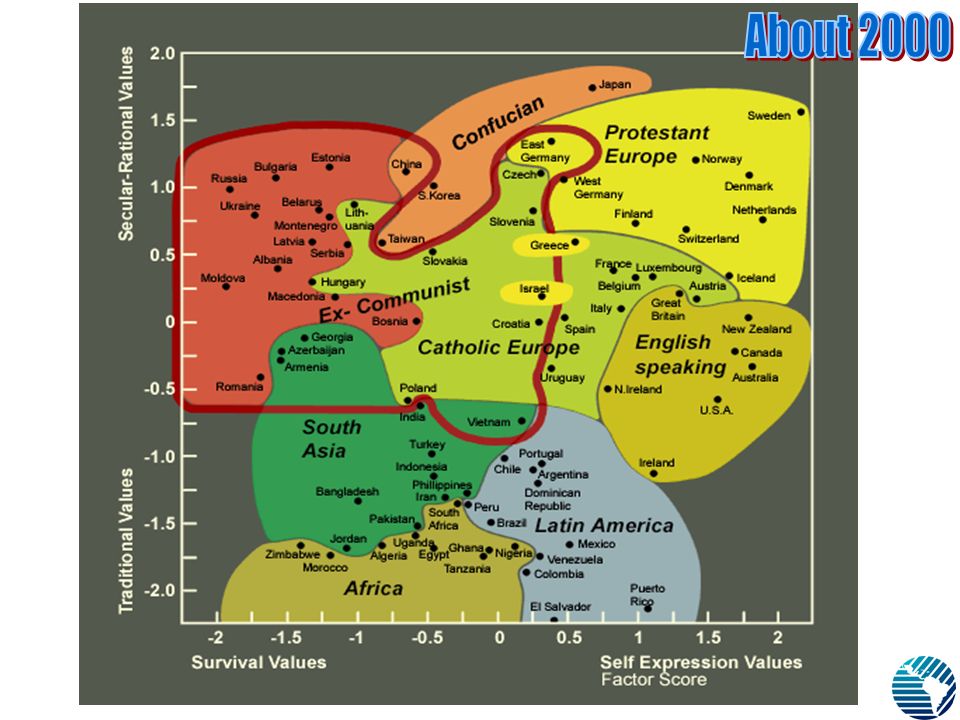
HUMAN DEVELOPMENT ¿Where does Latin America Stand in the World? Latin America differs from the rest of the world inasmuch as its culture is not transforming itself following the same path that other cultural regions have done in the past. While the rest of the world has moved from a traditional to a rational culture shift at the compass of growth, Latin America reinforces its traditions at the same time it moves towards higher levels of selfexpression.

28
The Human Development Value Space in Theory The constraint vs. choice polarity reflects a Human Development continuum in which a move towards the choice-end means more Human Development as it gives people more room to realize their inner human potentials.

29
Net Value Changes within Cultural Zones (1981-2006) On average, the five cultural zones (for which data are available from 1981 to 2006) have been moving toward stronger self-expression values. Four of these five zones also moved toward stronger secular-rational values. But this move is less pronounced.

30
TRUST Q. Generally speaking, would you say that you can trust most people, or that you can never be too careful when dealing with others?. Here only “You can trust most people” Source: Latinobarómetro 1996-2003 / Afrobarometer 1999-2001 GLOBAL BAROMETER Here those who no do not trust by continent

31
CONFLICTS IN SOCIETY AMÉRICA LATINA 2007 - 2008. Here only Very “strong and strong” Source: Latinobarómetro 2007 - 2008.

32
DEMOCRACY GARANTIES …. AMÉRICA LATINA 2008 ¿ To what extent are the following guaranteed? * Here only “completely and somewhat guaranteed’ Source: Latinobarómetro 2008.

33
Final Point: The Relevance of Self-Expression Values

34
DEMOCRACY FREEDOM AND ECONOMIC EXPECTATIONS

35
Net Optimism* and Convinced** Democrats in Latin America Optimist minus Pesismtists based on 6 questions on economic expectation, present past and future ** Those who support democracy and think it the best system.

36
FREEDOM DEMOCRACY ECONOMY DEMOCRACY AND DEVELOPMENT

37
SUPPORT AND SATISFATION WITH DEMOCRACY AND PIB PER CAPITA AMÉRICA LATINA 1995-2008. Source: Latinobarómetro 1995-2008. Proyectado 2006

38
THANK YOU

39
ANNEX

40
SUPPORT FOR DEMOCRACYSATISFACTION UNSATISFIED DEMOCRATS (DIFERENCE)FREEDOM Japan634815 Phillipines51371437 Sri Lanka54441011 Indonesia6459533 Korea4348-549 Thailand7378-517 Taiwan4856-822 Pakistan2432-811 India4957-86 Bangladesh4453-98 Vietnam7285-1325 Singapore5982-23 Mongolia3963-2443 UNSATISFIED DEMOCRATS ASIA www.globalbarometer.org
FREEDOM Japan Phillipines Sri Lanka Indonesia Korea Thailand Taiwan Pakistan India Bangladesh Vietnam Singapore Mongolia UNSATISFIED DEMOCRATS ASIA")
41
SUPPORT FOR DEMOCRACYSATISFACTION UNSATISFIED DEMOCRATS (DIFERENCE) FREEDOM Zimbabwe66145219 Nigeria66254123 Zambia64253933 Malawi56263052 Cape Verde71462541 Kenya74512331 Senegal75532236 Benin70482235 Madagascar42251734 Uganda62501223 Lesotho51391221 Mali68571124 Nepal423111 Botswana69591028 Ghana7570542 South Africa6663333 Tanzania37 019 Mozambique5659-335 Namibia5769-1231 UNSATISFIED DEMOCRATS AFRICA www.globalbarometer.org
 FREEDOM Zimbabwe Nigeria Zambia Malawi Cape Verde Kenya Senegal Benin Madagascar Uganda Lesotho Mali Nepal Botswana Ghana South Africa Tanzania Mozambique Namibia UNSATISFIED DEMOCRATS AFRICA")
42
SUPPORT FOR DEMOCRACYSATISFACTION UNSATISFIED DEMOCRATS (DIFERENCE)FREEDOM Peru52114131 Uruguay79433646 Mexico53173621 Argentina6834 45 Venezuela70373360 Paraguay4093132 Costa Rica77473045 Bolivia522329 Panamá51242747 Ecuador46222429 Colombia50262418 Nicaragua50302036 Guatemala38211730 Honduras51341730 Chile52361633 El Salvador45321324 Brazil3528723 UNSATISFIED DEMOCRAT LATIN AMERICA www.globalbarometer.org
FREEDOM Peru Uruguay Mexico Argentina Venezuela Paraguay Costa Rica Bolivia Panamá Ecuador Colombia Nicaragua Guatemala Honduras Chile El Salvador Brazil UNSATISFIED DEMOCRAT LATIN AMERICA")
43
SUPPORT FOR DEMOCRACY AFRICA- ASIA- LATIN AMERICA www.globalbarometer.org

44
SATISFACTION WITH DEMOCRACY AFRICA- ASIA- LATIN AMERICA www.globalbarometer.org

45
FREEDOM AS THE MEANING DEMOCRACY AFRICA- ASIA- LATIN AMERICA www.globalbarometer.org

46
Convinced Democrats Democracy is preferableDemocracy as the best system of government Convinced Democrats Uruguay798875 Venezuela828672 República Dominicana737962 Bolivia687758 Costa Rica677758 Colombia628257 Argentina607756 Promedio577349 Paraguay537048 Chile517046 Nicaragua586746 Panamá567145 Brasil478243 Ecuador566040 El Salvador506338 México436936 Perú456336 Honduras446634 Guatemala345825

47
Net Optimism and Convinced Democrats in Latin America OptimistsMixtPesimistsNet Optimism* Convinced Democrats ** Brasil761957143 Paraguay583565248 Colombia5830124657 Uruguay5431144075 Ecuador4936153440 Venezuela5422233172 Panamá423621 45 Promedio4034261449 Argentina37 251256 Bolivia353628758 Nicaragua353233246 Chile294328146 México303634-336 Costa Rica273736-858 Honduras273736-1034 Guatemala224533-1125 El Salvador302941-1138 Rep. Dominicana213445-2462 Perú213346-2536 Optimist minus Pesismtists ** Those who support democracy and think it the best system.

Similar presentations

? Andrei Illarionov, Cato Institute, Washington, USA, Institute of Economic Analysis, Moscow,>")


