Download presentation
Presentation is loading. Please wait.

1
Patient Admission from ED to Acute Care Tech 581: Improve/Control Presentation December 9, 2008 xxxxx Sound Removed

2
Brief review of project: Patient Admission from the ED to Acute Care The aim of this process is to reduce the lead time for safe and timely patient admission from the ED to Acute Care services. By improving the efficiency of this process, the organization will improve their accessibility, capacity, patient safety, quality of care, and patient and staff satisfaction. The primary target of this process improvement effort is to decrease patient length of stay in the ED from the time an admission order is written. As health care moves into the era of reporting quality indicators; improving quality of care and patient safety rankings will positively affect the organization’s reimbursement rates. The consequences of not improving the efficiency of this process are reduced quality and patient safety (and possibly reimbursement rates), increased costs associated with increased elopement rates, and lost revenue as a result of increased time on diversion. Therefore, it is important to improve this process now in order to maintain reimbursement, control costs, and prevent losing revenue.
, increased costs associated with increased elopement rates, and lost revenue as a result of increased time on diversion. Therefore, it is important to improve this process now in order to maintain reimbursement, control costs, and prevent losing revenue..")
3
SIPOC SuppliersInputs ProcessOutputsCustomers ED physiciansAdmission order PROCESS: ED admission order to in-patient admission Patients admitted to in- patient bed ED physicians ED nurses & Director Bed placement assignment ED nurses & Director PCU/ICU/Med/ Surg unit nurses & Directors Equipment (IV pump) PCU/ICU/Med/ Surg unit nurses & Directors Lab/Imaging Techs & Directors Lab/Imaging results Lab/Imaging Techs & Directors Bed Placement staff & Manager Supplies (oxygen, bed pans, etc) Bed Placement staff & Manager Admitting physicians Vendors (IV pumps) EMS Environmental Services staff Patient EMS Patient families Transport team
 PCU/ICU/Med/ Surg unit nurses & Directors Lab/Imaging Techs & Directors Lab/Imaging results Lab/Imaging Techs & Directors Bed Placement staff & Manager Supplies (oxygen, bed pans, etc) Bed Placement staff & Manager Admitting physicians Vendors (IV pumps) EMS Environmental Services staff Patient EMS Patient families Transport team")
4
VoC – SWOT Analysis Strengths Advanced, automated bed tracking and patient transfer system in place High level of physician and nurse expertise Department Directors with a wide range of experience and knowledge Support from the Executive Leadership Team Available resources to accommodate changes Addition of Transport Team has been very helpful Weaknesses Animosity between departments Communication barriers (i.e. personality conflicts) between departments Perceived inadequate staffing levels (i.e. nurse/patient ratio) Departments operate in silos Lack of awareness of other department processes Lack of standardized directions for admission orders and bed requests Lack of standardized directions for when order/request should be made (i.e. before or after lab/imaging tests and results)
 between departments Perceived inadequate staffing levels (i.e. nurse/patient ratio) Departments operate in silos Lack of awareness of other department processes Lack of standardized directions for admission orders and bed requests Lack of standardized directions for when order/request should be made (i.e. before or after lab/imaging tests and results).")
5
VoC – SWOT Analysis Opportunities Improve communication between departments Create a team-oriented culture Educational sessions highlighting department-specific processes Standardize admission order/bed requests across respective departments Use the automated system to capacity Threats Increased animosity between departments Pushing staff too hard in a high-stress environment Staff retaliation and push-back towards management Disrupting the flow too much could jeopardize patient safety Decreased quality of care without improvement Increased diversion time and reduction in revenue capture Increased elopement rates and associated costs Poor quality and safety ratings could lead to reduced reimbursement rates

6
Dept. Directors Bed Placement Manager ED Physician Unit Nurse Patient Pt. families Patient admission time Time between admission order written and time bed request is made Time between bed request and patient admission to unit ED staffing levels Ordering protocol Communication process b/w ED staff and Bed Placement staff Unit staffing levels Bed turnover time Lab/imaging result time Patient transport and admission protocol Communication b/w Bed Placement staff and admitting unit

7
ED physician completes admission order ED staff faxes copy to Admissions & sends elect copy to Bed Placement BP triage order & check bed availability Bed ready?BP makes request to unit Pt waits til ready Pt arrives; unit notifies Admissions to admit patient Order sent on time Lab ready Incomplete request Complete comm. b/w ED & unit Current State Process Map; from measure phase

8
Process Observation Worksheet (e.g.)
")
9
Checksheet

10
ED patient room Computer kiosk Spaghetti Diagram

11
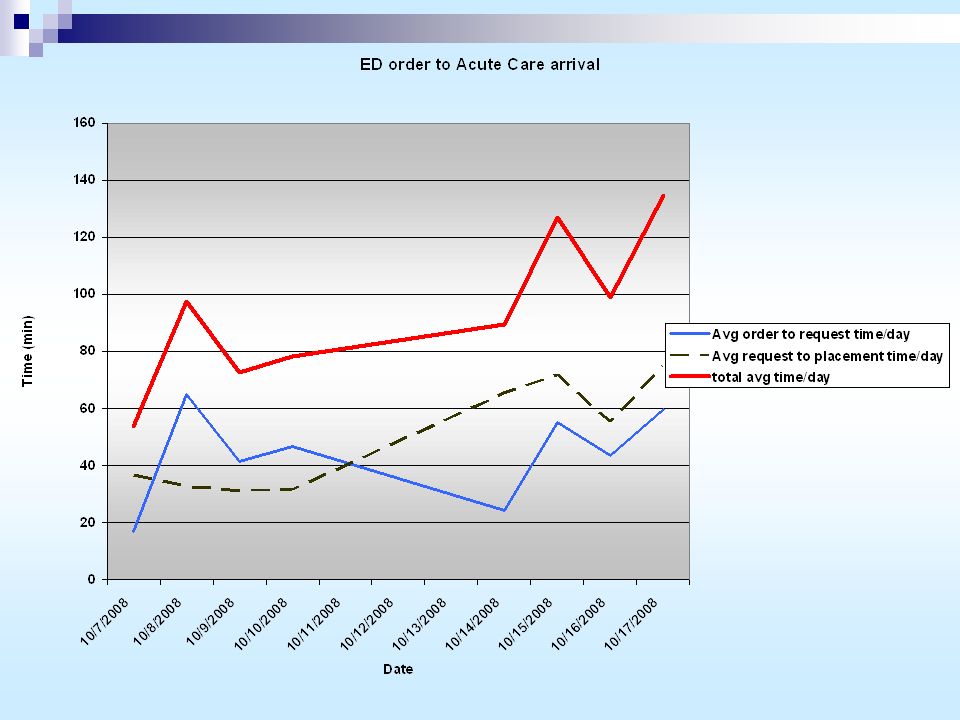
Data Collection Plan; measure Time (min) from the time an admission order is made in ED to the time a bed request is made Time (min) from the time request is made to patient arrival in Acute Care Reasons for delays will ultimately identify new KPIVs Data collected for 8 week days over an 11 day period (10/7 – 10/17) Collected data on 5 patients/day over 8 days = 40 patient sample size Will graphically present: Average order to request time/day Average request to placement time/day Total average time/day
 from the time an admission order is made in ED to the time a bed request is made Time (min) from the time request is made to patient arrival in Acute Care Reasons for delays will ultimately identify new KPIVs Data collected for 8 week days over an 11 day period (10/7 – 10/17) Collected data on 5 patients/day over 8 days = 40 patient sample size Will graphically present: Average order to request time/day Average request to placement time/day Total average time/day")
13
Data Collection Plan Cont… (analyze) Graphically present the distribution of total time, for sample data, from Admission Order to patient arrival in Acute Care unit Further breakdown of data; identify which step(s) are contributing the most to overall time Column chart: % contribution to overall time of each step Pie Charts: distribution of reasons for delays Anecdotal information/data used to eliminate KPIVs
 Graphically present the distribution of total time, for sample data, from Admission Order to patient arrival in Acute Care unit Further breakdown of data; identify which step(s) are contributing the most to overall time Column chart: % contribution to overall time of each step Pie Charts: distribution of reasons for delays Anecdotal information/data used to eliminate KPIVs")
14
Distribution of total times from Order Written to Pat. Arrival in Acute Care

15
% Contribution to overall time of each step 10/1710/1610/1510/1410/1010/910/810/7

16
% of sample that was admitted in goal time (<= 50 mins)
")
17
% distribution of reasons why patients were not admitted in goal time

18
Improve Phase Information to eliminate KPIVs; (refresh from Analyze) Transportation is not an issue: the hospital has successfully implemented a transportation team Lab Delays: Recently implemented I-Stat; software that will produce lab results in 5 minutes Ordering and admission protocol/communication: subject to patient census and unit staffing levels PCU 3:1 patient to nurse ratio – regulated ICU 2:1 patient to nurse ratio – regulated ED 8:1 patient to nurse ratio – not regulated ER census increased by 8% this year Budgeted for 118 pts/day; currently 134 pats/day
 Transportation is not an issue: the hospital has successfully implemented a transportation team Lab Delays: Recently implemented I-Stat; software that will produce lab results in 5 minutes Ordering and admission protocol/communication: subject to patient census and unit staffing levels PCU 3:1 patient to nurse ratio – regulated ICU 2:1 patient to nurse ratio – regulated ED 8:1 patient to nurse ratio – not regulated ER census increased by 8% this year Budgeted for 118 pts/day; currently 134 pats/day")
19
Conclusions Following thorough examination of KPIVs; Bed turnaround, staffing levels, patient volume are the main reasons for delays in the KPOV (Patient Admission Time) Lab results delay is being rectified Communication/ordering/placement protocol significantly affected by staffing levels and patient volume Bed turnaround time is all that is measurable; delays in turnaround time stem from poor communication b/w unit nurses and Env. Svcs staff

20
List of Solutions; Eliminate Impact of Bed Turnaround Time (used multi-voting) 1. Implement electronic signaling system for env svcs to notify unit nurses/transport team when bed is clear 2. Staff training/education; Team building and prompt communication; everyone knows how his/her duties contribute to overall success of decreased patient admission time 3. Hire more env svcs staff 4. Add more Acute Care beds

21
Solution Matrix KPOV: Patient Admission Time Solutions KPIV: RP N Electronic signaling #1 Staff educ/train #2 Hire env svcs staff #3 Add acute care beds #4 Bed Turnaround Time 8965 Total Impact 8965 Success Criteria: Patient Safety Likelihood of Success 7854 Cost ($$) 610 (lowest)54 (highest) Staff Satisfaction 7955 Quality of Care 61065 Patient Satisfaction 71055 Success Criteria Total 33472623 Total Score 41 56 32 28
 610 (lowest)54 (highest) Staff Satisfaction 7955 Quality of Care Patient Satisfaction Success Criteria Total Total Score")
22
5 3 1 1 35 Effort IMPACTIMPACT #1 Electronic signaling #2 Staff educ/training #3 Hire env svcs staff #4 Add more beds Impact/Effort Matrix

23
ED physician completes admission order ED staff faxes copy to Admissions & sends elect copy to Bed Placement BP triage order & check bed availability Bed ready?BP makes request to unit Pt waits til ready Pt arrives; unit notifies Admissions to admit patient Order sent on time Lab ready Incomplete request Complete comm. b/w ED & unit Current State Process Map; from measure phase

24
Future State Process Map ED physician completes admission order ED staff faxes copy to Admissions & sends elect copy to Bed Placement BP triage order & check which bed is available BP makes request to unit Pt arrives; unit notifies Admissions to admit patient Requirements: Education/training improve promptness/communication/turnaround time/complete order I-Stat implementation to alleviate lab delays

25
Pre-Pilot Planning Checklist Timelines and Plans: Item Owner/Completion Date Y N Deadlines and responsibilities for prep work have been determined. 12/1 Y N Deadlines for stopping and starting the pilot exist. 12/3-12/15 Y N Budgets and required resources are outlined for approval. champion Y N Daily review meetings for review of pilot data have been scheduled. Directors Y N In-services with front line staff have been scheduled. Directors New procedures: Y N New procedures are documented with flow charts and written instructions Directors Y N Other necessary materials (list in comments sections) are prepared. Y N Pilot Control Plans developed and outlined for approval. Directors
 are prepared. Y N Pilot Control Plans developed and outlined for approval. Directors.")
26
Stakeholder preparation:Item Owner/Completion Date Y N Everyone involved in the new process understands his/her role and responsibilities Directors/staff Y NIn servicing conducted.Directors/staff Y N Anyone outside of the main stakeholder group, but impacted by the process changes has been informed of the test stop and start date/time and the process changes. Lab/imaging Pilot Data Collection: Y N Procedures are in place to monitor both methods and results. Team members/directors; use measure checksheets Y N Data collection plan allows for evaluation of changes to key indicators Y N Plans allow for containment if process metrics and/or procedures respond negatively to changes.

27
By the end of the Pre-Pilot Improve phase: Item Owner/Completion Date Y N A list of innovative potential solutions has been generated 12/1 Y N Improve tools (solution matrix, impact/effort matrix) were used to narrow the solution list and to further develop and quantify solutions. 12/1 Y N Success Criteria were established12/1 Y N A final solution was chosen based on impact to success criteria.12/1 Y N Solution is presented and approved by the Champion team.12/1 Y N Pilot and pilot control plan is developed.12/2 Y N Pilot is approved by the Champion team.12/2 Y N Tollgate preparation

28
Pilot Implementation Plan Inform key stakeholders (Unit Directors, Env. Svcs, BP Manager, Lab/imaging) of the schedule and plan Staff Team Building Education/Training: Focus is how each staff members role directly contributes to the overall success of decreasing patient admission time (gives sense of involvement/importance) Pilot Implementation: track patient admission time (more specifically, delays to bed not ready/poor communication) using process observation worksheet from measure phase. Set daily meetings to review progress toward decreased admission time as a result of staff education/training
 of the schedule and plan Staff Team Building Education/Training: Focus is how each staff members role directly contributes to the overall success of decreasing patient admission time (gives sense of involvement/importance) Pilot Implementation: track patient admission time (more specifically, delays to bed not ready/poor communication) using process observation worksheet from measure phase. Set daily meetings to review progress toward decreased admission time as a result of staff education/training.")
29
Control Phase Standardized Processes and Immediate/Long-Term Control Patient Training/education geared toward effective team building and stressing the importance of prompt/correct communication will help standardize staff actions and accountability Training/education will result in elimination of delays and allow for a standardized flow process as illustrated in the Future State Process Map Immediate control: daily tracking of Patient Admission Time (KPOV); daily tracking of bed turnaround time (KPIV) using observation worksheet Long-term control: Training/education becomes engrained in the culture and allows for the implementation of electronic signaling, adding more beds
; daily tracking of bed turnaround time (KPIV) using observation worksheet Long-term control: Training/education becomes engrained in the culture and allows for the implementation of electronic signaling, adding more beds")
30
Control Plan Project Title: Patient Admission from ED to Acute Care MetricKPOV/KPIVTargetCollected byFrequencyMethodGraphingReview Order to bed requestKPOV10min Director/unit nurse75%, Dailymanualrun chartdaily, 5pm Request to AdmitKPOV35min Director/unit nurse75%, Dailymanualrun chartdaily, 5pm Total timeKPOV<50min Director/unit nurse75%, Dailymanualrun chartdaily, 5pm Bed Turnaround TimeKPIV<39min Env. Svcs/BP Manager75%, Dailymanualrun chartdaily, 5pm Action Plan Director will track the reasons for delays in bed turnaround time For each patient falling outside the desired metric; will then focus training and education on ways to correct those delays

31
Cost Benefit Analysis By improving the efficiency of this process, the organization will improve their accessibility, capacity, patient safety, quality of care, and patient and staff satisfaction. A considerable amount of leadership and staff time will be needed to educate and train the staff, and measure and track the results. Therefore, a significant investment in staff salary will be necessary to improve the process. The downstream benefits of improving the process will significantly exceed the initial investment in staff salary. The benefits include: Increased revenue gain as a result of decreased diversion time (lose $1800/hr when go on diversion) Decreased costs associated with decreased elopement rates Increased capacity to see more patients in the ED Improved physician and staff satisfaction leads to recognition as an employer of choice Improved patient satisfaction leads to more patient referrals Improved quality and safety rankings
 Decreased costs associated with decreased elopement rates Increased capacity to see more patients in the ED Improved physician and staff satisfaction leads to recognition as an employer of choice Improved patient satisfaction leads to more patient referrals Improved quality and safety rankings.")
32
Team Recognition!! Write-up on the intranet displaying some of the work (graphs/diagrams/analysis) to show appreciation to team members Invite all team members to attend recognition lunches Include a spot in the organizations “Best of Class” exhibit to honor and recognize the team’s work and commitment to improving the quality of care
 to show appreciation to team members Invite all team members to attend recognition lunches Include a spot in the organizations Best of Class exhibit to honor and recognize the team’s work and commitment to improving the quality of care.")
33
Diffusing the Improvements Promote success through exhibit in “Best of Class” Distribute a newsletter illustrating the importance of improving quality of care in this time of reporting quality indicators (increased reimbursement and recognition as employer of choice) This project can be spread throughout the network if it is part of a system (which this particular hospital happens to be) Also, a similar project could be conducted on the back end which focuses on improving the efficiency of discharging patients from the hospital (or hospitals in the network)
 This project can be spread throughout the network if it is part of a system (which this particular hospital happens to be) Also, a similar project could be conducted on the back end which focuses on improving the efficiency of discharging patients from the hospital (or hospitals in the network)")
Similar presentations