Download presentation
Presentation is loading. Please wait.

1
Patient Admission from ED to Acute Care Tech 581: Analyze Presentation November 11, 2008 xxxxxx Sound Removed

2
Brief review of project: Patient Admission from the ED to Acute Care The aim of this process is to reduce the lead time for safe and timely patient admission from the ED to Acute Care services. By improving the efficiency of this process, the organization will improve their accessibility, capacity, patient safety, quality of care, and patient and staff satisfaction. The primary target of this process improvement effort is to decrease patient length of stay in the ED from the time an admission order is written. As health care moves into the era of reporting quality indicators; improving quality of care and patient safety rankings will positively affect the organization’s reimbursement rates. The consequences of not improving the efficiency of this process are reduced quality and patient safety (and possibly reimbursement rates), increased costs associated with increased elopement rates, and lost revenue as a result of increased time on diversion. Therefore, it is important to improve this process now in order to maintain reimbursement, control costs, and prevent losing revenue.
, increased costs associated with increased elopement rates, and lost revenue as a result of increased time on diversion. Therefore, it is important to improve this process now in order to maintain reimbursement, control costs, and prevent losing revenue..")
3
Dept. Directors Bed Placement Manager ED Physician Unit Nurse Patient Pt. families Patient admission time Time between admission order written and time bed request is made Time between bed request and patient admission to unit ED staffing levels Ordering protocol Communication process b/w ED staff and Bed Placement staff Unit staffing levels Bed turnover time Lab/imaging result time Patient transport and admission protocol Communication b/w Bed Placement staff and admitting unit

4
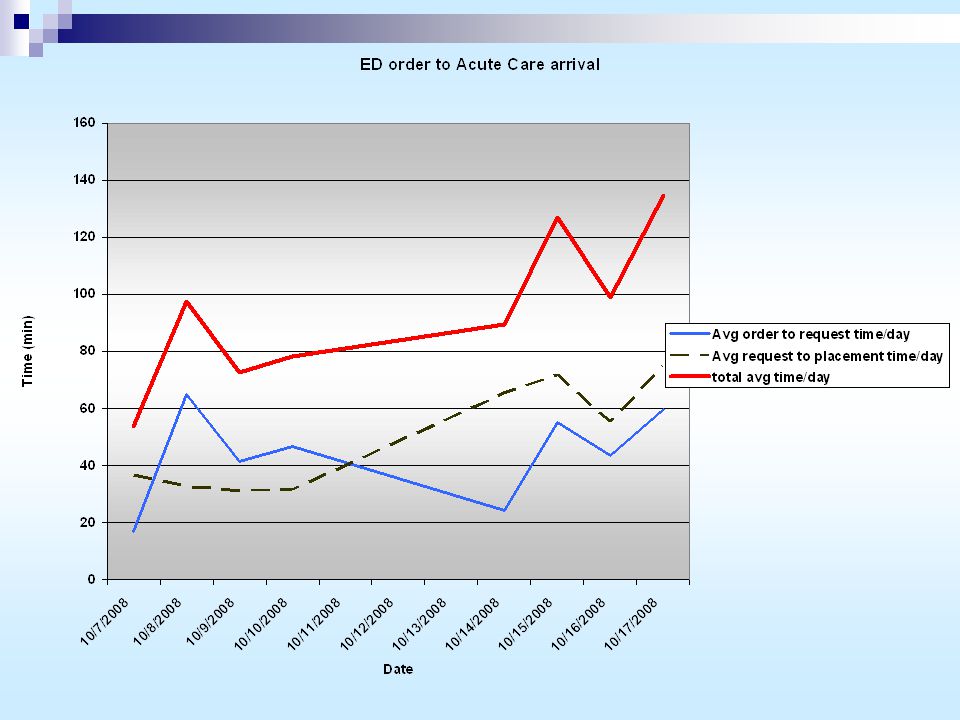
Data Collection Plan Time (min) from the time an admission order is made in ED to the time a bed request is made Time (min) from the time request is made to patient arrival in Acute Care Reasons for delays will ultimately identify new KPIVs Data collected for 8 week days over an 11 day period (10/7 – 10/17) Collected data on 5 patients/day over 8 days = 40 patient sample size Will graphically present: Average order to request time/day Average request to placement time/day Total average time/day
 from the time an admission order is made in ED to the time a bed request is made Time (min) from the time request is made to patient arrival in Acute Care Reasons for delays will ultimately identify new KPIVs Data collected for 8 week days over an 11 day period (10/7 – 10/17) Collected data on 5 patients/day over 8 days = 40 patient sample size Will graphically present: Average order to request time/day Average request to placement time/day Total average time/day")
5
Data file used to create trend chart

7
Fishbone Diagram MaterialsProcesses Adm Order Bed Req Equip Lab Order Transport Unit admiss Bed assign Adm Order PeopleMachines Lab/image Bed Plcmt Env Svcs Admitt staff Phys/nurses IV pump (equip) Lab/image Computers KPOV: Patient Admission Time
 Lab/image Computers KPOV: Patient Admission Time")
8
Data Collection Plan Cont… Graphically present the distribution of total time, for sample data, from Admission Order to patient arrival in Acute Care unit Further breakdown of data; identify which step(s) are contributing the most to overall time Column chart: % contribution to overall time of each step Pie Charts: distribution of reasons for delays Anecdotal information/data used to eliminate KPIVs
 are contributing the most to overall time Column chart: % contribution to overall time of each step Pie Charts: distribution of reasons for delays Anecdotal information/data used to eliminate KPIVs")
9
Distribution of total times from Order Written to Pat. Arrival in Acute Care

10
% Contribution to overall time of each step 10/1710/1610/1510/1410/1010/910/810/7

11
% of sample that was admitted in goal time (<= 50 mins)
")
12
% distribution of reasons why patients were not admitted in goal time

13
Information to eliminate KPIVs Transportation is not an issue: the hospital has successfully implemented a transportation team Lab Delays: Recently implemented I-Stat; software that will produce lab results in 5 minutes Ordering and admission protocol/communication: subject to patient census and unit staffing levels PCU 3:1 patient to nurse ratio – regulated ICU 2:1 patient to nurse ratio – regulated ED 8:1 patient to nurse ratio – not regulated ER census increased by 8% this year Budgeted for 118 pts/day; currently 134 pats/day

14
Acute Care: # of beds cleaned/month and average turnaround time MonthTotal # beds cleanedAv. Turnaround time (mins) May '0816551 Jun '0817255 Jul '0816847 Aug '0815450 Sep '0818045 Oct '0817248 Total = 1011Avg = 49 minutes
 May Jun Jul Aug Sep Oct Total = 1011Avg = 49 minutes.")
15
Bed Turnaround Time

16
Conclusions Following thorough examination of KPIVs; Bed turnaround, staffing levels, patient volume are the main reasons for delays in the KPOV (Patient Admission Time) Lab results delay is being rectified Communication/ordering/placement protocol significantly affected by staffing levels and patient volume Bed turnaround time is all that is measurable; delays in turnaround time stem from poor communication b/w unit nurses and Env. Svcs staff

Similar presentations


 3 Admission Coordinators.>")


