Download presentation
Presentation is loading. Please wait.

1
POLITICAL BAROMETER A Study of Socio-Political Preferences of People of Pakistan

2
Background First civilian government completing it’s term Chief Election Commissioner appointed through parliamentary consensus for the first time in the country’s history Caretaker government to be decided in consultation instead of being chosen by the president

3
The Political Barometer Survey Covers a wide range of socio-political indicators Conducted across broad sections of the society Rapid assessment around 1,300 respondents in 52 districts, reflecting on issues like electoral reform, governance, security, interprovincial relations, arts and culture, civil rights, and foreign policy Strata take account of ethno-linguistic lines instead of the traditional provincial demarcation

4
Sampling Demographic sample based on the population census of the Pakistan Bureau of Statistics Stratified Sampling ▫Ethno-linguistic ▫Gender ▫Urban/Rural ▫Age ▫Income ▫Educational qualification

5
Questionnaire, interviews, and challenges Both open-ended as well as close-ended questions to minimize biases Conducted in 52 districts across Balochistan, FATA, Khyber Pakhtunkhwa, Punjab, and Sindh Occasional reluctance and difficulty by respondents to respond to a few questions The data was verified through randomly contacting reluctant respondants Respondents’ understanding of technical terms like MFN

6
Issues Electoral Process Corruption Foreign Policy Internal Security Political Economy Inter- provincial relations Civil Military Relations

7
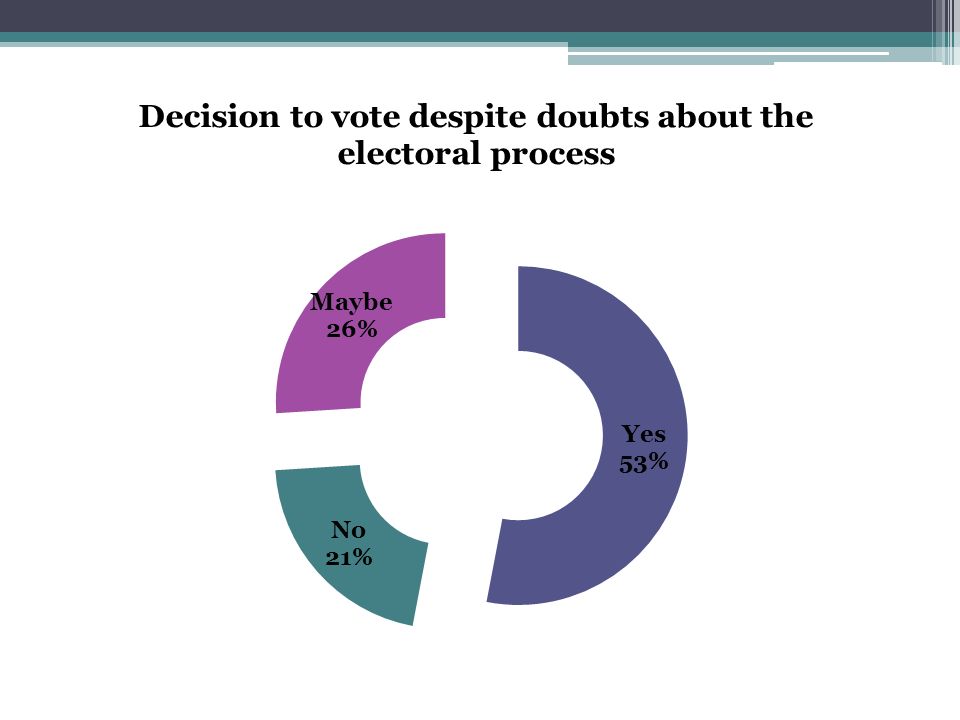
Electoral Process

10
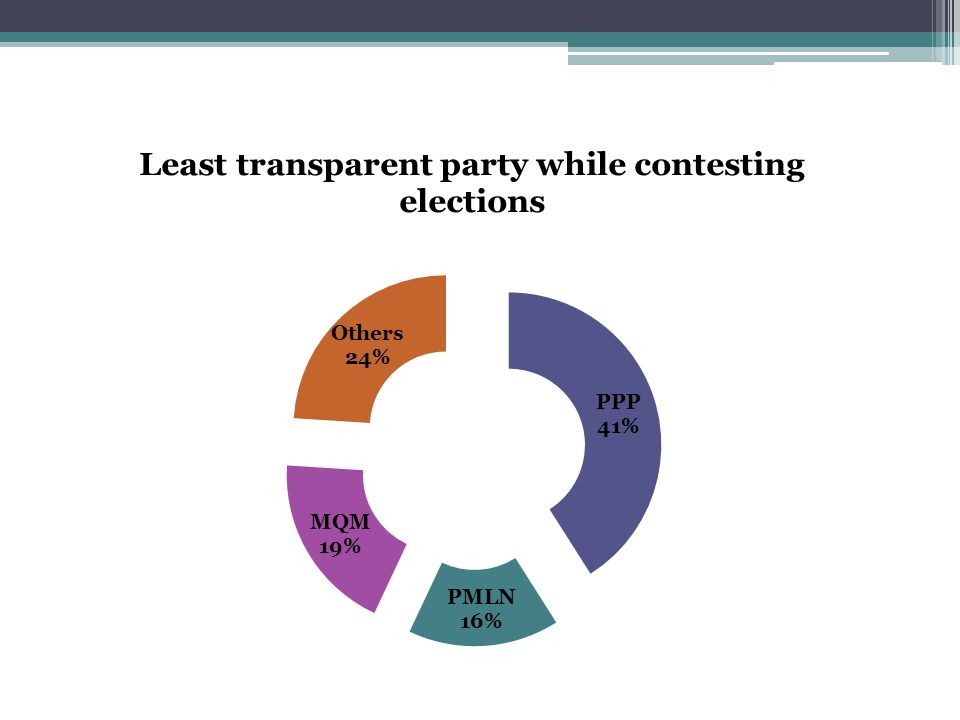
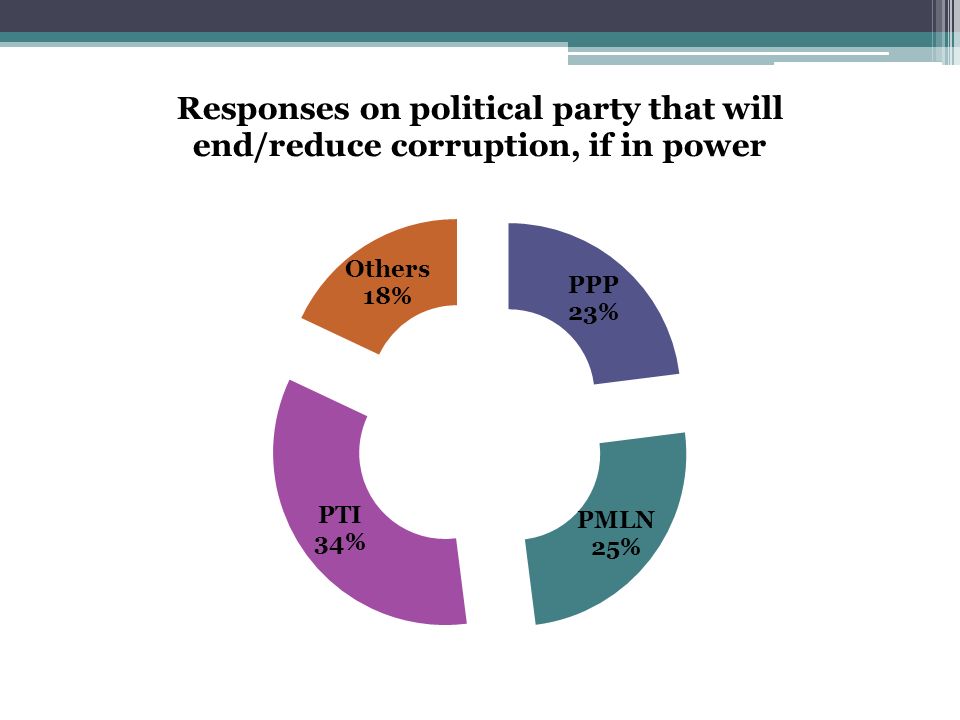
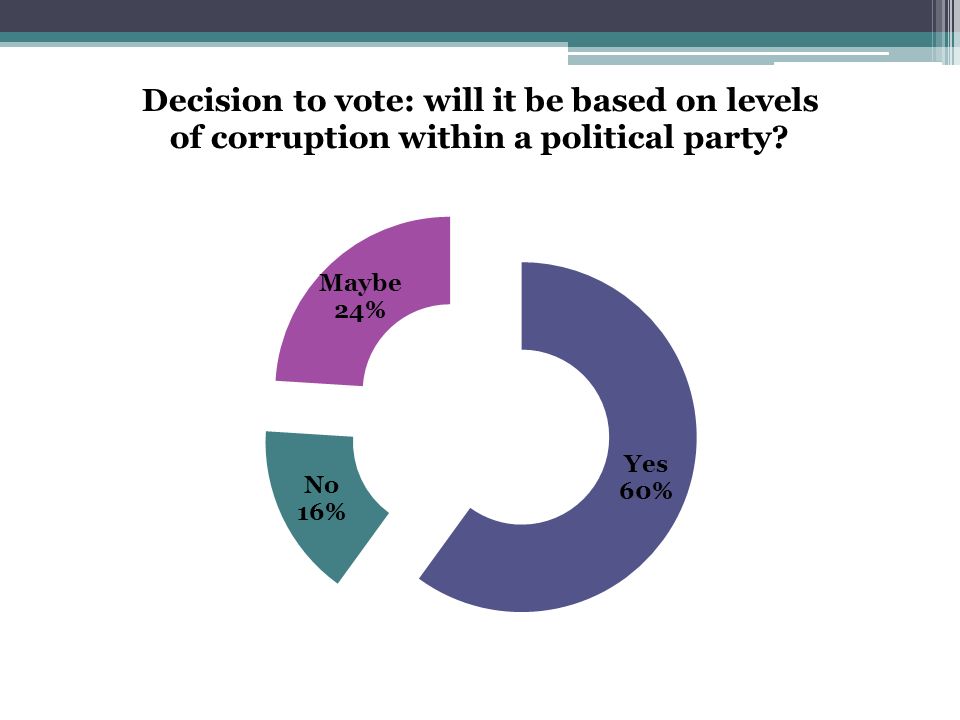
Corruption

13
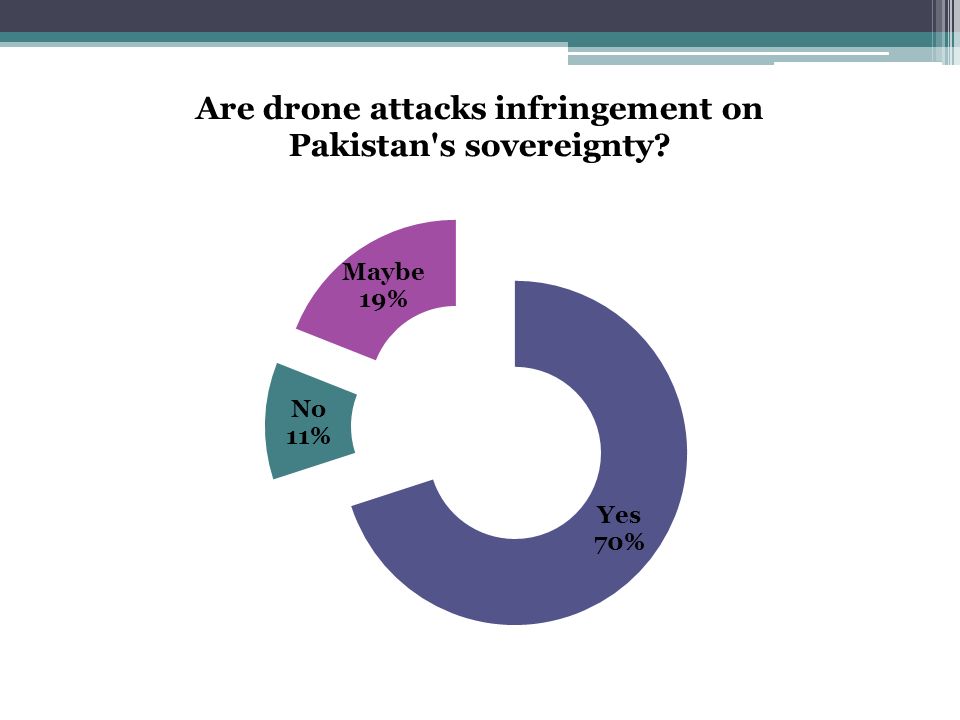
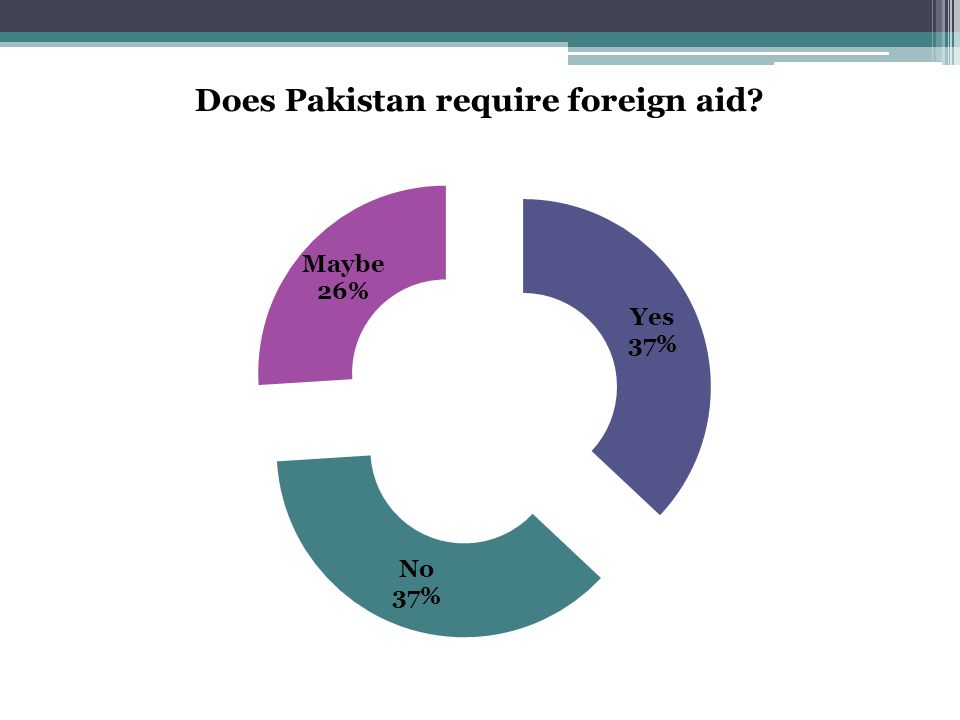
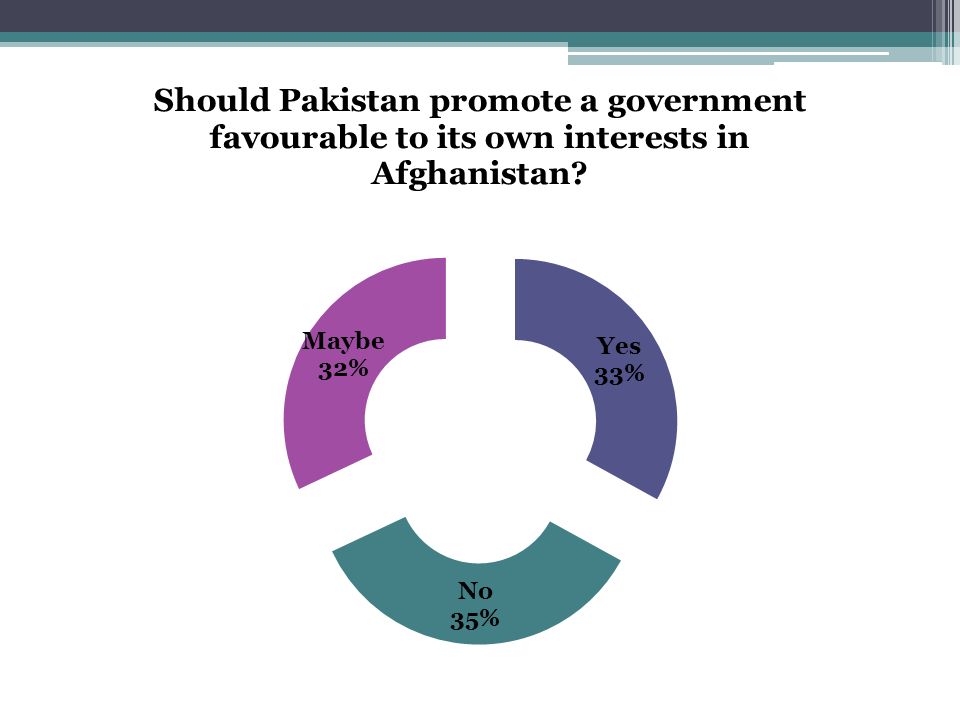
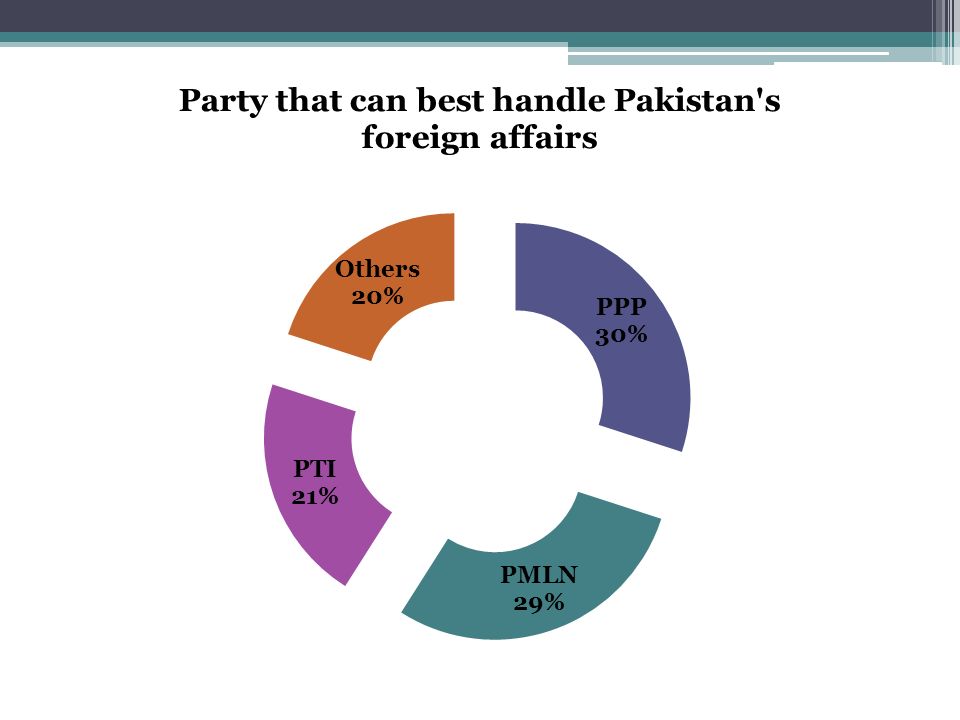
Foreign Policy

16
Relations with neighbors

19
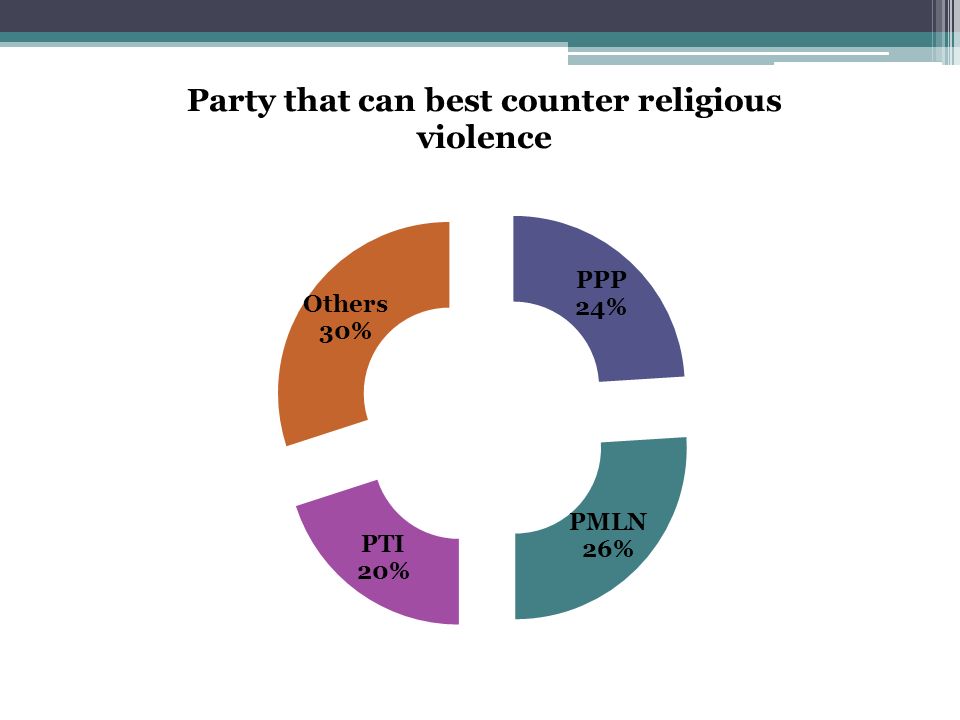
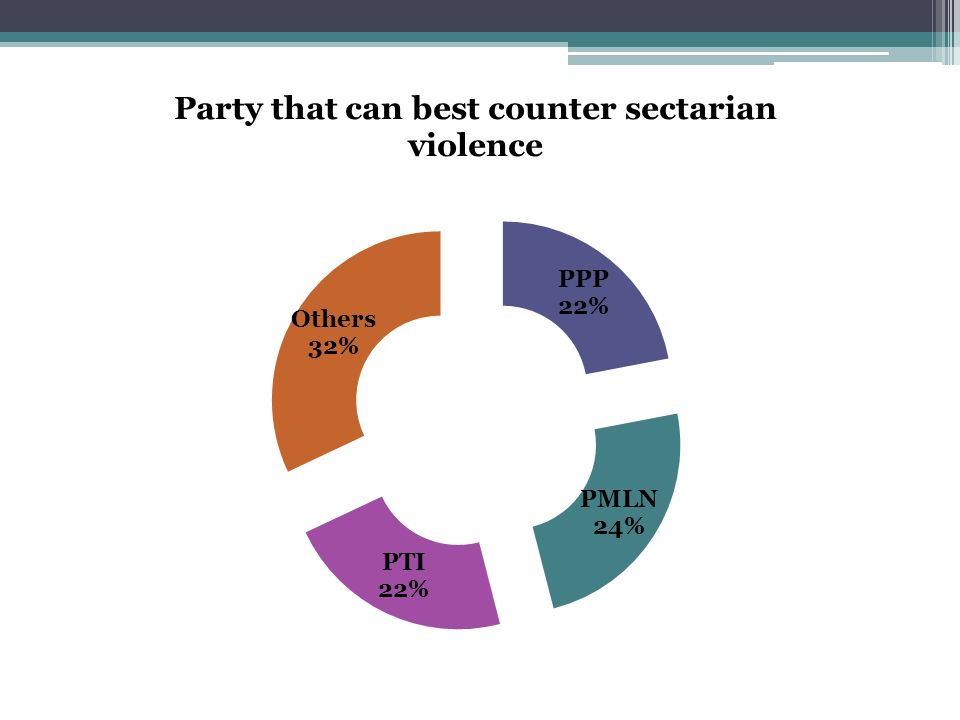
Internal Security

22
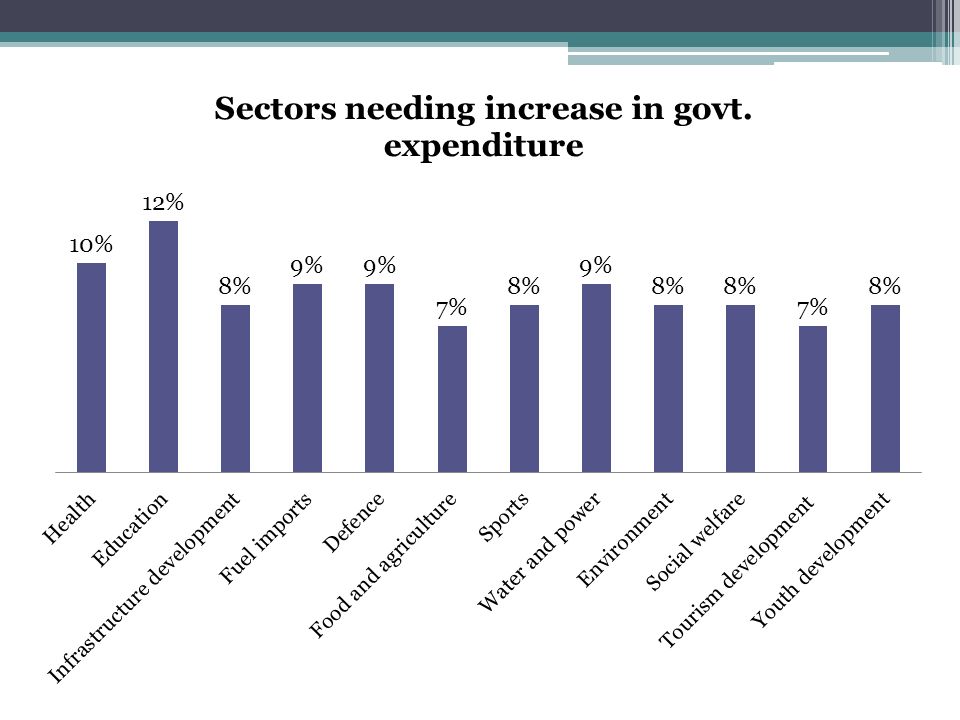
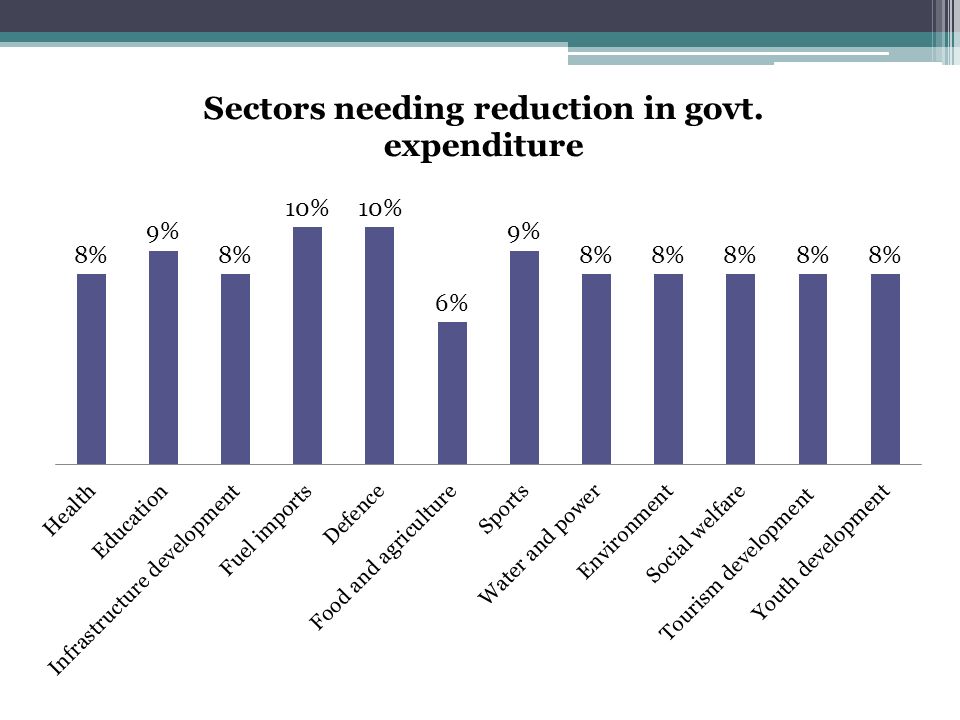
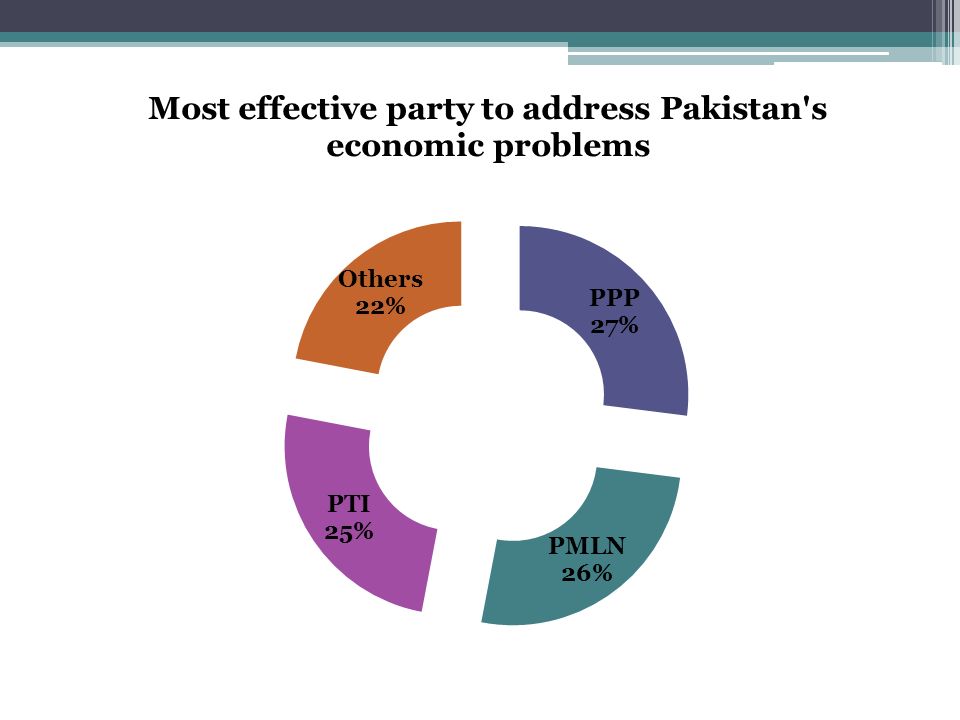
Political Economy

23
Pressing issues based on education levels Higher Levels of EducationLower Levels of Education Extremism Political instability Interprovincial problems Inflation Gender discrimination Food shortages

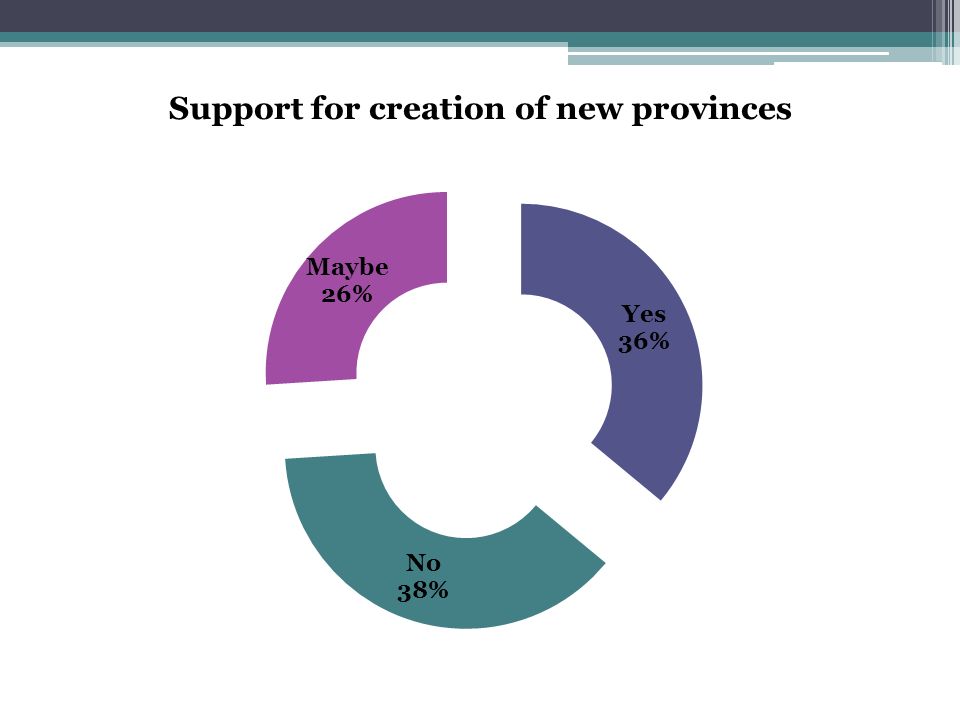
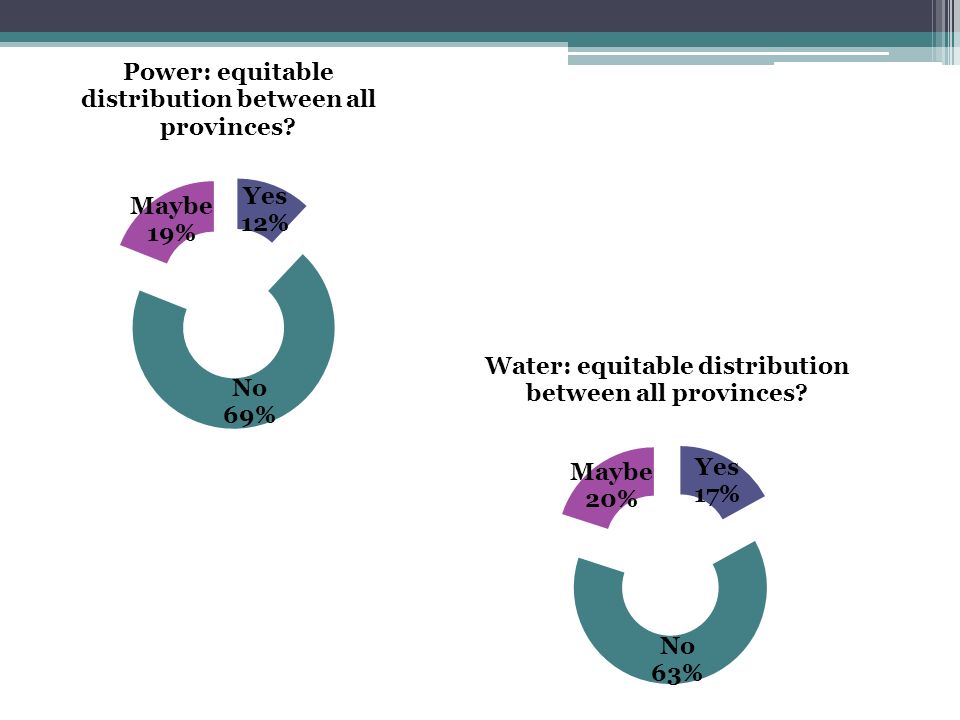
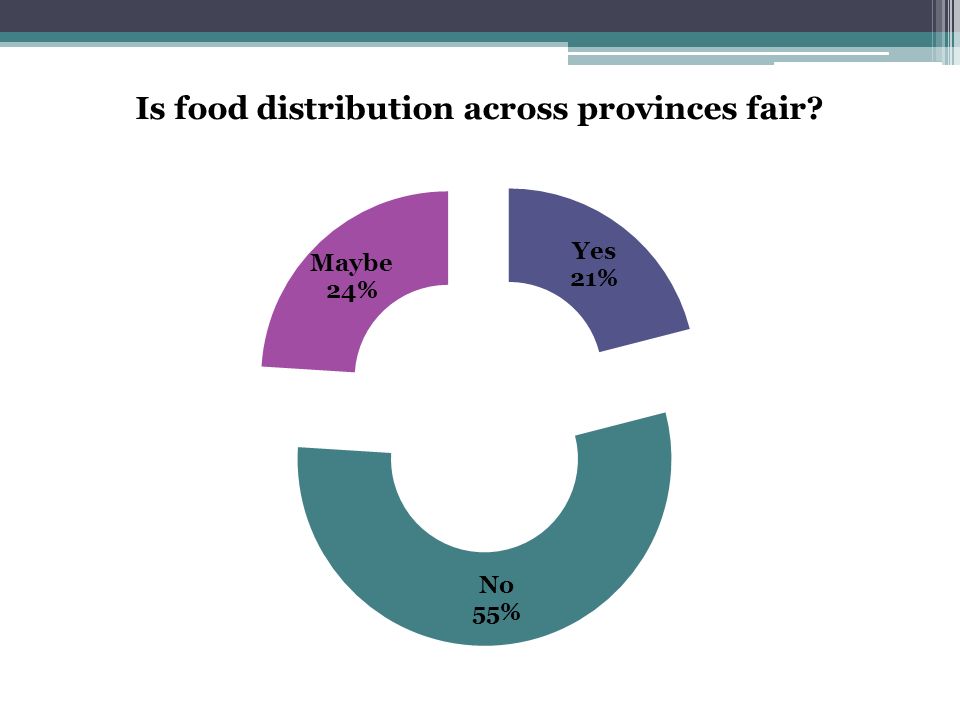
27
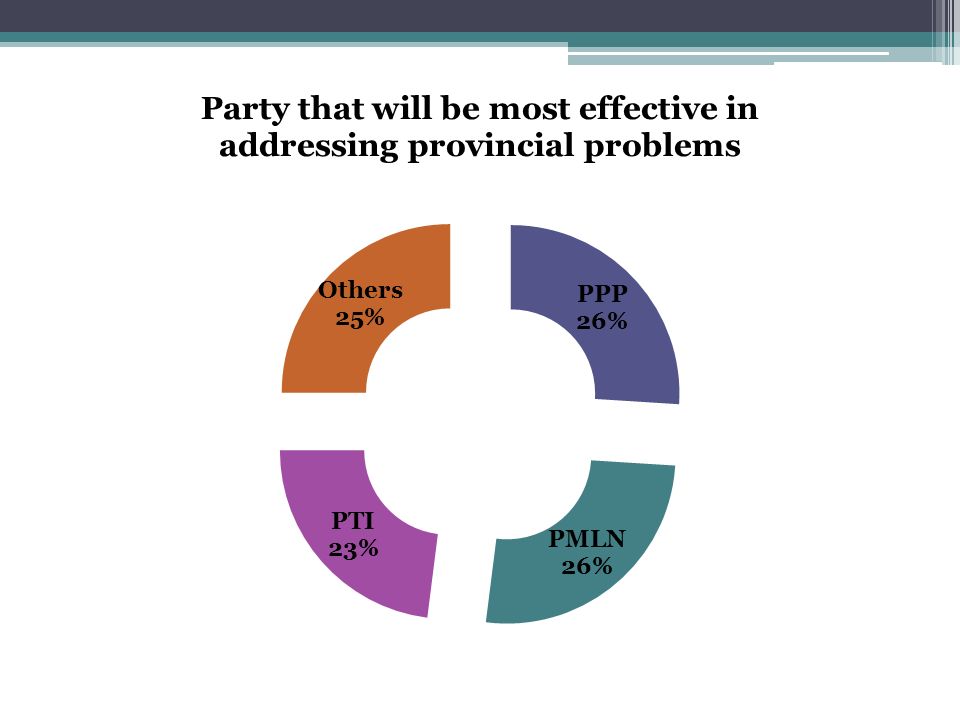
Provincial Matters

32
Civil-military relations

33
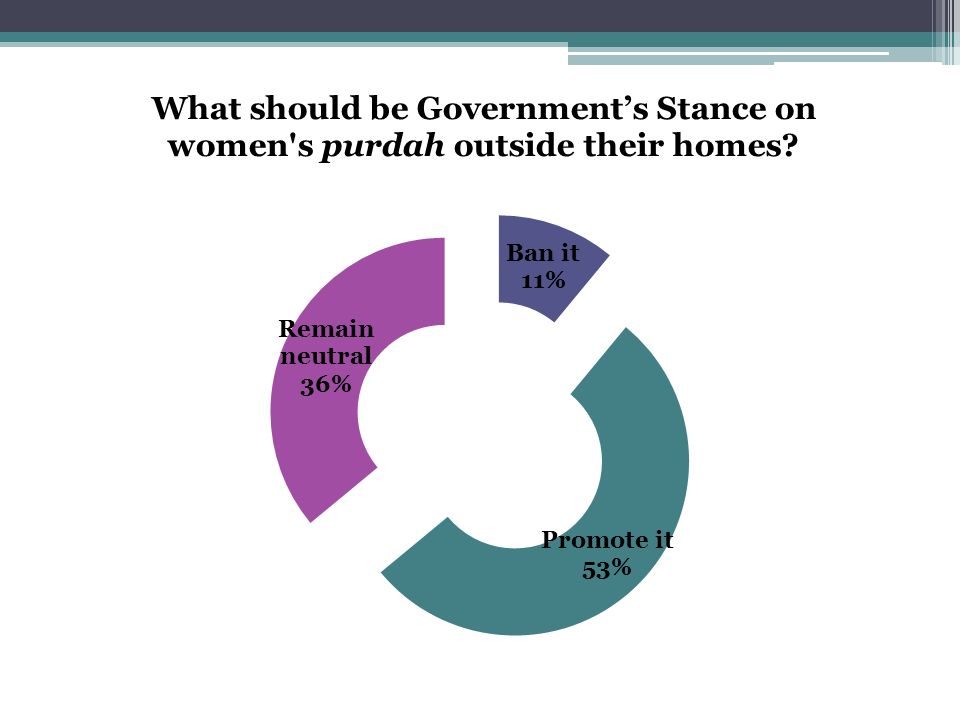
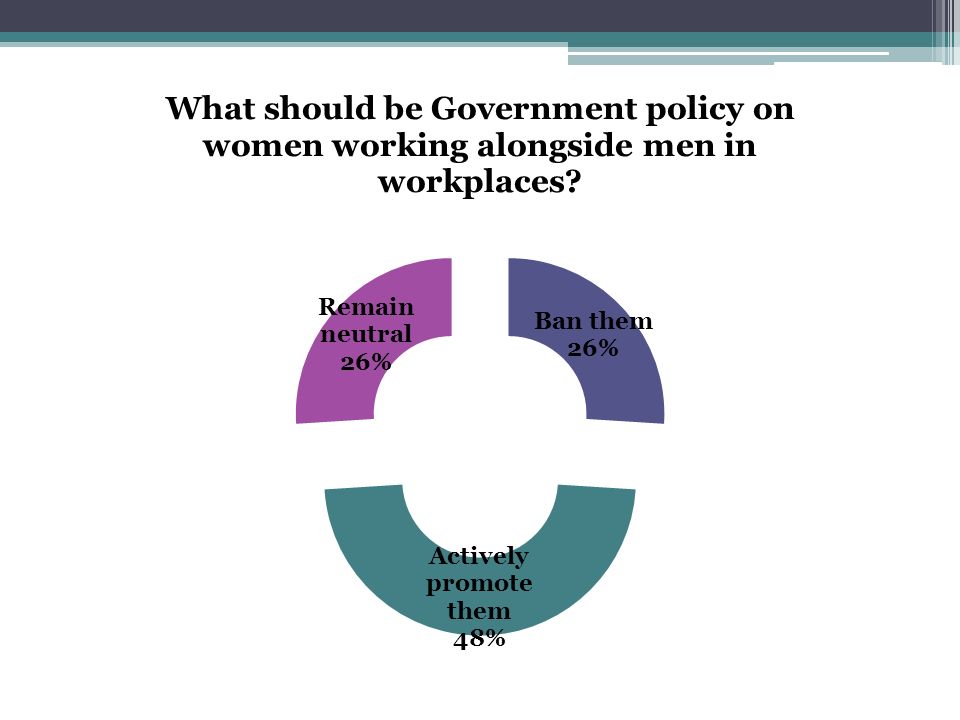
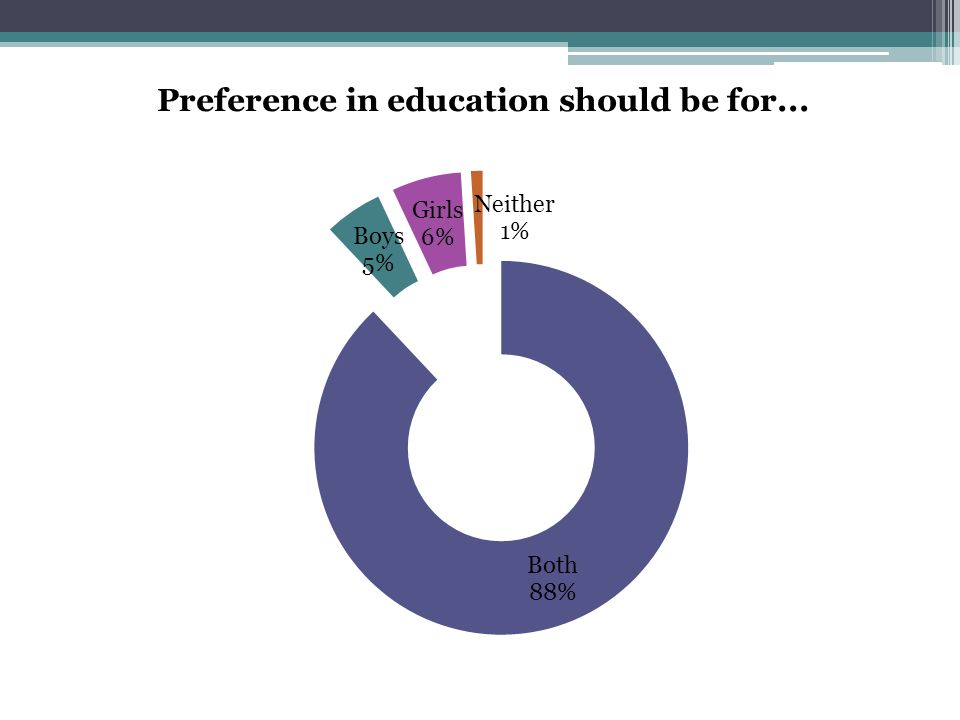
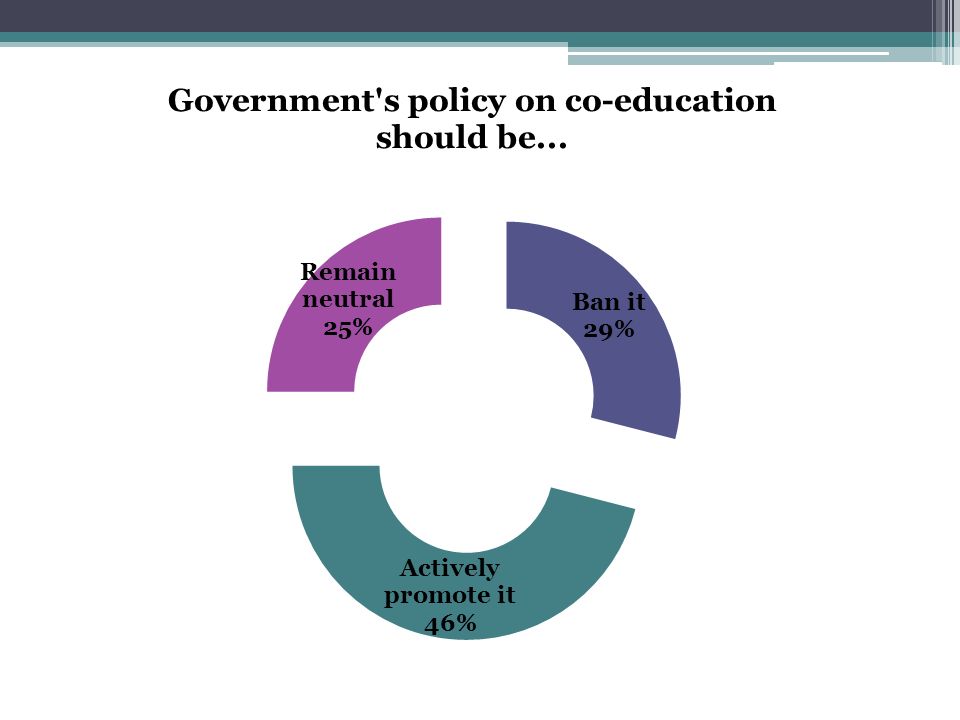
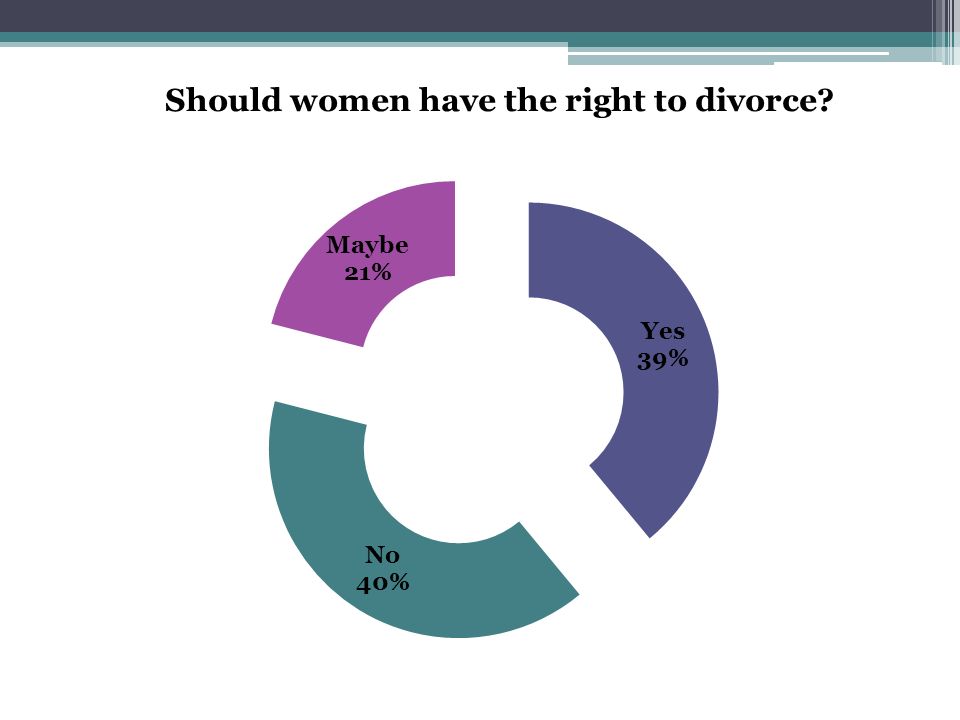
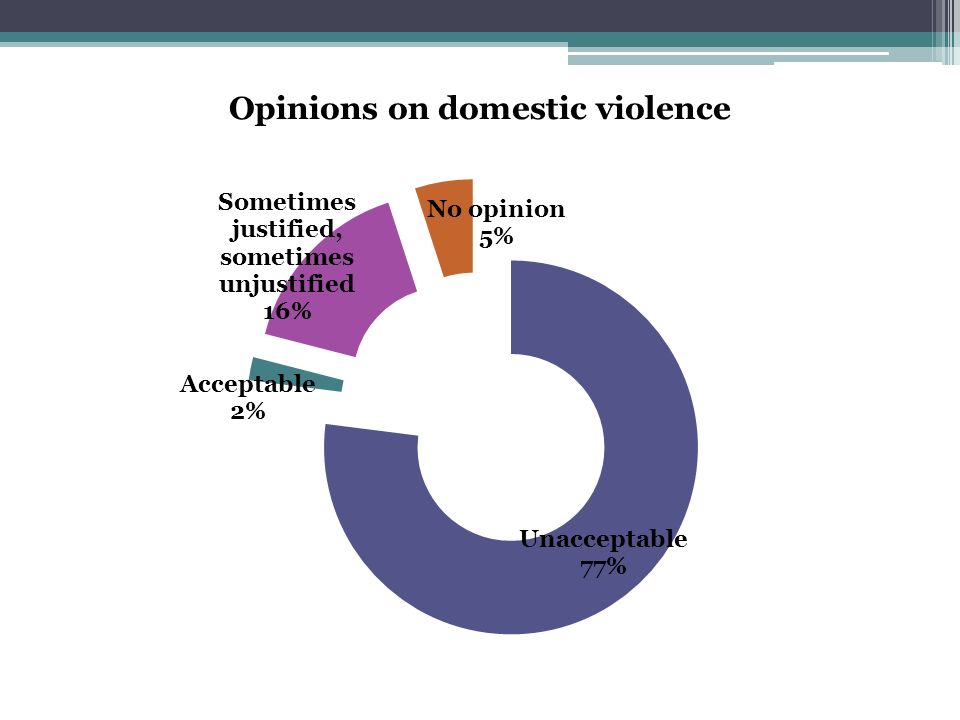
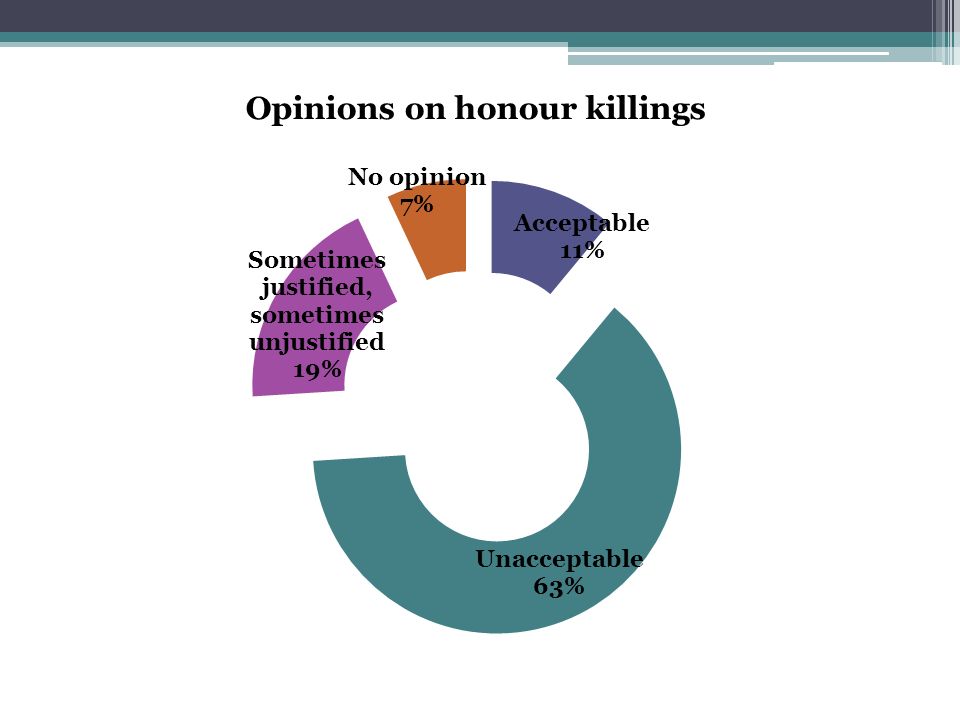
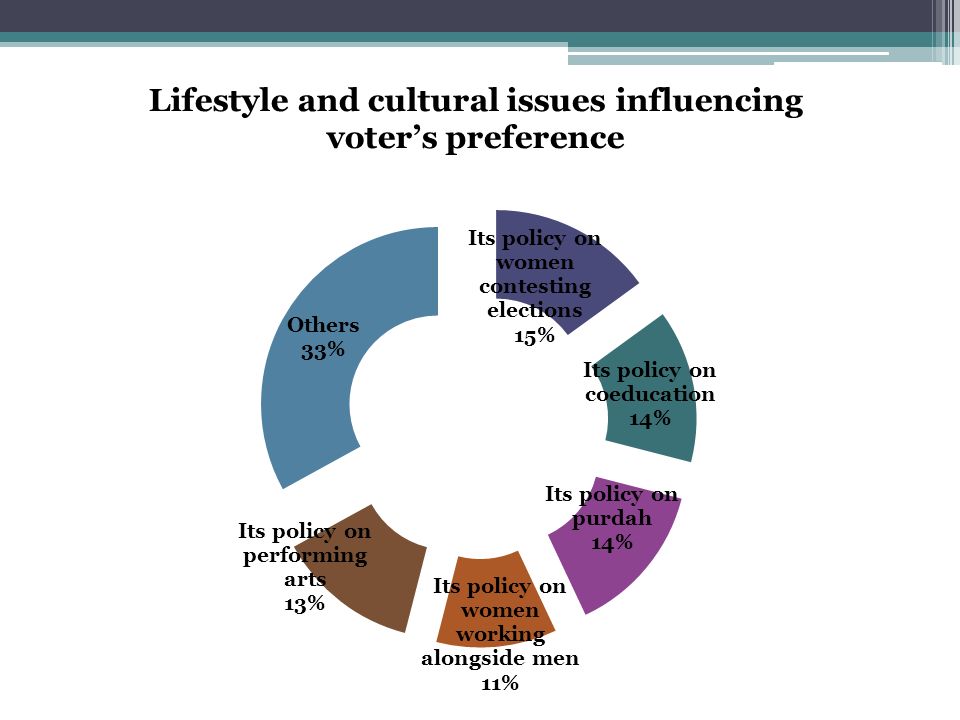
Women

42
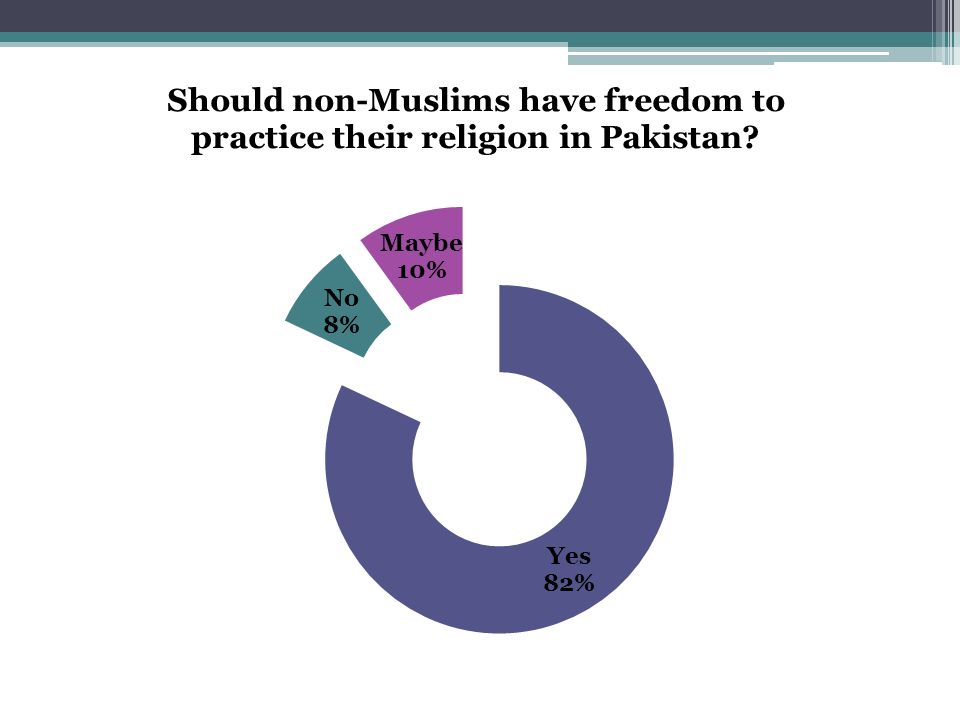
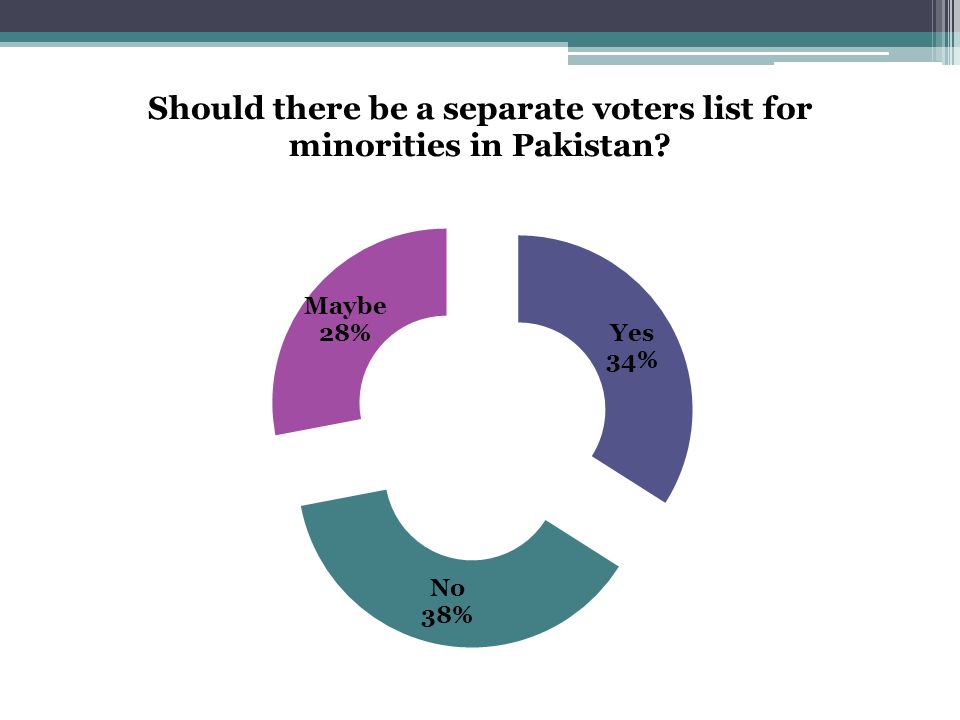
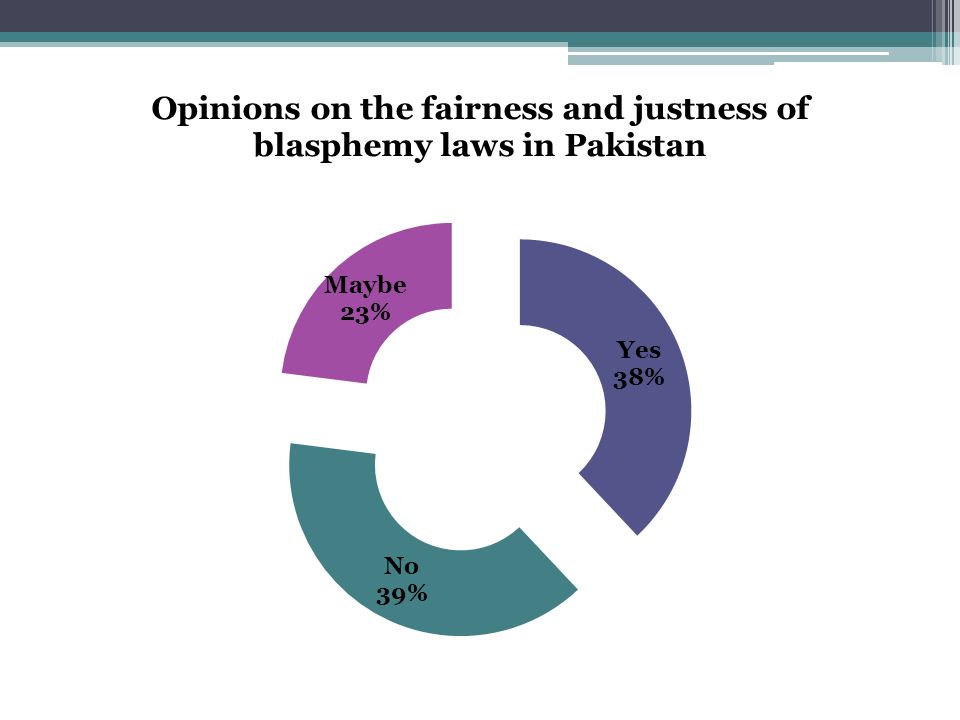
Minorities

46
Voting trends *Does not include respondents who selected no party

47
Party support across different ethnicities

48
Voting trends vis-à-vis voting history Vote bank for PML-N Stagnant Vote bank for PPP Declined Vote bank for PTI Stronger urban base

50
PPP ▫Roughly one-third of the respondents earning below Rs. 30,000 indicate a preference for PPP ▫Reinforces the pro-poor image of the party ▫Support from those earning over Rs. 30,000 dropped to 10.8% PML-N ▫Support appears similar across all income groups PTI ▫33% of those earning over Rs. 250,000 intend to vote for the party

51
MQM ▫33% of those earning over Rs. 250,000 intend to vote for the party ▫Only 4% of those earning between Rs. 100,000 and 250,000 expressed intention to vote for the party ▫Below 100K Support for smaller parties appears to weaken as income level rises PTI eroding PPP votebank

52
The 5 Scenarios

53
Scenario 1 IF: ▫Electoral alliance between PPP and its current allies, ANP, MQM, and PML-Q ▫Anti-PPP alliance at the same time: PML-N, JUI, JI, minus PTI THEN: ▫PPP and alliance may capture 38.1% of the vote ▫Anti-PPP alliance, minus PTI, may secure 29.5% ▫Together with the PTI, the anti-PPP alliance may give a tougher time to PPP

54
IF: ▫PPP partners with current allies – ANP and PML-Q ▫MQM opts for the anti-PPP alliance; PTI decides not to be part of either THEN: ▫PPP and allies secure 33.9% of the votes ▫Opposition alliance secures 33.7% of the votes ▫Weaker government against a stronger opposition Option 1: ▫PML-N led govt.: PPP and PTI form opposition Option 2: ▫PPP led govt.: PML-N and PTI form opposition Scenario 2

55
IF: ▫Electoral alliance between PPP and current allies – ANP, MQM, and PML-Q ▫Opposing alliance between PML-N and PTI THEN: ▫PML-N and PTI jointly sweep through, capturing 45.0% of the votes relatively stable govt. at the centre ▫Anti-PPP parties may also join in Scenario 3

56
IF: ▫Electoral alliance between PPP and PTI ▫PML-N led strong opposing alliance THEN: ▫PPP and PTI secure 49.3% of the votes stable govt. at the centre Scenario 4

57
IF: ▫PPP-led coalition with current allies ▫PTI and JI partner for an alliance ▫PML-N led alliance with JUI and other anti-PPP parties THEN: ▫PPP and allies secure 38.1% of the votes ▫PTI and JI alliance secures 23.9% ▫PML-N led alliance secures 25.9% Scenario 5

58
What is expected… Scenarios 3 and 4 unlikely Elections unlikely to be dominated by a single political party PPP may have to continue with its current alliance An emerging PTI Likelihood of a strong opposition high Electorate divided over ‘crucial’ issues

59
Thank you www.sdpi.org, www.sdpi.tv

Similar presentations


stance on basic education.>")


