Download presentation
Presentation is loading. Please wait.

2
Ms. Fatema Rasul SOURCE: RESEARCH IN APPLIED LINGUISTICS BECOMINING A DISCERNING CONSUMER FRED L. PERRY, JR.

3
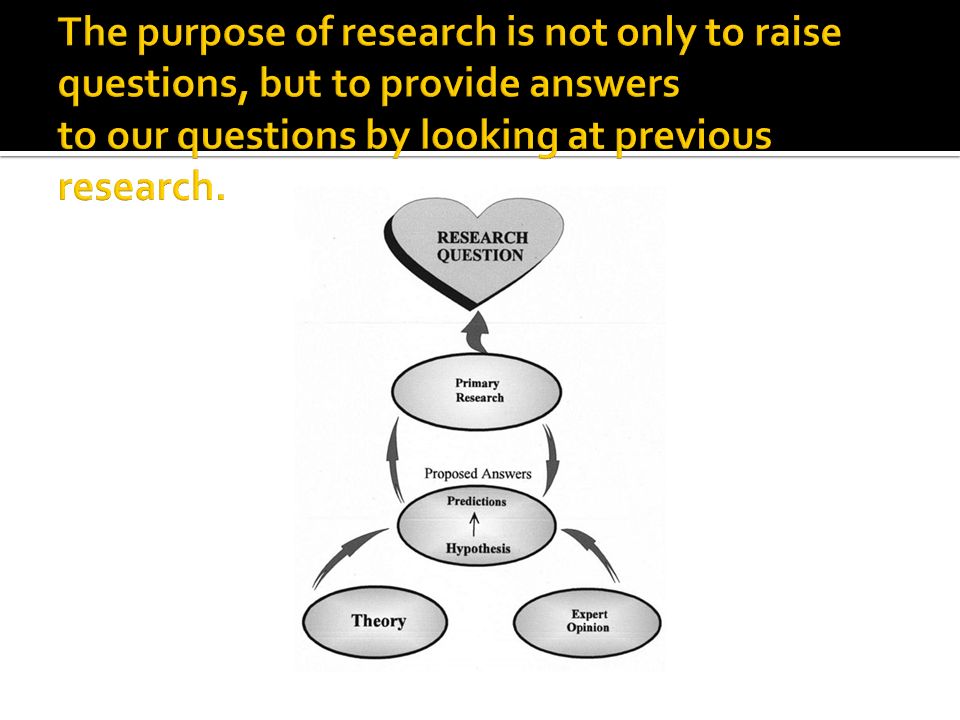
What Is All This Research About? Research is the process whereby questions are raised and answers are sought by carefully gathering, analyzing, and interpreting data. The heart is the research question. It is the beginning of the research process. Any given research question asks, explicitly or implicitly, either what or why.

6
How you can find research studies that might provide potential answers to your questions. Today is the day of personal computers and the Internet, which make the task of finding relevant research much easier. The

7
There are three places where you can locate primary research: preliminary sources, secondary sources, and tables of references/bibliographies. Preliminary Sources: Publications that lead us to primary research are known as preliminary sources. Some of the more traditional ones that can be found in bound copies in most university libraries are Educational Index, Current Index to Journals in Education (CIJE), Language Teaching, Linguistics and Language Behavior Abstracts (LLBA), Modern Language Association (MLA) International Bibliography, Social Science Index, Psychological Abstracts, and Resources in Education (RIE) However, thanks to the computer age, many of the bound preliminary sources have now been converted to electronic databases1 and put on CDROM disks and/or into Web sites on the Internet.
, Language Teaching, Linguistics and Language Behavior Abstracts (LLBA), Modern Language Association (MLA) International Bibliography, Social Science Index, Psychological Abstracts, and Resources in Education (RIE) However, thanks to the computer age, many of the bound preliminary sources have now been converted to electronic databases1 and put on CDROM disks and/or into Web sites on the Internet..")
8
VENUES FOR PRIMARY RESEARCH PUBLISHED RESEARCH CONFERENCE PRESENTATIONS DATABASE:which has neither been published in a journal nor presented at a conference. DOCTORAL DISSERTATION JOURNAL PRESENTATIONS

9
A third criterion you want to keep in mind when weighing the value of a research study for answering your questions is HOW RECENT IT IS. Studies that are 10 years old or older do not usually carry the same weight as more recent studies unless they are seminal studies. When searching, you will want to begin with the most recent and work your way back. The most recent research will bring you up to date on what is happening.

10
Applied Linguistics is concerned with practical issues involving language in the life of the community. The most important of these is the learning of second or foreign languages. multilingualism, language education,, and the assessment and treatment of language difficulties. Other areas of interest include professional communication, for example, between doctors and their patients, between lawyers and their clients etc. (http://www.linguistics.unimelb.edu.au/about/about.html)http://www.linguistics.unimelb.edu.au/about/about.html Research in the field of applied linguistics covers a vast domain of topics that deals with just about anything where language relates to society.

11
It is for you, the person who, for whatever reason, wants or needs to gain a better understanding about language issues that are important to him or her. This includes the following: Master of Arts students in applied linguistics Teachers of second/foreign languages Administrators of second/foreign language programs Parents of students in language programs Significant strides made in applied linguistic research have aided us in the improvement of teaching and learning of languages throughout the world. After all, language is the backbone of society.

12
Go to the Web site www.eric.ed.gov; you will be taken to the main Web page for ERIC. This screen welcomes you to the ERIC Database, which is the gateway to more research than you will ever be able to read in your lifetime! The database currently contains research from 1966 onward and is updated often.

13
Secondary sources are ones that refer to or summarize primary research through the eyes of someone other than the person(s)who did the study. These are commonly found in the form of literature reviews, position papers, and books. The Annual Review of Applied Linguistics is dedicated for this purpose in applied linguistics. Another journal that contains only reviews is the Review of Educational Research.

14
Another type of secondary source commonly found are position papers. Often they resemble literature reviews, but with a much more focused purpose. In these, writers argue their particular viewpoints or positions on various issues.

15
Research articles typically follow a standard format for presentation in research journals. 1. Title 2. Author(s) and institution(s) 3. Abstract 4. Introduction 5. Methodology (Method) 6. Results 7. Discussion/Conclusion 8. References
 and institution(s) 3. Abstract 4. Introduction 5. Methodology (Method) 6. Results 7. Discussion/Conclusion 8. References.")
16
TITLE: Although many readers might not think the title is very important, it is in fact critical. Titles either attract potential readers or dissuade them from reading the article. A well-written title should give enough information to inform the consumer what the study is about. It might suggest what the research question is or even what hypothesis is being tested, but there should be no doubt what issue is being investigated. The title should also indicate what type of article it is. There should be no necessary guessing as to whether the study is primary research, a review of the literature, or a position paper. In summary, the three criteria to look for in a title are: focus of the study, type of article, and succinctness.

17
Exercise 3.1 Look at each of the following titles of real studies and answer the following: 1. What is the study’s a. focus? b. research question? c. hypothesis? 2. Can you tell if the article is a primary study, a position paper, or a literature review? Explain your reasoning. Titles: Learners’ perceptions of listening comprehension problems (Hasan, 2000) Preliminary findings of a format-based foreign language teaching method for school children in the Basque Country (Azpillaga et al., 2001) Finding out about students’ learning strategies by looking at their diaries: A case study (Halbach, 2000)
 Preliminary findings of a format-based foreign language teaching method for school children in the Basque Country (Azpillaga et al., 2001) Finding out about students’ learning strategies by looking at their diaries: A case study (Halbach, 2000).")
18
A well-written abstract should summarize five essential things to help the reader know what the study is about: (a) purpose of the study, (b) source(s)from where the data are drawn (usually referred to as participants), (c) the method(s) used for collecting data, (d) the general results, and (e) general interpretation of the results.
 purpose of the study, (b) source(s)from where the data are drawn (usually referred to as participants), (c) the method(s) used for collecting data, (d) the general results, and (e) general interpretation of the results.")
19
Find a recent research study of interest and examine the abstract carefully. Fill in the Abstract Analysis Grid below and answer the following questions: Abstract Analysis Grid Essentials Content Purpose of the study Sample Method used for collecting data Results Interpretations of results

20
The introduction is the brains of the study. In it we should find the topic being investigated, why it is important enough to be studied, the research question, any theory being considered, any hypothesis being proposed, and any predictions made. In addition, constructs and special terminology should be defined that will be used throughout the study. Typically, the introduction should provide historical context to the issue being investigated and bring in any theory that may be relevant to the reader. It summarizes and references a number of articles to introduce the reader to the study.

21
Use a recent journal related to your major. Find a research study of interest and examine the introduction carefully. Perform the following tasks: 1. Outline the argument with the main points (cf. Box 3.1). a. List the premises of the argument. b. Indicate what support is given for each premise by citing one reference to a primary research study. c. How well do you think the points logically relate to one another. 2. Identify the conclusion of the argument that should be in the form of questions and/or hypotheses/predictions. 3. How well do you think the conclusion logically relates to the preceding argument.
. a. List the premises of the argument. b. Indicate what support is given for each premise by citing one reference to a primary research study. c. How well do you think the points logically relate to one another. 2. Identify the conclusion of the argument that should be in the form of questions and/or hypotheses/predictions. 3. How well do you think the conclusion logically relates to the preceding argument..")
22
The methodology (or method) section consists of the skeleton of the study. If it is well written, others should be able to replicate the study exactly. The ability to replicate a study is the principal criterion used to judge the quality of this component of a research report. The methodology section tells us who was studied, what was studied, and how the information was collected and analyzed.

23
The sample is the source from which data are drawn to answer the research question(s) and/or to test any hypothesis that might be made. The sample consists of one or more cases. In most cases, the samples are made up of human beings referred to as subjects or, more currently, participants. In other studies, the cases might be inanimate objects from which the researcher extracts his or her data. Examples are corpora of verbal discourse, such as an accumulation of newspaper articles, or when researchers cull their data from transcriptions of taped dialogues. There are different uses that demands different combinations of participants/objects to answer different questions.

24
Sample Research design treatment(s) (optional) techniques (optional) materials (optional) Data-collection procedures instruments (optional) observational methods Procedures followed
 (optional) techniques (optional) materials (optional) Data-collection procedures instruments (optional) observational methods Procedures followed")
25
The overall structural design used in the study. In a well-written design section. The variables1 of the study are clearly identified and defined. In fact the term construct is usually replaced by the term variable. If something does not vary, it is not a variable. For example, language ability is a construct that varies (i.e., people vary in language ability). Therefore, it is referred to as variable when used in a study, regardless of whether the word construct is used. Gender is a variable in that it has two possibilities: male and female. Examples of other possible variables are nationality, language proficiency, method of instruction, and so on. Variables can have different classifications. A variable may be independent, dependent, moderating, observational, or extraneous. How a variable is classified depends on the role the variable plays in a study and the type of research design being used. In other words, the same variable can be independent, dependent in another, moderating in a third, observational in a fourth, and extraneous in a fifth.
. Therefore, it is referred to as variable when used in a study, regardless of whether the word construct is used. Gender is a variable in that it has two possibilities: male and female. Examples of other possible variables are nationality, language proficiency, method of instruction, and so on. Variables can have different classifications. A variable may be independent, dependent, moderating, observational, or extraneous. How a variable is classified depends on the role the variable plays in a study and the type of research design being used. In other words, the same variable can be independent, dependent in another, moderating in a third, observational in a fourth, and extraneous in a fifth..")
26
An independent variable (IV) is regarded as the variable of influence—that is, it affects the variation (or change) in another variable. The variable being influenced (or changed) is labeled the dependent variable (DV), in that its variation depends on changes in the independent variable. 1A variable is simply something that varies, usually corresponding to one of the constructs in a study. The one doing the affecting is the independent variable, and the one being affected is the dependent variable. Often you can spot them in the title of the study. For example, the title of Treiman, Kessler, and Bourassa’s (2001) study is “Children’s Own Names Influence Their Spelling.” The IV is something related to children’s own names. In operational terms, the IV was the awareness of children to the spelling of their own names. The DV was the spelling ability of children for other word
 is labeled the dependent variable (DV), in that its variation depends on changes in the independent variable. 1A variable is simply something that varies, usually corresponding to one of the constructs in a study. The one doing the affecting is the independent variable, and the one being affected is the dependent variable. Often you can spot them in the title of the study. For example, the title of Treiman, Kessler, and Bourassa’s (2001) study is Children’s Own Names Influence Their Spelling. The IV is something related to children’s own names. In operational terms, the IV was the awareness of children to the spelling of their own names. The DV was the spelling ability of children for other word.")
27
A study can have more than one independent variable and/or dependent variable as well. For instance, the Zahar et al. (2001) study entitled “Acquiring Vocabulary Through Reading: Effects of Frequency and Contextual Richness” indicates two IVs, frequency and contextual richness, and one DV, vocabulary acquisition. Also related to the IV and the DV is the moderating variable (MV). As the name suggests, this variable works as a go-between from the IV to the DV; that is, it moderates the effect that the IV has on the DV. Figure 3.1 shows the intermediate role the MV plays in a study. For instance, in the study by Zahar et al. (2001), the two IVs were frequency of word occurrences and richness of context. The DV was vocabulary acquisition. However, they used an MV as well: learner proficiency. In other words, they wanted to know whether the effect of the two IVs on the DV was different depending on different levels of language proficiency.
 study entitled Acquiring Vocabulary Through Reading: Effects of Frequency and Contextual Richness indicates two IVs, frequency and contextual richness, and one DV, vocabulary acquisition. Also related to the IV and the DV is the moderating variable (MV). As the name suggests, this variable works as a go-between from the IV to the DV; that is, it moderates the effect that the IV has on the DV. Figure 3.1 shows the intermediate role the MV plays in a study. For instance, in the study by Zahar et al. (2001), the two IVs were frequency of word occurrences and richness of context. The DV was vocabulary acquisition. However, they used an MV as well: learner proficiency. In other words, they wanted to know whether the effect of the two IVs on the DV was different depending on different levels of language proficiency..")
28
Extraneous variables (EV) are any variables that the researcher does not want to influence his or her DV other than the IV. Observational variables (OV) are variables that are observed without looking at the effects of one variable on another.
 are variables that are observed without looking at the effects of one variable on another..")
29
There are basically two sampling paradigms used for gathering data. The first is the Information-rich paradigm. The second is the Representative sample paradigm. As the names suggest, the first type tries to get samples that are rich with the information the researcher is trying to uncover, whereas the second attempts to obtain a sample that is representative of a larger group.

30
Typically, but not necessarily, studies that use the information-rich sampling paradigm have small sample sizes. These can range from one participant/ object, as in a case study, to larger numbers. However, with this approach, the emphasis is always on the quality of the information taken from the sample, not the quantity. One particular genre of research methodology, qualitative research, uses this type of sampling paradigm almost exclusively.

31
The sample should provide a very good example of the phenomenon that is being studied under conditions relevant to the research question.

32
How the information is collected for the purpose of a research study. Most studies involve either instruments and/or observational procedures. Instruments specifically relate to the devices used to collect the data. These are usually in the form of surveys or tests. They can be presented in written, audio, or visual format. Responses can be gathered via paper and- pencil tests, computer administered tests, video camera, or audiotape recorder. Other studies may not involve any data-gathering instruments, but may involve personal observations of subjects or objects. These studies typically use video or audio recording to keep a record of the data in case there is need for validation, but the actual data collection is done by an observer or a group of observers.

33
In this section, the results of any data analysis are given. Depending again on the nature of the research design, different methods are used to try to make sense out of the data. One common method is to use statistics. In some studies, called qualitative studies, the results section contains verbal data consisting of detailed descriptions of what was observed. The results section of a study is important and should not be avoided. The strengths and weaknesses of a study can often be found in the choice of a data analysis procedure that affects the results. Conclusions based on faulty results cannot be used to answer our research questions.

34
The final section of a research study discusses the results and concludes the study. If the discussion is exceptionally lengthy, the conclusion may be separated from it. A well written discussion/conclusion section also relates the findings of the study to previous research that has been done and to any theorizing that has been going on regarding the research topic. In addition, the author(s) should evaluate his or her own study by pointing out its strengths and weaknesses. This section characteristically concludes with what further research needs to be done and suggestions on how it might be done.
 should evaluate his or her own study by pointing out its strengths and weaknesses. This section characteristically concludes with what further research needs to be done and suggestions on how it might be done..")
35
It is the overall plan for carrying out a research study. Research does not provide just one simple type, nor even a choice between only two types. Rather, research can be classified, at least, by three intersecting continua: Basic–Applied, Qualitative–Quantitative, and Exploratory–Confirmatory.

36
RESEARCH DESIGN Although these continua are independent from each other, any given study can be classified somewhere on an intersection of the three. This means that a study would appear at some point out in the three-dimensional space, represented by Fig. 5.1. Each continuum is first defined with an explanation showing how a study can be located on it. Then an example is given on how one study can be classified on all three continua simultaneously and what this might look like in three- dimensional space.

37
EXPLORATORY BASIC QUANTITATIVE CONFIRMATORY QUALITATIVEAPPLIED

38
This continuum represents research that ranges from the highly theoretical (Basic) to the very practical (Applied). At the Basic end of the continuum, research is hypothetical, dealing mainly with highly abstract constructs. Nevertheless, these studies are important for looking at the underlying linguistic, psychological, or sociological mechanisms that might be eventually applied in the classroom. In fact, one might argue that this type of research reveals the theoretical foundations on which all other research rests.

39
At the other end of the same continuum is Applied research. As you would expect from the previous discussion, research that is directly applicable to the teaching/learning situation would be placed here. Studies that deal with teaching methods, or ones that try to address immediate problems in the classroom, would fit at this end of the continuum. To illustrate, Fukushima (2002) explored the effects of having L2 students do an audio video project on learner empowerment, autonomy, and real-life applicability, along with any pedagogical implications. However, some studies might be considered in between these two extremes. If a study is built on a heavy theoretical base, yet has clear practical implications, it would fall somewhere in the middle.
 explored the effects of having L2 students do an audio video project on learner empowerment, autonomy, and real-life applicability, along with any pedagogical implications. However, some studies might be considered in between these two extremes. If a study is built on a heavy theoretical base, yet has clear practical implications, it would fall somewhere in the middle..")
40
Many studies are neither purely qualitative nor quantitative. This is in line with Larsen-Freeman and Long (1991), who described these two terms as two ends of a continuum that have different data- collecting procedures along with different degrees of subjectivity in interpreting data. Sampling paradigms also help distinguish between the two. Quantitative research frequently uses sample strategies for generalizing findings to larger populations, whereas qualitative research works to uncover information from information-rich samples. Quantitative research has come mainly from the field of psychology, where there has been heavy emphasis on the use of statistics to make generalizations from samples to populations, thus the label quantitative methods. Most methods under qualitative research have originated with anthropologists and sociologists who rely heavily on verbal description rather than numbers. Consequently, quantitative research is characterized by the use of numbers to represent its data, and qualitative research is characterized by verbal descriptions as its data.
, who described these two terms as two ends of a continuum that have different data- collecting procedures along with different degrees of subjectivity in interpreting data. Sampling paradigms also help distinguish between the two. Quantitative research frequently uses sample strategies for generalizing findings to larger populations, whereas qualitative research works to uncover information from information-rich samples. Quantitative research has come mainly from the field of psychology, where there has been heavy emphasis on the use of statistics to make generalizations from samples to populations, thus the label quantitative methods. Most methods under qualitative research have originated with anthropologists and sociologists who rely heavily on verbal description rather than numbers. Consequently, quantitative research is characterized by the use of numbers to represent its data, and qualitative research is characterized by verbal descriptions as its data..")
41
Data are gathered: in natural settings, through concentrated contact over time, holistically—“systematic, encompassing, integrated,” from deep inside the situation with preconceived notions held in check. by the researcher who is the “main ‘measurement device,’ ” to analyze for patterns, comparisons, and contrasts with interpretations constrained by theoretical interests and/or “internal consistency,” and consisting mainly of verbal data. In other words, any study that is done in a real-life setting, involving intensive holistic data collection through observation at a close personal level without the influence of prior theory and contains mostly verbal analysis, could be classified as a qualitative study.

42
At the other end of this continuum is the quantitative research. Studies located toward this end might test hypotheses or only try to gather information. However, one thing that is characteristic of most quantitative studies is that they try to generalize the results to some target population. Often you will find studies that fall somewhere in the middle of the continuum. They land in between the two extremes depending on how much of each methodology they use. These are referred to as mixed-method approaches

43
The third independent continuum is labeled Exploratory–Confirmatory. The main characteristic of this continuum is whether a study is trying to find evidence to support (i.e., confirm) a hypothesis or explore some phenomena prior to the development of any hypothesis. TASK 1. Find a recent study that interests you. 2. Plot the study on the three different continua based on your perusal of the study. 3. Provide a rationale for each placement based on what you find in the study. Basic ________________________ Applied Exploratory ________________________ Confirmatory Qualitative ________________________ Quantitative
 a hypothesis or explore some phenomena prior to the development of any hypothesis. TASK 1. Find a recent study that interests you. 2. Plot the study on the three different continua based on your perusal of the study. 3. Provide a rationale for each placement based on what you find in the study. Basic ________________________ Applied Exploratory ________________________ Confirmatory Qualitative ________________________ Quantitative.")
44
A more useful way to understand research designs is by organizing them around the type of research question under investigation. The two generic questions found in research literature center around What and Why. The variable(s) suspected of causing variation in another variable(s) is the independent variable(s). The variable(s) being influenced by the independent variable(s) is the dependent variable(s). Sometimes the intent of the researcher is made clear in the title of a study and the variables are easily identified. Kobayashi (2002) expressly stated in her title, “Method Effects on Reading Comprehension Test Performance: Text Organization and Response Format,” that she is exploring a causal relationship. From this title she informs the reader that she is examining whether text organization and response format influence examinees’ performance on tests of reading comprehension. terms in their titles such as impact, influence, improve, change, role of. The study just mentioned (Kobayashi, 2002) has two independent variables (text organization and response format) and one dependent variable (reading comprehension).
 suspected of causing variation in another variable(s) is the independent variable(s). The variable(s) being influenced by the independent variable(s) is the dependent variable(s). Sometimes the intent of the researcher is made clear in the title of a study and the variables are easily identified. Kobayashi (2002) expressly stated in her title, Method Effects on Reading Comprehension Test Performance: Text Organization and Response Format, that she is exploring a causal relationship. From this title she informs the reader that she is examining whether text organization and response format influence examinees’ performance on tests of reading comprehension. terms in their titles such as impact, influence, improve, change, role of. The study just mentioned (Kobayashi, 2002) has two independent variables (text organization and response format) and one dependent variable (reading comprehension)..")
45
Once researchers determine the research design, they need to decide exactly The value of a data- gathering procedure depends on how well it provides answers to the research questions. As a consumer, you should become familiar with as many of these procedures as possible so that you will not be limited in your search for answers to your questions. The underlying issues in proper data collection can make or break the value of a study. Two sections. The first provides a survey of the different methods by which data are collected and a discussion of the strengths and weaknesses of each. The second section summarizes the qualities needed to gather valid data.

46
A number of data- collection procedures that are commonly used in applied linguistic research are observational and instrumental procedures. Under these two headings, is listed either who or what is used to collect data.

47
Method Potential Strengths Potential Weaknesses Observational procedures Discover new phenomena, flexible Time-consuming, observer effects Self Firsthand information, inner thoughts Possible bias Introspection Immediate access accesses inner states Intrusive, difficult to validate Retrospection Not intrusive Memory loss Outside observer Full participant Elicits natural behavior, not intrusive Possible bias, deceptive, memory loss Partial participant Not deceptive Possible bias Nonparticipant Objective Disruptive Interviewer to probe, monitors comprehension, 100% feedback Needs training, standardization, handling data

48
Judges/raters Expert opinion Subjectivity, fatigue, halo effect, ambiguous rubrics Instrumental procedures Large coverage, time efficient Inflexible Questionnaires Closed form Objective, broad coverage, easy to interpret Restrictive, low returns Open-ended Information revealing Subjective Tests Discrete item Objective scoring, broad coverage, easy to score Guessing, difficult to construct Constructed response Allows for individuality, limits guessing Limited coverage, subjective scoring, training of scorers

49
THE PROCEDURES The procedures under this heading involve capturing data through visual observation. The use of human observers as data collectors is as old as research. It has long been known that the main advantage of human observation of data, over some form of impersonal instrument, is that the former allows the researcher flexibility when exploring what new, and sometimes unexpected, phenomena might be uncovered. Most everyone would agree that observational procedures are powerful means for gathering data. FORMATS. First, the one doing the observing can vary considerably. Observers can consist of a researcher, someone employed to make the observation, or the subject observing him or herself. Second, observers might be very involved with the purpose of the study or totally oblivious to why they are being asked to observe. Third, observers might be recording information that requires no interpretation of the observations or be required to give their own evaluative judgments as to what their observations mean. Fourth, the observation process may or may not be backed up with recording devices. Researchers often use recording devices (audio or video) to aid in further analysis.
 to aid in further analysis..")
50
SELF AS OBSERVER. Using participants as observers of their own behavior has become more common over the past years under the heading of protocol analysis (cf. chap. 5), although it was commonly used by psychologists before 1940 (Slezak, 2002). This procedure requires participants to observe their own internal cognitive (or emotional) states and/or processing strategies either during an ongoing task, referred to as introspection, or after they have completed the task, known as retrospection. EXAMPLE Researchers usually record participants’ thoughts on audiotape during a think-aloud task, as mentioned in chapter 5. To illustrate, Kerry did a study where he asked participants to identify what strategies they were using to decode new vocabulary in a reading passage. We recorded their introspections during the reading process by audiotape recorder and analyzed the transcribed data later (Perry, Boraie, Kassabgy, & Kassabgy, 2001
, although it was commonly used by psychologists before 1940 (Slezak, 2002). This procedure requires participants to observe their own internal cognitive (or emotional) states and/or processing strategies either during an ongoing task, referred to as introspection, or after they have completed the task, known as retrospection. EXAMPLE Researchers usually record participants’ thoughts on audiotape during a think-aloud task, as mentioned in chapter 5. To illustrate, Kerry did a study where he asked participants to identify what strategies they were using to decode new vocabulary in a reading passage. We recorded their introspections during the reading process by audiotape recorder and analyzed the transcribed data later (Perry, Boraie, Kassabgy, & Kassabgy,")
51
The researchers purposely used three introspective techniques to take advantage of the strengths of each and, at the same time, control for their weaknesses. First, they trained the participants on using the think-aloud procedure. Next, they had the participants read the target text and complete eight vocabulary tasks. During the tasks, the participants were to verbalize what they were thinking and doing. Immediately after completing each task, the participants were individually asked to retrospect on the strategy they used (i.e., immediate retrospection). After all the tasks were finished, the participants were interviewed regarding the exercises and their use for learning vocabulary (i.e., delayed retrospection). All output by the participants was audio recorded and transcribed for analysis
. After all the tasks were finished, the participants were interviewed regarding the exercises and their use for learning vocabulary (i.e., delayed retrospection). All output by the participants was audio recorded and transcribed for analysis.")
52
Outside Observers. The more traditional form of the observational procedure is found in research that uses people other than the participants to make observations. Whereas the self-observer is the best source to try to access the inner workings of the mind, the outside observer is better used for observing the outward behavior of the participants under study. However, the outside observer varies in how close (i.e., personally involved) s/he gets to the people or events that s/he is observing and how aware the people being observed are that they are being observed. The closer the observer gets and/or more aware the observed person is, the more the observer participates in who or what is being observed. Technically, the continuum ranges from full to nonparticipant observer (cf. Table6.1).
 s/he gets to the people or events that s/he is observing and how aware the people being observed are that they are being observed. The closer the observer gets and/or more aware the observed person is, the more the observer participates in who or what is being observed. Technically, the continuum ranges from full to nonparticipant observer (cf. Table6.1)..")
53
FULL PARTICIPANT OBSERVER The full-participant observer is one who is or becomes a full member of the group to which the participants/events being observed belong. This is a procedure commonly used to observe a group/event with someone who is either a member or pretending to be a member as an informant (i.e., a person who supplies the information). The group is usually unaware that it is being observed. ADVANTAGES/DISADVANTAGE The obvious advantage of using a full participant is that the other members of the group will behave naturally, thus providing a clear picture of the objective of the observation. The disadvantages are that (a) the observer may be so much a part of the group that s/he cannot remain objective in his or her observations, (b) the researcher(s) is using deception to obtain the data, and (c) the observer may forget information if he or she has to wait until after the encounter with the group before recording the data. In the case of disadvantage (a), limited and/or biased data may be reported bythe observer.
. The group is usually unaware that it is being observed. ADVANTAGES/DISADVANTAGE The obvious advantage of using a full participant is that the other members of the group will behave naturally, thus providing a clear picture of the objective of the observation. The disadvantages are that (a) the observer may be so much a part of the group that s/he cannot remain objective in his or her observations, (b) the researcher(s) is using deception to obtain the data, and (c) the observer may forget information if he or she has to wait until after the encounter with the group before recording the data. In the case of disadvantage (a), limited and/or biased data may be reported bythe observer..")
54
At the other end of the degrees of participation continuum is the nonparticipant observer who does not personally interact with the participants in any manner. The best use of this method is when the observer makes observations of participants’ outward behavior. For example, an observer may measure the amount of time a teacher talks versus the amount of time students talk in a language classroom. In this case, the observer has no need to interact with either the teacher or students to obtain these data. The principal advantage of this strategy is that it is more objective1 than the other participant methods. On the down side, the presence of an unknown observer, or any recording devices, may have a disruptive effect on the participants, causing them to deviate from their normal behavior. To avoid this, the observer needs to desensitize the participants to his or her presence before collecting the data to be used for the study. To do this, a common method is for the observer to attend the sessions long enough for the participants to disregard the observer’s presence.

55
PARTIAL PARTICIPANT Somewhere between the full- participant and nonparticipant observers lie varying degrees of partial-participant observation (cf. Table 6.1). The advantages are several over the nonparticipant observer. First, access to less obvious data, such as attitudes or intentions, is more available. Second, the closer the participant feels the observer is to him or her, the less the chance of falsifying the data. EXAMPLE To illustrate the use of a partial-participant observer, Harklau (2000)used this strategy with an ethnographic case study to investigate how student identities change when moving from one language program to another. She observed three ESL students over a 1-year period as they madethe transition from high school to a nearby community college.
. The advantages are several over the nonparticipant observer. First, access to less obvious data, such as attitudes or intentions, is more available. Second, the closer the participant feels the observer is to him or her, the less the chance of falsifying the data. EXAMPLE To illustrate the use of a partial-participant observer, Harklau (2000)used this strategy with an ethnographic case study to investigate how student identities change when moving from one language program to another. She observed three ESL students over a 1-year period as they madethe transition from high school to a nearby community college..")
56
Except for Viechnicki (1997), one thing common to the Atkinson and Ramanathan (1995), Spielmann and Radnofsky (2001), and Harklau (2000) studies is that the researchers did not limit themselves to only one procedure for gathering data. Rather, they all used a multi procedural approach, as referred to previously as triangulation. Researchers who want to protect their research from the weakness of only one approach, yet profit from the strengths of that approach, will build into their study several different data-collecting procedures.

57
Another type of observational technique to gather data in applied linguistics research is the use of judges/raters. Not only do judges observe the outward behavior of the participant(s), but they make evaluative judgments regarding the behavior. They do this by giving verbal explanations or using some form of rating scale that ranges from low to high, poor to excellent, and so on and may be expressed verbally or numerically. However, the challenge with using judges in research continues to be subjectivity, which is defined here as the influence of a judge’s particular preferences and beliefs that differ from the criteria that s/he is supposed to use when judging. The assumption should hold that when rating, the judges use the same criteria. To control for subjectivity, three precautions need to be taken: the use of a rubric, training, and multiple judges.
, but they make evaluative judgments regarding the behavior. They do this by giving verbal explanations or using some form of rating scale that ranges from low to high, poor to excellent, and so on and may be expressed verbally or numerically. However, the challenge with using judges in research continues to be subjectivity, which is defined here as the influence of a judge’s particular preferences and beliefs that differ from the criteria that s/he is supposed to use when judging. The assumption should hold that when rating, the judges use the same criteria. To control for subjectivity, three precautions need to be taken: the use of a rubric, training, and multiple judges..")
58
1. Find a recent study that used one of the observational techniques mentioned in the prior discussion. 2. State the research question. 3. State any hypotheses, predictions, or even expectations if they are present. 4. Describe the data being observed. 5. Summarize the observational procedure used in the study. 6. Describe what was done to avoid the potential weaknesses described in Table 6.1.

59
Two general instrument types that encompass a wide range of devices used to collect data: questionnaires and tests. Questionnaires. Questionnaires are surveys that can capture a lot of information in a short amount of time. They consist of lists of questions or statements presented on paper or through some other media such as computers.

60
Questionnaires are considered instrumental equivalents to interviews. They have two main advantages over interviews. First, they are useful for collecting data from larger numbers of people in fairly short amounts of time. Second, they are more economical to use than interviews because they do not take as much time or require trained interviewers to administer. The main disadvantage is that questionnaires are not flexible in comparison to interviews, in that the questions cannot be modified once they have been given to the respondent, nor can the questionnaire probe the respondent for further information. The items (i.e., questions or statements) in a questionnaire can be closed form or open form. Closed-form items provide a set of alternative answers to each item from which the respondent must select at least one. For example, a question might require a participant to choose either yes or no, agree or disagree. A statement might be given requiring participants to indicate their level of agreement on a 5-point scale. This scale is often referred to as a Likert scale, named after R. A. Likert, who used it for measuring attitude (Likert, 1932). The main advantage of using the closed form is that the data elicited are easy to record and analyze with statistical procedures.
 in a questionnaire can be closed form or open form. Closed-form items provide a set of alternative answers to each item from which the respondent must select at least one. For example, a question might require a participant to choose either yes or no, agree or disagree. A statement might be given requiring participants to indicate their level of agreement on a 5-point scale. This scale is often referred to as a Likert scale, named after R. A. Likert, who used it for measuring attitude (Likert, 1932). The main advantage of using the closed form is that the data elicited are easy to record and analyze with statistical procedures..")
61
Open-form items allow participants to give their own answers without restrictions. This type works best when there could be a wide variety of answers that participants might give to a question, such as “How old are you?” Another common use is when the researcher is exploring what possible answers might be given, as when asking participants what they think is good about the language program they have just completed. Typically, most questionnaires contain both open- and closed- form items. Demographic information about the respondent (e.g., gender, nationality, etc.) and the program (e.g., course level, etc.) uses both formats. Even when the rest of the items in the questionnaire are closed form, the last item is almost always open form to capture any other comment by the respondent.
 and the program (e.g., course level, etc.) uses both formats. Even when the rest of the items in the questionnaire are closed form, the last item is almost always open form to capture any other comment by the respondent..")
62
A well-prepared questionnaire should be pilot-tested before administered in the main study. That is, it is tried out on a group of people similar to the target group who will eventually get it. The resulting feedback can provide useful information to make sure that all the items are clearly understood and the entire questionnaire is user-friendly. The rule of thumb is that the researcher should get a response rate of at least 70% before the data are considered representative of a target population. A well written study should report the number of questionnaires sent out and the return rate to aid the reader in applying this criterion.

63
Tests, also popularly referred to as assessments, are the other main type of instrumentation commonly used in research. a test is an instrument designed to assess what participants can remember or do physically and/or mentally. Because a single test can do all three, depending on the test items that make up the test. Test items come in all formats and modalities. They can be administered via paper, computer, or face to face with an examiner. They can assess language abilities through observing outward behavior, as when testing oral proficiency via an oral interview, or they can assess cognitive outcomes through responses on paper or a computer screen.

64
The two most important qualities of any data-collection technique that have traditionally been considered essential are reliability and validity. Reliability has to do with the consistency of the data results. If we measure or observe something, we want the method used to give the same results no matter who or what takes the measurement or observations.

65
Trait accuracy, which corresponds with the construct validity, addresses the question as to how accurately the procedure measures the trait (i.e., construct) under investigation. The key issue is whether a measurement procedure appears to measure what it is supposed to measure. If language proficiency is defined as the summation of grammar and vocabulary knowledge, plus reading and listening comprehension, then an approach needs to be used that measures all of these components to accurately measure the trait as defined.

66
Task: Find a research study of interest in a recent journal related to applied linguistics. Do the following: 1. List the research question(s). 2. Look at the data-collection procedure used (i.e., tests, surveys, raters, observers, etc.). Does the procedure seem appropriate for answering the research question(s)? 3. What information was given relating to reliability? a. Type? b. Amount? c. How reliable was the procedure being used? 4. What facet of validity was examined? 5. How well did the procedure correspond to identifying the trait being measured in your opinion? 6. Did statements about validity correspond to evidence of reliability?
. 2. Look at the data-collection procedure used (i.e., tests, surveys, raters, observers, etc.). Does the procedure seem appropriate for answering the research question(s). 3. What information was given relating to reliability. a. Type. b. Amount. c. How reliable was the procedure being used. 4. What facet of validity was examined. 5. How well did the procedure correspond to identifying the trait being measured in your opinion. 6. Did statements about validity correspond to evidence of reliability .")
67
Understanding Research Results: Once researchers collect their data, they must determine whether the results answer their research questions. If they are “What” questions, the answers are in the form of information that (a) describes what variables are important, (b) identifies the context in which certain phenomena occur, and/or (c) uncovers important relationships between phenomena. If the questions are “Why” types, then the results attempt to explain the cause behind certain phenomena. In either case, the analysis of the data is presented verbally, numerically, or a combination of the two. You should be able to read Results sections of research articles with enough confidence to critically evaluate whether appropriate procedures have been used and correct interpretations have been made. Numerical Versus Verbal Data Some people think that numerical data are more scientific—and therefore more important—than verbal data because of the statistical analyses that can be performed on numerical data. Both types of data have their place, are equally important, and they both complement each other.
 describes what variables are important, (b) identifies the context in which certain phenomena occur, and/or (c) uncovers important relationships between phenomena. If the questions are Why types, then the results attempt to explain the cause behind certain phenomena. In either case, the analysis of the data is presented verbally, numerically, or a combination of the two. You should be able to read Results sections of research articles with enough confidence to critically evaluate whether appropriate procedures have been used and correct interpretations have been made. Numerical Versus Verbal Data Some people think that numerical data are more scientific—and therefore more important—than verbal data because of the statistical analyses that can be performed on numerical data. Both types of data have their place, are equally important, and they both complement each other..")
68
In almost all studies, all of the data that have been gathered are not presented in the research report. Whether verbal or numerical, the data presented have gone through some form of selection and reduction. What you see reported in a research journal are results of the raw data having been boiled down into manageable units for display to the public. Verbal data commonly appear as selections of excerpts, narratives, quotations from interviews, and so on, whereas numerical data are often condensed into tables of frequencies, averages, and so on.

69
Most of the credit in recent years for developing criteria for presenting and analyzing verbal data must go to researchers who have emphasized the use of qualitative research strategies. Presentation of verbal data and their analyses appear very much intertwined together in Results sections of research reports.

70
Analysis of verbal data is initiated at the beginning of the data-collection process and continues throughout the study. This process involves the researcher interacting with the data in a symbiotic fashion. Literally, the researcher becomes the “main ‘measurement device’ ” (Miles & Huberman, 1994, p. 7). Creswell (1998, ) likened data analysis to a “contour” in the form of a “data analysis spiral,” where the researcher engages the data, reflects, makes notes, reengages the data, organizes, codes, reduces the data, looks for relationships and themes, makes checks on the credibility of the emerging system, and eventually draw researcher conclusions. The researcher has at least five strategies to choose from to support the quality of the data and gain credibility - Representativeness, Prolonged engagement and persistent observation, freedom from bias, avoiding researcher effects, evaluating Patterns and Themes evaluating the strength of the data, data coming from a variety of sources (Triangulation), evaluating unexpected findings, negative evidence, peer review, replicating findings, rich, thick description which involves a detailed description of the participants, context, and all that goes on during the data-gathering and analysis stages. The purpose is to provide the reader of the study with enough information to decide whether the explanations and conclusions of the study are transferable to other similar situations. findings, and external audit.
. Creswell (1998, ) likened data analysis to a contour in the form of a data analysis spiral, where the researcher engages the data, reflects, makes notes, reengages the data, organizes, codes, reduces the data, looks for relationships and themes, makes checks on the credibility of the emerging system, and eventually draw researcher conclusions. The researcher has at least five strategies to choose from to support the quality of the data and gain credibility - Representativeness, Prolonged engagement and persistent observation, freedom from bias, avoiding researcher effects, evaluating Patterns and Themes evaluating the strength of the data, data coming from a variety of sources (Triangulation), evaluating unexpected findings, negative evidence, peer review, replicating findings, rich, thick description which involves a detailed description of the participants, context, and all that goes on during the data-gathering and analysis stages. The purpose is to provide the reader of the study with enough information to decide whether the explanations and conclusions of the study are transferable to other similar situations. findings, and external audit..")
71
Harklau’s ethnographic case study, in which she examined how the identities of ESL students change as a result of the representation (i.e., stereotype) of different institutional programs. She followed three ESL students over a 1-year period as they moved from their senior year of high school to their first year at a nearby 2- year community college. Summary of Harklau’s (2000) Study Variable of concern: Institutional representations of ESL learners. Participants 1 Turk 2 S.E. Asians Upper level/college-bound students Lived in U.S. 6 to 10 yrs. A teacher chose the student participants Teachers: no information given
 Study Variable of concern: Institutional representations of ESL learners. Participants 1 Turk 2 S.E. Asians Upper level/college-bound students Lived in U.S. 6 to 10 yrs. A teacher chose the student participants Teachers: no information given.")
72
Data Sources 30–50 min. taped interviews 50 formal interviews with students and instructors 25 informal interviews with instructors Informal visits with students 10 days of high school classroom observations 50 hours of CC classroom observations 5,000 pages of written materials collected over the year. Institutions The high school Ethnically mixed (60% Black, 30% White, 10% other) 45 out of 950 were in ESL program (predominantly S.E. Asian) The 2-year community college State-sponsored Commuter campus Over 13,000 student body ESL program 250 international students (predominantly S.E. Asian and Eastern European) Mainly coming from socially and educationally privileged backgrounds Mostly new arrivals to the States Course content: language + acculturation
 45 out of 950 were in ESL program (predominantly S.E. Asian) The 2-year community college State-sponsored Commuter campus Over 13,000 student body ESL program 250 international students (predominantly S.E. Asian and Eastern European) Mainly coming from socially and educationally privileged backgrounds Mostly new arrivals to the States Course content: language + acculturation.")
73
Use a study that uses a qualitative research design. 1. Begin by stating what qualitative procedure was used by the researcher(s). 2. Use Table 7.1 to complete this exercise. Check which tactics the researcher( s) used. Where information is not available, leave blank. 3. Identify the tactics used by the researcher for evidence regarding the quality of data. 4. Identify the tactics used by the researcher to verify any proposed patterns or themes. 5. Identify any tactics used to add credibility to any proposed explanations and conclusions made by the researcher.
. 2. Use Table 7.1 to complete this exercise. Check which tactics the researcher( s) used. Where information is not available, leave blank. 3. Identify the tactics used by the researcher for evidence regarding the quality of data. 4. Identify the tactics used by the researcher to verify any proposed patterns or themes. 5. Identify any tactics used to add credibility to any proposed explanations and conclusions made by the researcher..")
74
Many researchers try to answer their research questions by first converting their ideas and constructs into some form of numerical data before analysis. The main reason is that numerical data are generally easier to work with than verbal data and it is easy to establish patterns and relationships. Numerical data are presented in some type of summarized form (i.e., descriptive statistics) and followed with the analysis in the form of inferential statistics. Statistics can be divided into two main categories: descriptive and inferential. As the name implies, descriptive statistics are those that describe a set of data. They are the fuel used by inferential statistics to generate answers to research questions. Inferential statistics not only produce answers in the forms of numbers, they also provide information that determines whether researchers can generalize their findings (i.e., the descriptive statistics) to a target population.
 and followed with the analysis in the form of inferential statistics. Statistics can be divided into two main categories: descriptive and inferential. As the name implies, descriptive statistics are those that describe a set of data. They are the fuel used by inferential statistics to generate answers to research questions. Inferential statistics not only produce answers in the forms of numbers, they also provide information that determines whether researchers can generalize their findings (i.e., the descriptive statistics) to a target population..")
75
Statistic is used to describe average. There are three: mean, median, and mode Briefly defined, the mean is computed by adding up all the scores and dividing by the total number of scores. The median is the middle point in the distribution of data that divides the number of people in half. The mode is the most frequent score. However, for research purposes, the mean is the most common estimate of average used by researchers for numerical data.

76
In essence, inferential statistics procedures can be boiled down to answering two types of questions: are there relationships between variables or are there differences between groups of data? The null hypothesis, as the word null suggests, states that there is either no relationship or that there is no difference between groups. Statistical significance is the probability of making a Type I error either equal to or less than 5% (i.e., p.05). Statistical significance is directly related to the size of the sample. If the sample size is fairly large, then small relationships or small differences may come out to be statistically significant. When the sample size is smaller, the same statistical value found for a relationship or a difference will not be statistically significant.
. Statistical significance is directly related to the size of the sample. If the sample size is fairly large, then small relationships or small differences may come out to be statistically significant. When the sample size is smaller, the same statistical value found for a relationship or a difference will not be statistically significant..")
77
Inferential statistics can be divided into two general categories: nonparametric and parametric. Nonparametric statistics are used for analyzing data in the form of frequencies, ranked data,8 and data that do not approximate a normal distribution. Parametric statistics are used for any data that do not stray too far from a normal distribution and typically involve the use of means and standard deviations. Scores on tests and surveys usually fit these criteria. LINGUISTICS:Under the relationships/nonparametric heading there are two procedures that are frequently seen in published research: chi- square and Spearman rank correlation (rho). The Pearson chi-square (pronounced Ky-square and portrayed with the Greek symbol, 2) is the procedure of preference when dealing with data in the form of frequencies. Spearman rank-order correlation coefficient, also known as the Spearman rho correlation coefficient analyzes data in the form of ranks.
. The Pearson chi-square (pronounced Ky-square and portrayed with the Greek symbol, 2) is the procedure of preference when dealing with data in the form of frequencies. Spearman rank-order correlation coefficient, also known as the Spearman rho correlation coefficient analyzes data in the form of ranks..")
78
The final section of a research article is the Discussion/Conclusion. This is where researchers interpret their findings, make practical applications, and try to fit them into the big picture to answer their research questions. Therefore, second to the abstract at the beginning of the study, this section is the most read part of the average study. It is important to discern whether researchers are making valid interpretations and conclusions based on their data, and whether appropriate applications are being suggested. Researchers vary in the format they use to wrap up their studies. Some only have a Discussion section, whereas others have both Discussion and Conclusion sections. You might also see additional subheadings, such as Summary and/or Implications. Some attach their Discussion section to their Results section, labeled something like Results and Discussion followed by a final Conclusion.

79
Regardless of the format they use, they usually include the following components in the Discussion/Conclusion section of their paper: An overview of the study: The purpose of the study is restated, the questions under investigation are summarized, and any propounded hypotheses are reiterated. Overview of the findings: The researcher should show how the findings address the research question and/or support or fail to support any hypothesis being proposed. Relation of findings: The researcher should relate the findings of his or her study to previous research findings and theoretical thinking. Attention to limitations: The researcher should evaluate his or her own study and point out any weaknesses and/or limitations regarding the study. Possible applications: The researcher should suggest in his or her conclusions how the results can be applied to practical situations. Future possibilities: The researcher should suggest topics for future research

80
1. Do the findings logically answer the research questions or support the research hypothesis? 2. Does the nature of the study remain consistent from beginning to end? 3. Are the findings generalized to the correct population or situation? If the same findings are repeated using different samples from the target population, then we can have more assurance that we are on the right track.

81
Are the findings consistent with the research designs used? Are the findings and conclusions related to theory or previous research? Are any limitations of the study made clear? Is there consistency between the findings and the applications?

82
Use one of the recent studies you have used in previous exercises. 2. Assess the Discussion/Conclusion section of the study by answering the following questions. Provide a quick rationale for each answer. a. State the research question and/or any hypothesis. b. Do the findings logically answer the research questions or support the research hypothesis? c. Does the nature of the study remain consistent from beginning to end? d. Are the findings generalized to the correct population? e. Are the conclusions consistent to the type of research design? f. Are the findings and conclusions related to theory for previous research? g. Are any limitations made clear regarding the study? h. Is there consistency between the findings and applications?

83
You are now ready to complete a review of the research literature that focuses on some topic in which you are interested. Doing a literature review will give you an overview of the different kinds of methodologies, instruments for collecting data, and ways in which to analyze data commonly used in the research for a given area. The first place to begin is searching for studies using preliminary sources. Your goal is to access firsthand research studies (i.e., primary studies) that relate to your questions. How many studies you include depends on the nature of your question(s). If you want to do an exhaustive literature review, you will want to cover as many studies as you can find. However, most people want to put some limitations on their literature review, such as time constraints and/or only journal articles, to confine their search to studies with only certain characteristics.
 that relate to your questions. How many studies you include depends on the nature of your question(s). If you want to do an exhaustive literature review, you will want to cover as many studies as you can find. However, most people want to put some limitations on their literature review, such as time constraints and/or only journal articles, to confine their search to studies with only certain characteristics..")
84
Look for eight things when summarizing the main body of the study. They are as follows: 1. The focus of the study: What area and/or issue is being studied? 2. The research question(s) being asked. 3. The hypothesis(es) being tested (if any). 4. The size of the sample and important characteristics such as age and gender. Note here how the sample was chosen or assigned to the study, whether randomly or by some other procedure. 5. The variables in the study such as: a. Observational b. Independent c. Dependent d. Moderating 6. The procedures followed, including any materials, test instruments, or observational techniques. 7. The overall findings of the study. 8. The conclusion(s) that the researcher draws from the findings. In addition you will want to add: 9. Any other observations you have made that pertain to your interests. 10. Any concerns you have with the study that you want to point out in your review.
 being asked. 3. The hypothesis(es) being tested (if any). 4. The size of the sample and important characteristics such as age and gender. Note here how the sample was chosen or assigned to the study, whether randomly or by some other procedure. 5. The variables in the study such as: a. Observational b. Independent c. Dependent d. Moderating 6. The procedures followed, including any materials, test instruments, or observational techniques. 7. The overall findings of the study. 8. The conclusion(s) that the researcher draws from the findings. In addition you will want to add: 9. Any other observations you have made that pertain to your interests. 10. Any concerns you have with the study that you want to point out in your review..")
Similar presentations