Download presentation
Presentation is loading. Please wait.

1
NOTE: To change the image on this slide, select the picture and delete it. Then click the Pictures icon in the placeholder to insert your own image. Savings and Investment Analysis for China between 1989-2012 Emre Tumer

2
Introduction Chinese economy is on the top of the Savings list in the world with %51 of its GDP (2013, World Bank), which is %40 more than of the 1990’s. This rate is %19.7 in United States, and the gross domestic savings rate is %16 of its GDP. China went through revolutionary economic changes during the 1990’s, which has triggered this massive expansion. During this expansion and globalization era, China has developed a huge current account surplus, corresponding to %10 of its GDP in 2007, which has later on decreased to %2, in 2013. It is important to understand the components of this growth because this extraordinary expansion has caused many effects worldwide, and China became the growth engine of the world today.

3
Introduction One of the most important topic in that area is the puzzling high saving rates, which are also considered as excessive savings, or as forced savings. As savings rates tend to rise, productive investment opportunities tends to decline, speculative assets become more important and economy becomes more unstable, which is usually followed by a crisis. It has been found that while 1997 crisis has caused structural breaks in saving- investment relationship, 2008 crisis did not have a significant effect on saving- investment dynamics in East Asia. That is why a crisis in China can have catastrophic effects for the rest of the world, especially after the 2008 crisis that has mostly effected Western Hemisphere of the World.

4
Two Views on Excessive Savings According to Keynes (1936, The General Theory of Employment, Interest and Money), "Saving and Investment are the determinates of the system, not the determinants”. But one can say, looking at the empirical data from the past developing countries that, savings have determined the investment levels. Also, another point of view came from the Eckaus, Richard S. (2014), it has been stated that the high savings rates in China has been forced in two Benthamite senses. Bentham’s first meaning is, taxes, which is used to finance the investment and they have made up more than half of the total savings. Bentham’s second sense is conduced savings, resulting from bank loans which is again used to finance the investment.
, it has been stated that the high savings rates in China has been forced in two Benthamite senses. Bentham’s first meaning is, taxes, which is used to finance the investment and they have made up more than half of the total savings. Bentham’s second sense is conduced savings, resulting from bank loans which is again used to finance the investment..")
5
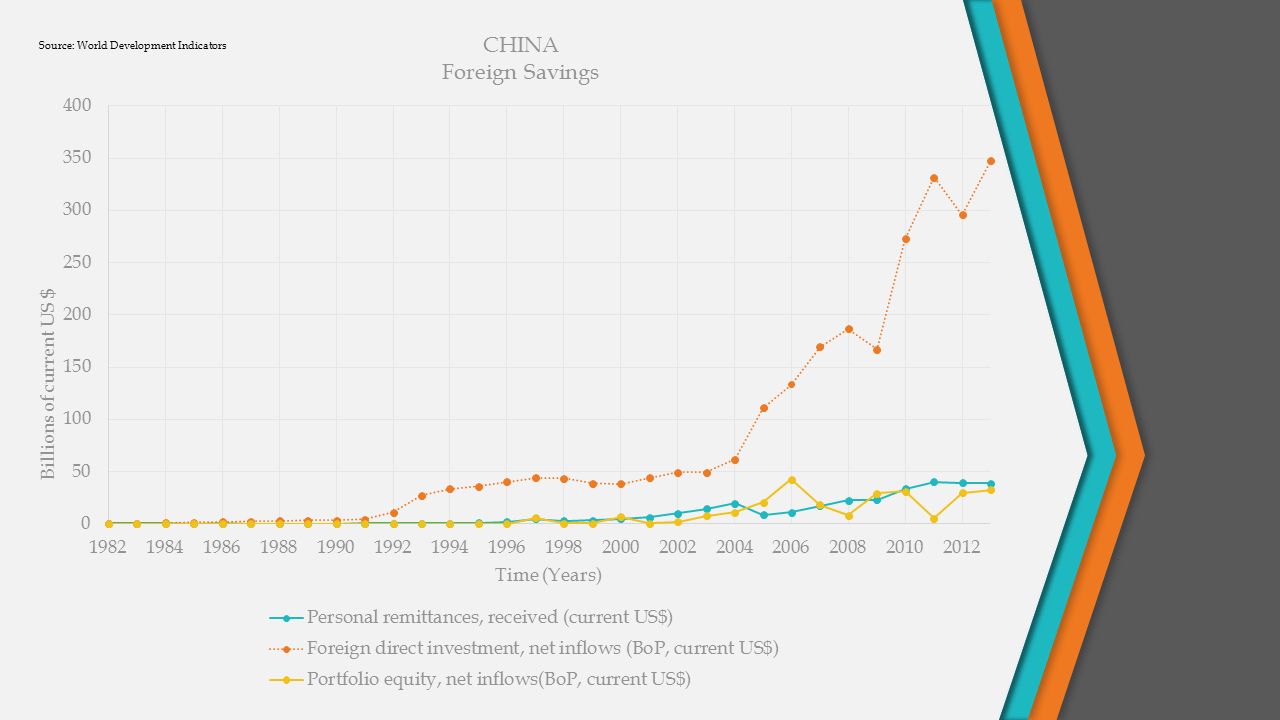
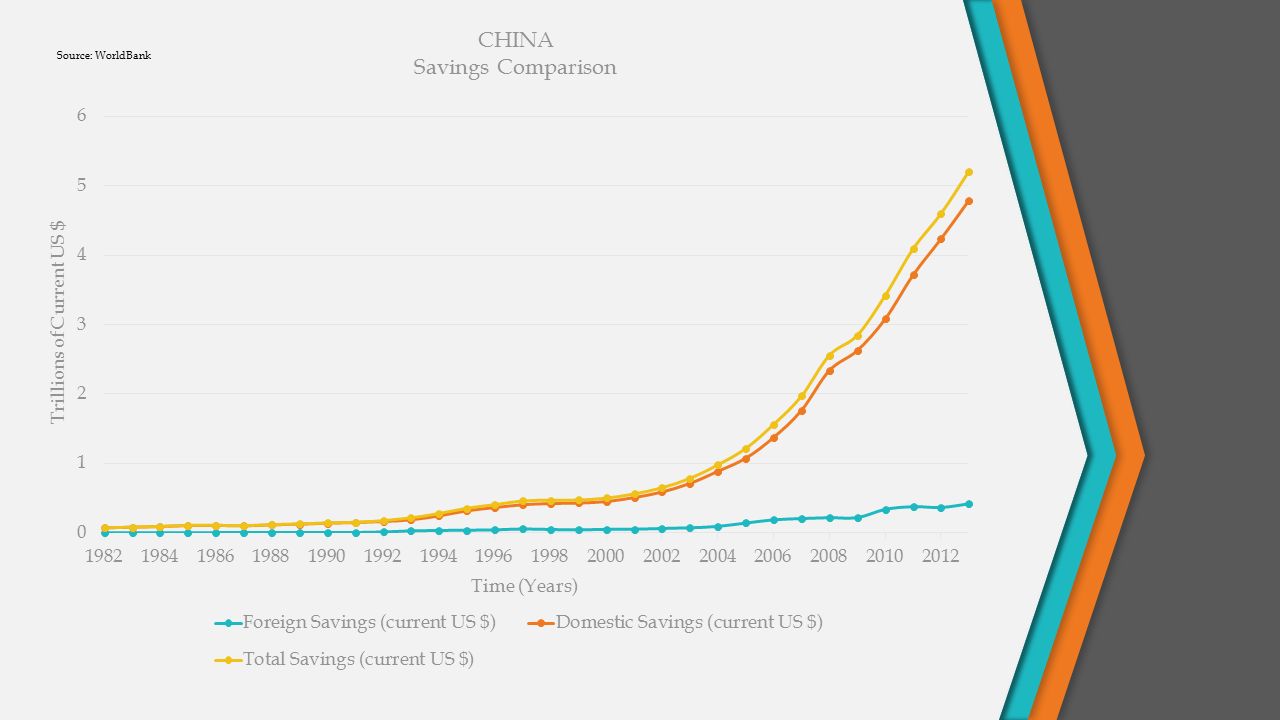
Theoretical framework of savings-investment relationship in an open economy When we look at the Keynesian Approach, we can say; S = Y – C C + I = C + S, therefore; I = S, after we include the government and taxes; I + G = S + T Now, in this equation, we will divide savings into two, as Domestic and Foreign Savings. I + G = Domestic S + Foreign S + T Domestic Savings = Government Savings + Private Savings + Domestic Firm Savings Foreign Savings = Foreign Direct Investment + Remittance Inflows + Portfolio Investments

10
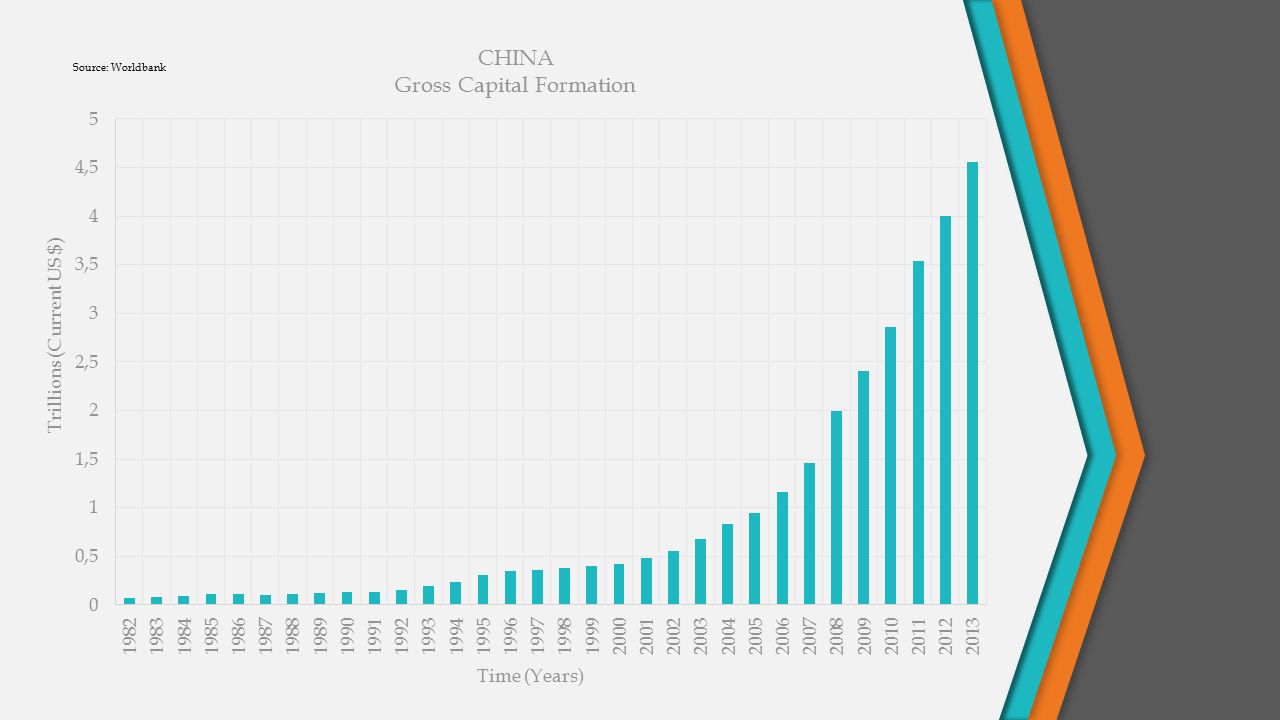
Methodology For savings and investment relationship, a linear regression model is widely used, and it’s known as the model of Feldstein and Harioka. The model of Feldstein and Horioka (1980) is; (I / Y) t = a + b * (S / Y) t Where; (I / Y) t = gross capital formation share as a percentage of GDP in year t (S / Y) t = savings share as a percentage of GDP in year t b = savings retention share in investments a = constant
 is; (I / Y) t = a + b * (S / Y) t Where; (I / Y) t = gross capital formation share as a percentage of GDP in year t (S / Y) t = savings share as a percentage of GDP in year t b = savings retention share in investments a = constant.")
11
Feldstein Harioka in other Researches In the paper of The Feldstein-Horioka Hypothesis in Countries with Varied Levels of Economic Development (Misztal, 2011), Feldstein Horioka Model has been applied to hundreds of countries and it has been proved that different countries show different results. For instance, emerging markets and developing economies show low Durbin Watson values, while advanced economies can show clear correlation between investment and saving. From the same paper, it has been found that the savings retention coefficient was calculated 0.57 in advanced economies and 0.22 in emerging economies, with VAR modeling. This shows capital mobility is relatively stronger in developing economies, compared to developed economies.

12
Empirical Results Dependent Variable: I/Y Method: Least Squares Variables CoefficientStd. ErrorT statisticProbability S/Y 0.4880980.1465263.3311430.0037 C 6.3740924.3112961.4784630.1566 LAG1I/Y 0.5883750.2252202.6124460.0176 LAG2I/Y -0.2684620.193449-1.3877630.1821 R Square : 0.842601Durbin Watson: 1.753684 Adj. R Square : 0.816368 F Statistic : 32.11966 The R square value is 0.842601, which means that % 84 of the savings share in GDP is explained by investments (gross capital formation) share in GDP. Also, same regression has been performed from the reverse to see if the correlation works both ways.
 share in GDP. Also, same regression has been performed from the reverse to see if the correlation works both ways..")
13
Empirical Results Dependent Variable: S/Y Method: Least Squares Variables CoefficientStd. ErrorT statisticProbability I/Y 0.3849010.1071403.5924920.0021 C -1.6683202.660086-0.6271680.5384 LAG1S/Y 1.0155000.1837165.5275510.0000 LAG2S/Y -0.3305340.160018-2.0656000.0536 R Square : 0.951153Durbin Watson: 1.363097 Adj. R Square : 0.943011 F Statistic : 116.8314 In this regression, the R square value is 0.951153, which means that % 95 of the investments (gross capital formation) share in GDP is explained by savings share in GDP.
 share in GDP is explained by savings share in GDP..")
14
Conclusion The analysis on this paper shows the relationship between savings and investment for China within the years of 1989-2012, and in which ways they effect each other. China has gone through a transformation in its economy, and came out stronger than ever, by 2015 economists started calling this new era as The Chinese Century. “The Chinese Century” started with changes in government economic policy, agricultural sector, and expanded to industry and service sector. By 2000, price regulation was abandoned except for energy sector. During this era, government enforced competition by laws, in order to make a strong internal market, while reducing tariffs and allowing FDI into the country. Movement to a freer economy has gained pace with China’s WTO membership, and led to further changes.

15
Conclusion Regulations restricting competition in sectors such as infrastructure has been abandoned. These reforms has helped China generate one of the highest rates of savings in the world economy, which leads to a rapid increase in capital stock. Also, with high investment rates, society has transformed into more of an urban society. The integration of savings and investments have been made clear with the analysis's on this paper. However, balance of excessive savings rates and consumption are becoming an issue for the new, important part of this world economy locomotive. With the slowing in growth rates, indicators of imbalances are started to show, and slowing of China means the slowing of the World with today’s integrated supply and trade chain.

16
Conclusion Even though absolute poverty is reduced, income inequality is still a problem. Increased public spending has helped to reduce some of the inequalities. Even though programs such as reduced taxation, and other tools are used to boosting incomes, a fiscal reform needs to be implemented in order to reduce the gaps between expenditure and revenues in poorer parts of the country. Urbanization movement needs to be closely managed, as there are already ghost cities occurring, which means unnecessary, waste of investments. Also, with urbanization and massive industrialization, pollution is a big problem in China as well. Pollution has a significant welfare impact on China’s GDP, which can be reduced with reforms. China’s economic transformation has been impressive, but there are still some problems to solve. China can overcome these problems the way it transformed into today’s country, with the continuation of momentum of the reforms.

17
References

Similar presentations


>")


>")

