Download presentation
Presentation is loading. Please wait.

1
Chapter 7: Atmospheric Circulations
Scales of atmospheric motions Eddies - big and small Local wind systems Global winds Global wind patterns and the oceans

2
Scales of Atmospheric Motions
Microscale: meters - kilometers Mesoscale: km – a few hundred km synoptic scale: a few hundred km – a few thousand km planetary scale: a few thousand km and larger Q: what is the scale of atmospheric boundary layer turbulence? a) microscale, b) mesoscale, c) synoptic scale Q: what is the scale of weather fronts? Q: what is the scale of lake breeze over the Great Lakes Fig 7.1
 microscale, b) mesoscale, c) synoptic scale. Q: what is the scale of weather fronts Q: what is the scale of lake breeze over the Great Lakes. Fig 7.1.")
3
Figure 7.2: The scales of atmospheric motion with the phenomena’s average size and life span. (Because the actual size of certain features may vary, some of the features fall into more than one category.)
.")
4
Eddies - Big and Small eddy or turbulent eddy: caused by convection (heating or cooling), wind shear (or near surface wind), or waves Rotor: caused by mountain waves wind shear: change of wind speed or direction with height

5
Clear-air turbulence: caused by wind shear; important for aviation
Billow clouds: caused by mountain waves in a wind shear zone Figure 1: The formation of clear air turbulence (CAT) along a boundary of increasing wind speed shear. The view of wind is from the side, with a top layer of air moving over a layer below. Q: what could cause bumpy aircraft flight in the upper troposphere? a) clear-air turbulence, b) rotor, c) billow clouds
 along a boundary of increasing wind speed shear. The view of wind is from the side, with a top layer of air moving over a layer below. Q: what could cause bumpy aircraft flight in the upper troposphere a) clear-air turbulence, b) rotor, c) billow clouds.")
6
Local Wind Systems Thermal Circulations: warm air rises and cool air sinks Warm air leads to H in the air (i,e, pushing isobar up); Air moves from H to L; increases surface pressure (i.e., pushing near-surface isobar up) over cool place; Leads to circulation from cool place to warm place near surface Pay attention to the change of isobars with height
 over cool place; Leads to circulation from cool place to warm place near surface. Pay attention to the change of isobars with height.")
7
Sea and Land Breezes sea breeze: from sea to land
land breeze: land to sea sea breeze front: clouds Florida sea breezes Sea and land breezes also occur near the shores of large lakes, such as the Great Lakes Pay attention to the change of isobars with height Q: which is stronger in general? a) sea breeze, b) land breeze, c) the same
 sea breeze, b) land breeze, c) the same.")
8
Q: When do you expect to see the thunderstorm in summer in Florida?
a) 10am, b) noon, c) 3pm, d) 6pm Q: For the prevailing northeasterly wind over southern Florida, where does the strongest sea breeze occur in general ? a) Eastern coast of southern Florida, b) western coast, c) central part Figure 7.6: Typically, during the summer over Florida, converging sea breezes in the afternoon produce uplift that enhances thunderstorm development and rainfall. However, when westerly surface winds dominate and a ridge of high pressure forms over the area, thunderstorm activity diminishes, and dry conditions prevail.
 10am, b) noon, c) 3pm, d) 6pm. Q: For the prevailing northeasterly wind over southern Florida, where does the strongest sea breeze occur in general a) Eastern coast of southern Florida, b) western coast, c) central part. Figure 7.6: Typically, during the summer over Florida, converging sea breezes in the afternoon produce uplift that enhances thunderstorm development and rainfall. However, when westerly surface winds dominate and a ridge of high pressure forms over the area, thunderstorm activity diminishes, and dry conditions prevail.")
9
height Q: given the isobars as left, what is the near-surface wind direction? a) from A to B b) from B to A Q: During the day, if you stand on beach, what would be the wind direction due to sea breeze? a) from sea to beach b) from land to sea A B
 from sea to beach. b) from land to sea. A B.")
10
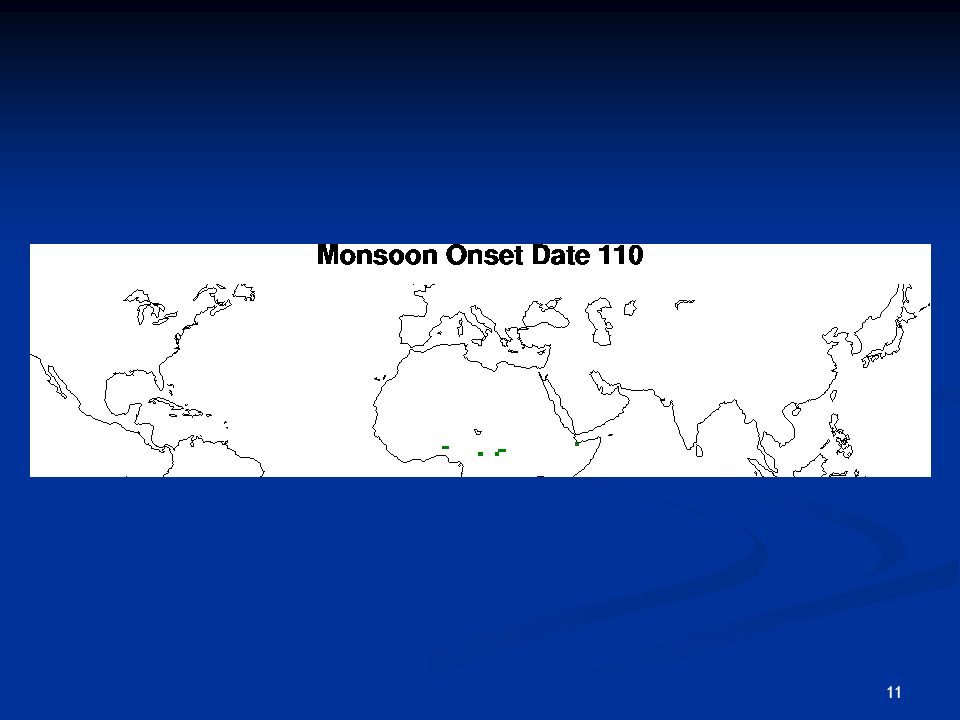
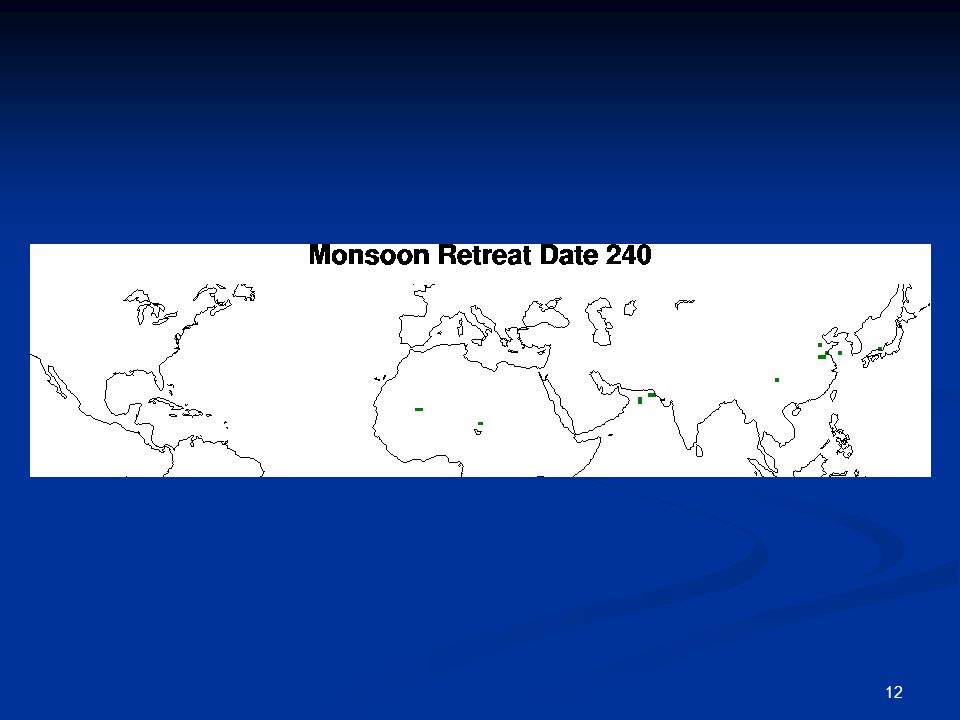
Seasonally Changing Winds - the Monsoon
Monsoon wind system: change with season India and eastern Asian monsoon Global monsoons Q: What are the differences and similarities between monsoon and sea/land breeze? A: Monsoon system is much greater in geographic area; changes with season; sea/land breeze changes with diurnal cycle; both due to horizontal temperature difference

13
North American monsoon
Q: Coriolis force is important for monsoon circulation. Is it as important for sea breeze as for monsoon? a) yes b) no Q: Still, is Coriolis force important for sea breeze? Figure 7.10: Enhanced infrared satellite image with heavy arrow showing strong monsoonal circulation. Moist, southernly winds are causing showers and thunderstorms (yellow and red areas) to form over the southwestern section of the United States during July, 2001.
 yes. b) no. Q: Still, is Coriolis. force important for sea. breeze Figure 7.10: Enhanced infrared satellite image with heavy arrow showing strong monsoonal circulation. Moist, southernly winds are causing showers and thunderstorms (yellow and red areas) to form over the southwestern section of the United States during July,")
14
Mountain and Valley Breezes
valley breeze: daytime; from valley to top mountain breeze: nighttime; from top to valley The nighttime mountain breeze is sometimes called gravity winds or drainage winds, because gravity causes the cold air to ‘drain’ downhill. Q: Which is stronger in general? a) valley breeze, b) mountain breeze, c) the same
 valley breeze, b) mountain breeze, c) the same.")
15
Katabatic Winds Strong drainage wind from cold elevated plateau down steep slope and/or narrow channel Katabatic winds are quite fierce in parts of Antarctica, with hurricane-force wind speeds. Bora: a cold, gusty northeasterly wind along the Adriatic coast in the former Yugoslavia Q: why is the air parcel temperature much warmer at bottom of the mountain in the figure?

16
Chinook (Foehn) Winds Chinook winds: one type of drainage wind; warm and dry wind down the eastern slope of the Rocky Mountains It is called a Foehn along the leeward slopes of Alps. Q: Which wind is weakest in general? a) drainage wind, b) katabatic wind, c) Chinook wind
 drainage wind, b) katabatic wind, c) Chinook wind.")
17
Chinook wall cloud indicates that chinook is coming
Figure 7.14: A chinook wind can be enhanced when clouds form on the mountain’s windward side. Heat added and moisture lost on the upwind side produce warmer and drier air on the downwind side.

18
Santa Ana Winds Santa Ana wind: warm, dry wind from the elevated desert plateau down to southern California compressional heating Could have very strong wind wildfires Q: which wind comes from elevated desert plateau? a) Chinook wind; b) Santa Ana wind; c) Katabatic wind; d) mountain breeze Q: The drainage wind over the lee side of the Rocky Mountain is
 Chinook wind; b) Santa Ana wind; c) Katabatic wind; d) mountain breeze. Q: The drainage wind over the lee side of the Rocky Mountain is.")
19
Desert Winds dust and sand storms: occurs over arid and semiarid regions dust devils – from surface; usually with a diameter of a few meters and a height of <100 m Q: What is the difference between tornado and dust devil? A: Tornado is larger horizontally and deeper vertically; from cloud base down

20
Haboob: A spectacular example of duststorm caused by thunderstorm downdraft; tens of kilometers horizontally and hundreds of meters vertically

21
Q: give a phenomenon and its typical temporal/spatial scales for each scale (micro, meso, synoptic, global) Q: What is the direction of sea breeze? What is the formation mechanism? Q: what wind would produce clouds? a) valley breeze, b) mountain breeze Q: Indian summer monsoon brings rainfall to India. The winter monsoon is a) wet, b) dry Q: Suppose you are fishing in a mountain stream in the early morning. The Wind is more likely blowing a) upstream, b) downstream
 valley breeze, b) mountain breeze. Q: Indian summer monsoon brings rainfall to India. The winter monsoon is a) wet, b) dry. Q: Suppose you are fishing in a mountain stream in the early morning. The Wind is more likely blowing. a) upstream, b) downstream.")
22
General Circulation of the Atmosphere
cause: unequal net heating of the earth’s surface and atmosphere effect: atmospheric circulation and ocean currents to transport heat from the equator to the poles Fig on p. 46

23
Single-cell Model basic assumptions: no rotation
Originally proposed by George Hadley in England in the 18th Century Hadley cell Q: Why is the single-cell model wrong? A: Because single cell does not exist due to earth’s rotation UK’s Hadley Centre for Climate Research is named after George Hadley.

24
Three-cell Model model for a rotating earth; overall realistic for surface fields

25
Three-cell Model realistic over the tropics in winter hemisphere:
Hadley cell; doldrums; subtropical highs trade winds; intertropical convergence zone (ITCZ) Over mid- and high latitudes: Ferrel cell and polar cell do not play major roles; westerlies in the upper troposphere; polar front; polar near-surface easterlies Q: if near-surface wind is southwesterly over NH midlatitudes, what is the direction of upper troposphere wind? a) westerly, b) easterly, c) southerly, d) northerly
 Over mid- and high latitudes: Ferrel cell and polar cell do not play major roles; westerlies in the upper troposphere; polar front; polar near-surface easterlies. Q: if near-surface wind is southwesterly over NH midlatitudes, what is the direction of upper troposphere wind a) westerly, b) easterly, c) southerly, d) northerly.")
26
Average Surface Winds and Pressure: The Real World
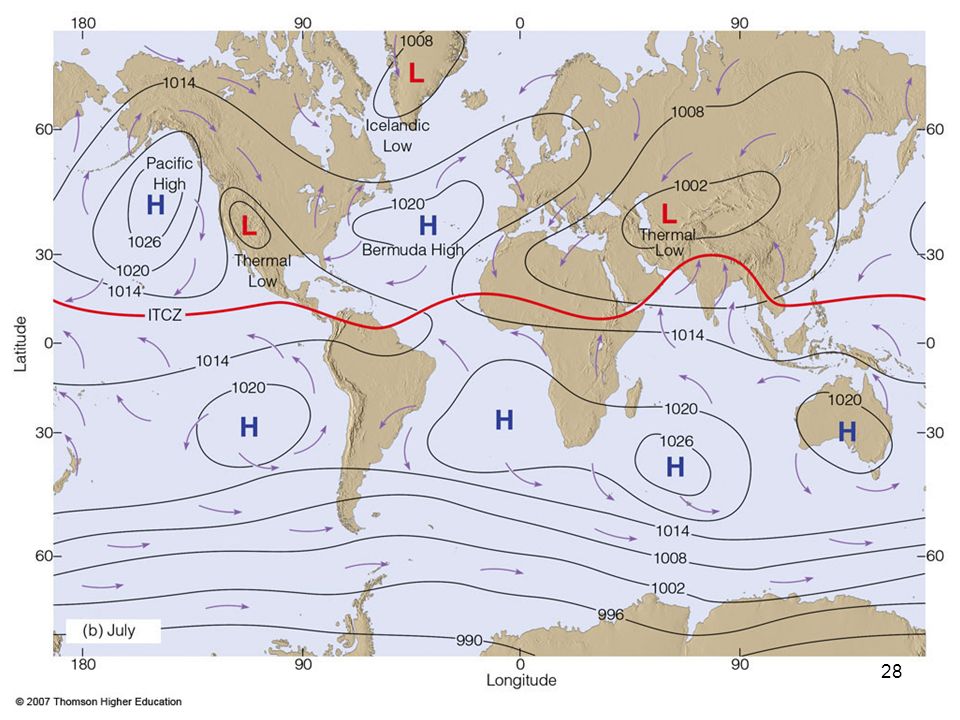
semipermanent highs: Bermuda high & Pacific high Pacific high moves north in summer; Bermuda high moves west in summer Semipermanent low: Icelandic low it moves north in summer Siberian high in winter due to very cold air Aleutian low in winter due to storm track ITCZ stays in the warm hemisphere (e.g., NH in July) There are three semipermanent highs in SH
 There are three semipermanent highs in SH.")
27
Figure 7.22: Average sea-level pressure distribution and surface wind-flow patterns for January (a) and for July (b). The heavy dashed line represents the position of the ITCZ.

29
The General Circulation and Precipitation Patterns
Most of the world’s thunderstorms are found along the ITCZ. Low rainfall over the subtropical regions Fronts and precipitation over the subpolar lows Q: which is correct? a) desert causes subtropical high; b) subtropical high causes desert
 desert causes subtropical high; b) subtropical high causes desert.")
30
Q: Why is Los Angeles dry in summer, while Atlanta is wet?

31
Westerly Winds and the Jet Stream
jet streams subtropical jet stream polar front jet stream Low-level jet stream over the Central plains of the U.S. (within 2 km above surface), bringing moist and warm air to form nighttime thunderstorms
, bringing moist. and warm air to form. nighttime thunderstorms.")
33
(warm) Gulf Stream; (warm) Kuroshio Current;
(cold) California Current; (cold) Canary Current; Equatorial Current and Counter Current in the Pacific Global wind drives ocean current Q: These ocean circulations are consistent with wind of a) high pressure system; b) low pressure system Figure 7.29: Average position and extent of the major surface ocean currents. Cold currents are shown in blue; warm currents are shown in red. Fig. 7-29, p. 193
 California Current; (cold) Canary Current; Equatorial Current and Counter Current in the Pacific. Global wind drives. ocean current. Q: These ocean. circulations are. consistent with. wind of. a) high pressure. system; b) low pressure. system. Figure 7.29: Average position and extent of the major surface ocean currents. Cold currents are shown in blue; warm currents are shown in red. Fig. 7-29, p")
34
Winds and Upwelling Upwelling is strongest when wind is parallel to the coastline Q: Why is ocean coldest in northern California in the left figure? A: wind is parallel to the coastline; upwelling is strongest; cold deep water is brought to surface

35
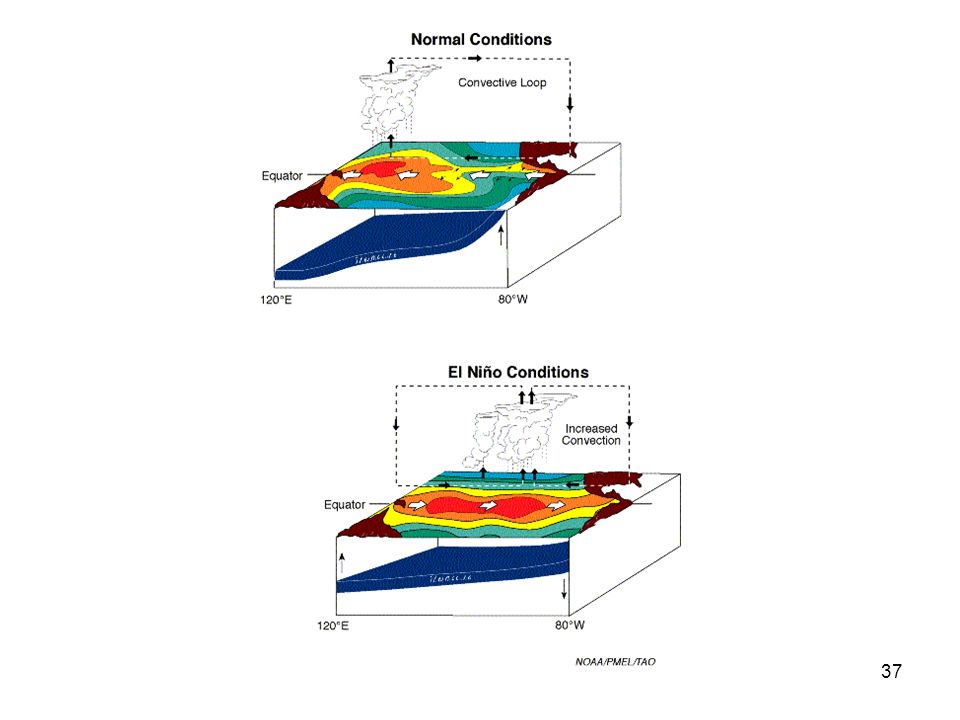
El Niño and the Southern Oscillation
Q: what is the El Niño? A: warming, pressure decrease, and weakened upwelling over the central and eastern Pacific; trade wind weakened as well; (cooling, pressure increase over western Pacific) La Niña: opposite Q: What is the Southern Oscillation (SO)? A: oscillation of surface pressure over tropical western and eastern Pacific ENSO: El Nino and SO are closely related Q: What is teleconnections? A: local changes (e.g., in sea surface temperature) affect weather in remote regions. SST animation:
 La Niña: opposite. Q: What is the Southern Oscillation (SO) A: oscillation of surface pressure over tropical western and eastern Pacific. ENSO: El Nino and SO are closely related. Q: What is teleconnections A: local changes (e.g., in sea surface temperature) affect weather in remote regions. SST animation:")
36
Thermocline is incorrect in bottom panel
Figure 7.32: In diagram (a), under ordinary conditions higher pressure over the southeastern Pacific and lower pressure near Indonesia produce easterly trade winds along the equator. These winds promote upwelling and cooler ocean water in the eastern Pacific, while warmer water prevails in the western Pacific. The trades are part of a circulation (called the Walker circulation) that typically finds rising air and heavy rain over the western Pacific and sinking air and generally dry weather over the eastern Pacific. When the trades are exceptionally strong, water along the equator in the eastern Pacific becomes quite cool. This cool event is called La Niña. During El Niño conditions—diagram (b)—atmospheric pressure decreases over the eastern Pacific and rises over the western Pacific. This change in pressure causes the trades to weaken or reverse direction. This situation enhances the countercurrent that carries warm water from the west over a vast region of the eastern tropical Pacific. The thermocline, which separates the warm water of the upper ocean from the cold water below, changes as the ocean conditions change from non-El Niño to El Niño.
, under ordinary conditions higher pressure over the southeastern Pacific and lower pressure near Indonesia produce easterly trade winds along the equator. These winds promote upwelling and cooler ocean water in the eastern Pacific, while warmer water prevails in the western Pacific. The trades are part of a circulation (called the Walker circulation) that typically finds rising air and heavy rain over the western Pacific and sinking air and generally dry weather over the eastern Pacific. When the trades are exceptionally strong, water along the equator in the eastern Pacific becomes quite cool. This cool event is called La Niña. During El Niño conditions—diagram (b)—atmospheric pressure decreases over the eastern Pacific and rises over the western Pacific. This change in pressure causes the trades to weaken or reverse direction. This situation enhances the countercurrent that carries warm water from the west over a vast region of the eastern tropical Pacific. The thermocline, which separates the warm water of the upper ocean from the cold water below, changes as the ocean conditions change from non-El Niño to El Niño.")
38
ENSO is an example of a global-scale weather phenomenon.
Q: What is the El Nino effect on winter weather in the U.S.? A: Northwestern U.S. usually has a warmer winter, Southeast usualy has a wetter winter, and often Arizona has a wetter winter El Nino effect

39
Other Atmosphere-Ocean Interactions
North Atlantic Oscillation (NAO): based on pressure difference between Bermuda and Iceland Arctic Oscillation (AO): pressure difference between about 45oN and Arctic; describes the same phenomenon in a similar way as NAO. Positive (negative) phase: stronger (weaker) zonal wind
: based on pressure difference between Bermuda and Iceland. Arctic Oscillation (AO): pressure difference between about 45oN and Arctic; describes the same phenomenon in a similar way as NAO. Positive (negative) phase: stronger (weaker) zonal wind.")
40
Over midlatitude Pacific, PDO pattern is different from ENSO;
Pacific Decadal Oscillation: Pacific surface temperature pattern changes every years; Over the tropical Pacific, PDO pattern is not very different from ENSO; Over midlatitude Pacific, PDO pattern is different from ENSO; Positive (negative) phase: warmer (cooler) surface water along the west coast of North America; Amplitude is smaller than ENSO Figure 7.36: Typical winter sea surface temperature departure from normal in °C during the Pacific Decadal Oscillation’s warm phase (a) and cool phase (b). (Source: JISAO, University of Washington, obtained via Used with permission of N. Mantua.)
 phase: warmer (cooler) surface water along the west coast of North America; Amplitude is smaller than ENSO. Figure 7.36: Typical winter sea surface temperature departure from normal in °C during the Pacific Decadal Oscillation’s warm phase (a) and cool phase (b). (Source: JISAO, University of Washington, obtained via Used with permission of N. Mantua.)")
41
Q: Most U.S. is located in : a) westerly wind belt, b) easterly wind belt, c) southerly wind belt, d) northerly wind belt Q: Why do summers along the west coast of U.S. tend to be dry? Q: What coastal wind along the west coast of North America would produce strong upwelling? a) northerly, b) southerly, c) easterly, d) westerly Q: What is a major El Nino? Q: for the positive phase of NAO, a) Greenland is colder and northern Europe is milder, b) Greenland is milder and northern Europe is colder, c) Greenland and northern Europe are both colder, d) Greenland and northern Europe are both milder
 northerly, b) southerly, c) easterly, d) westerly. Q: What is a major El Nino Q: for the positive phase of NAO, a) Greenland is colder and northern Europe is milder, b) Greenland is milder and northern Europe is colder, c) Greenland and northern Europe are both colder, d) Greenland and northern Europe are both milder.")
Similar presentations