Download presentation
Presentation is loading. Please wait.

1
2006-2007 PLDS Online Database Presented by the Library Research Center on behalf of the Public Library Association ALA Annual Conference – Washington, D.C. – June 23, 2007

2
Public Library Data Service (PLDS) Annual public library survey sent to 1,600+ libraries each year in USA and Canada since 1988. Question topics include: General Library Information Financial Information Library Resource and Per Capita Measures Annual Use Figures Technology in Libraries Special rotating section

3
2006 and 2007 PLDS Surveys Reporting Libraries: 2007 – 904 total (USA: 883; Canada: 21) 2006 – 873 total (USA: 852; Canada: 21) Special Section: 2007 – Young Adult Services 2006 – Children’s Services
 2006 – 873 total (USA: 852; Canada: 21) Special Section: 2007 – Young Adult Services 2006 – Children’s Services")
4
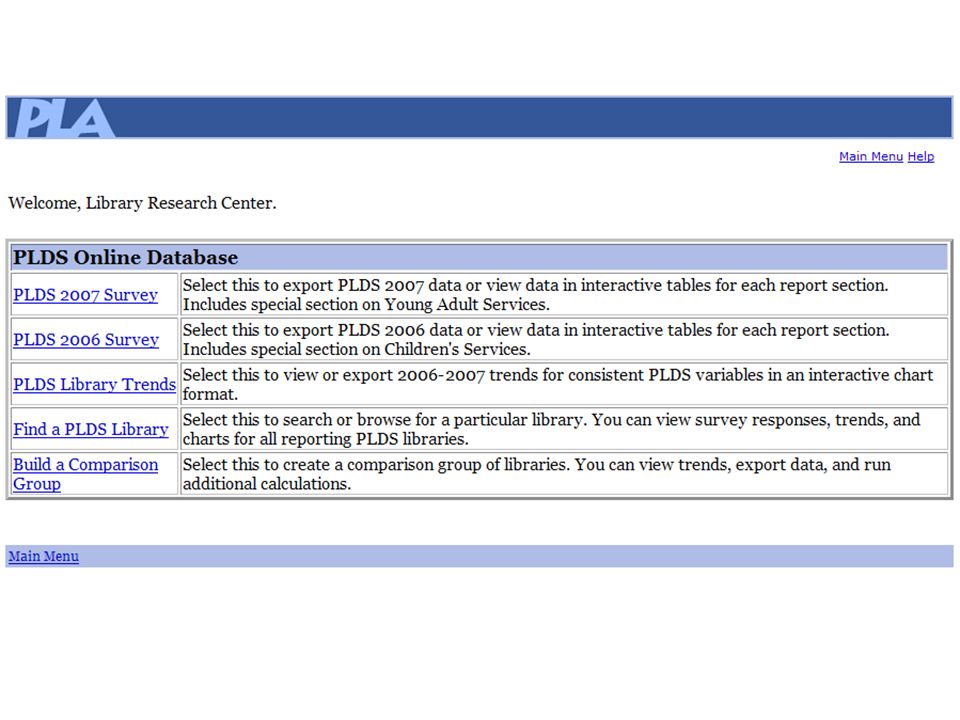
PLDS Online Database Features All 2006 and 2007 survey data in… Interactive Section Reports featuring customizable data tables and Excel data export Summary Tables and interactive Comparison Charts for virtually all PLDS variables Aggregate Two-Year Trends by population of legal service area for all consistent data variables Individual Library Reports featuring PDFs of survey responses, two-year trends, and library dashboard feature Build Comparison Group feature where users can create a set of libraries and view data or two-year trends

10
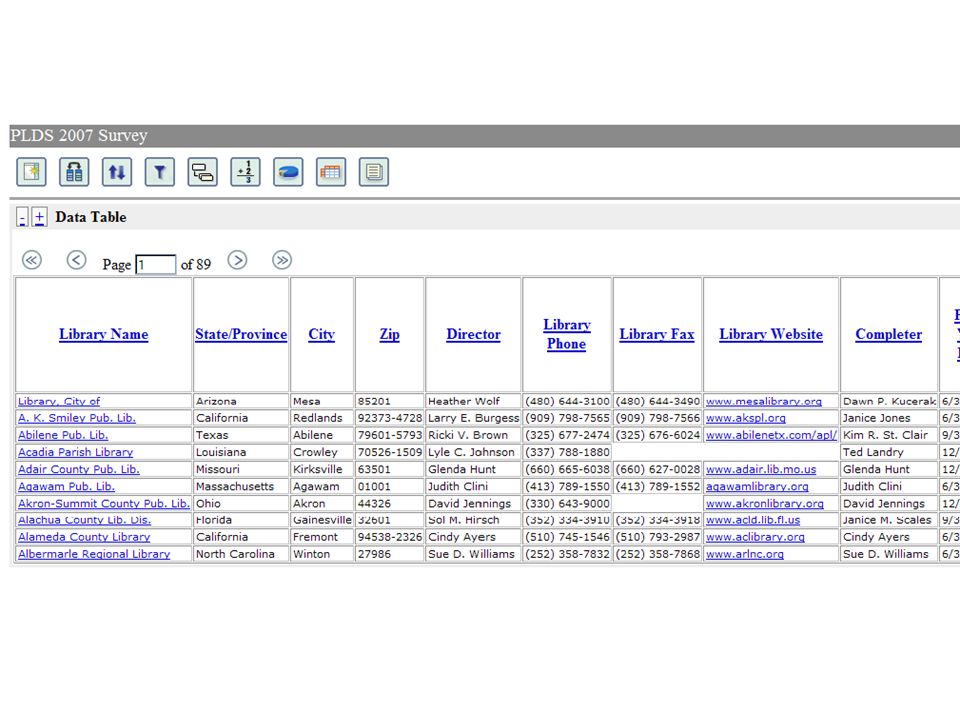
PLDS Section Reports Features Customize which data columns are displayed Sort and search within data columns Export data into Excel files View individual library information and/or add libraries to your comparison group

11
Customized Data Column Display Check-mark columns you wish to view. Choose how many library records you want displayed per page. PLDS 2007 Finance

12
Data Column Sorting Sort columns by clicking on column header name. Hover mouse over column name to learn more about the variable.

13
Data Column Searching Enter key search terms to search text columns. Place upper and lower limits on numerical columns.

14
Export Data into Excel Click on the ‘Export’ button to download an Excel file to your computer.

15
View Library Information Click on a library name to learn more about a particular library. View their Library Identification inf0rmation, go to that library’s individual page, or add the library to your comparison group.

16
Other Section Report Features Page through library data by clicking on the arrow keys. The single arrow buttons take to the next/previous page. The double arrow buttons take to the first/last page.

17
Other Section Report Features Certain data columns have charts associated with them. Click on the blue links to display them for each library.

19
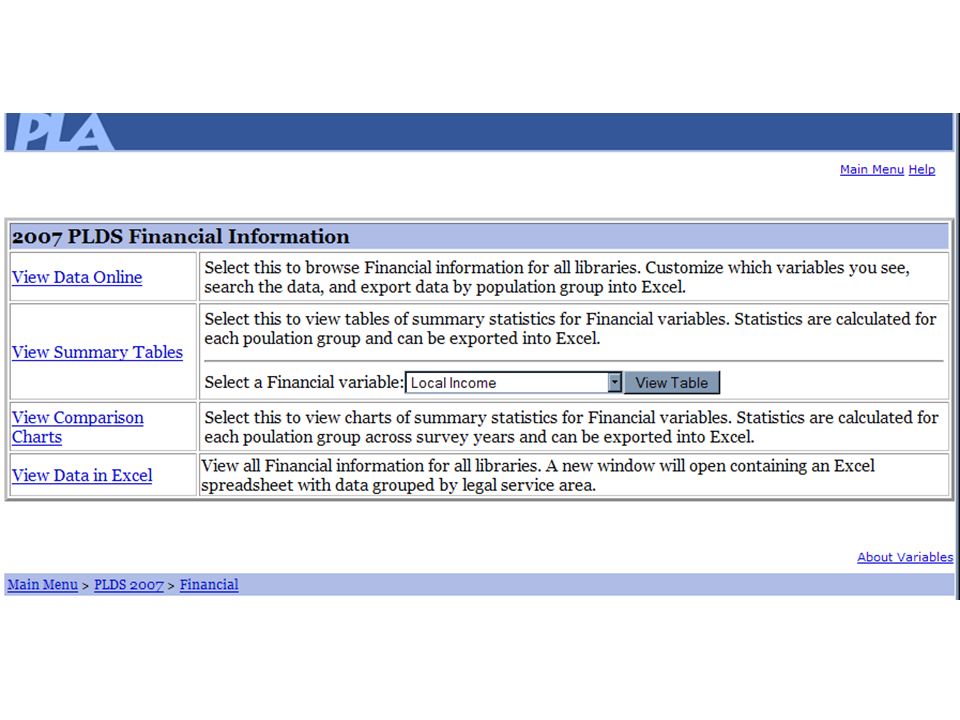
PLDS Summary Tables Select other variables to view or toggle between report years to view summary statistics.

22
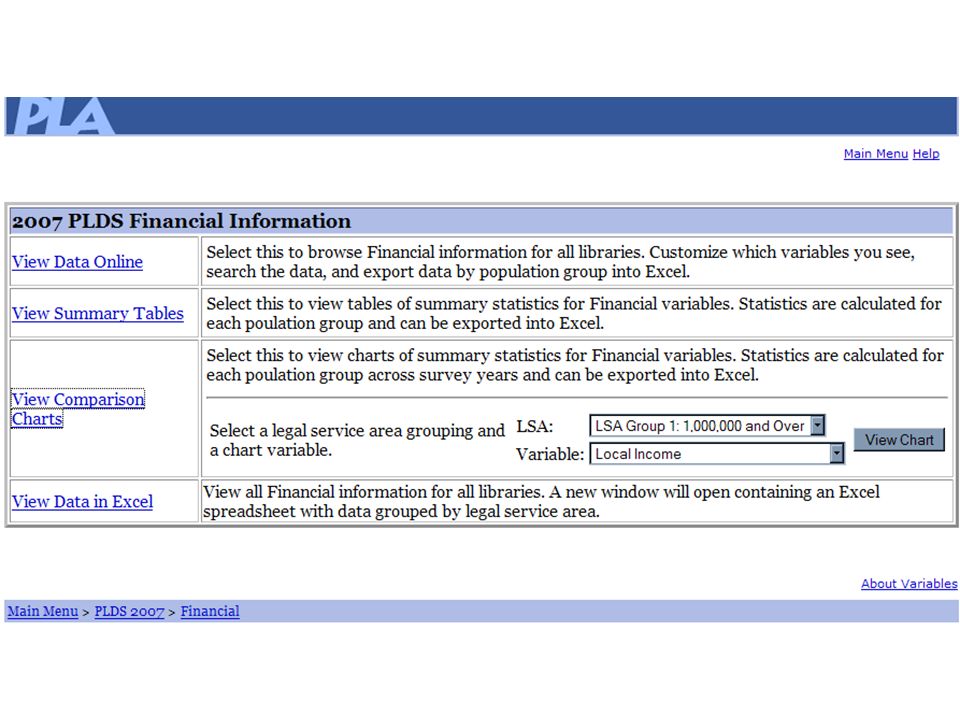
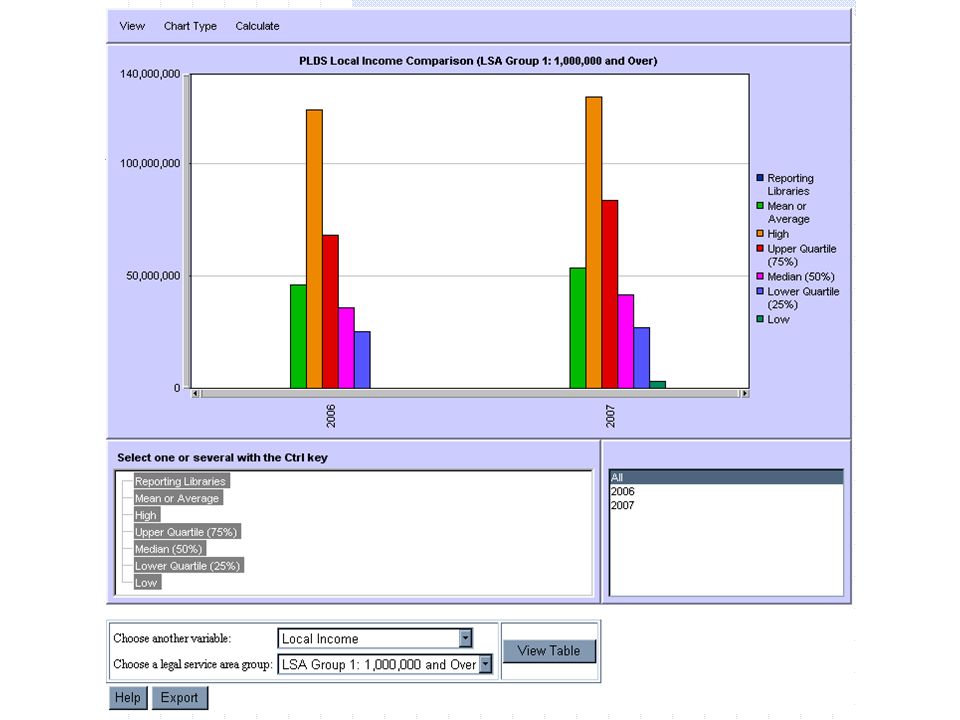
Dynamic charts that allow users to: Control the type of chart (line, bar, area, pie) Alternate between chart and table view Select what information is displayed Perform additional calculations PLDS Comparison Charts
 Alternate between chart and table view Select what information is displayed Perform additional calculations PLDS Comparison Charts")
23
PLDS Section Report Data Export

29
Searching for PLDS Libraries Search by any combination of library name, city, or state/province. Enter your library’s PLDS ID to find that library directly.

32
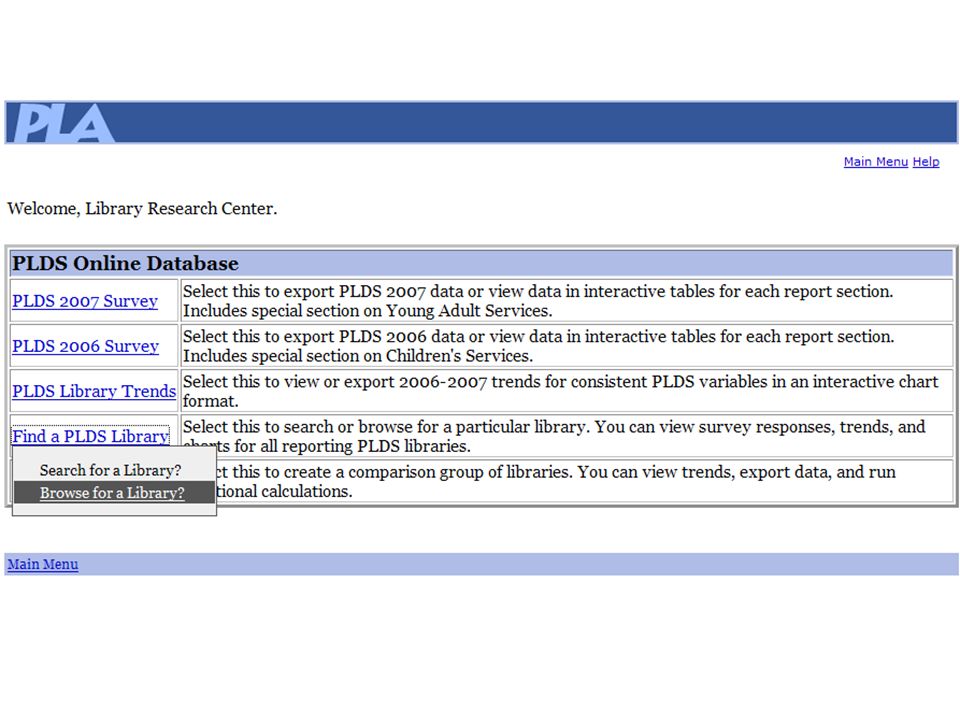
Browsing for PLDS Libraries

34
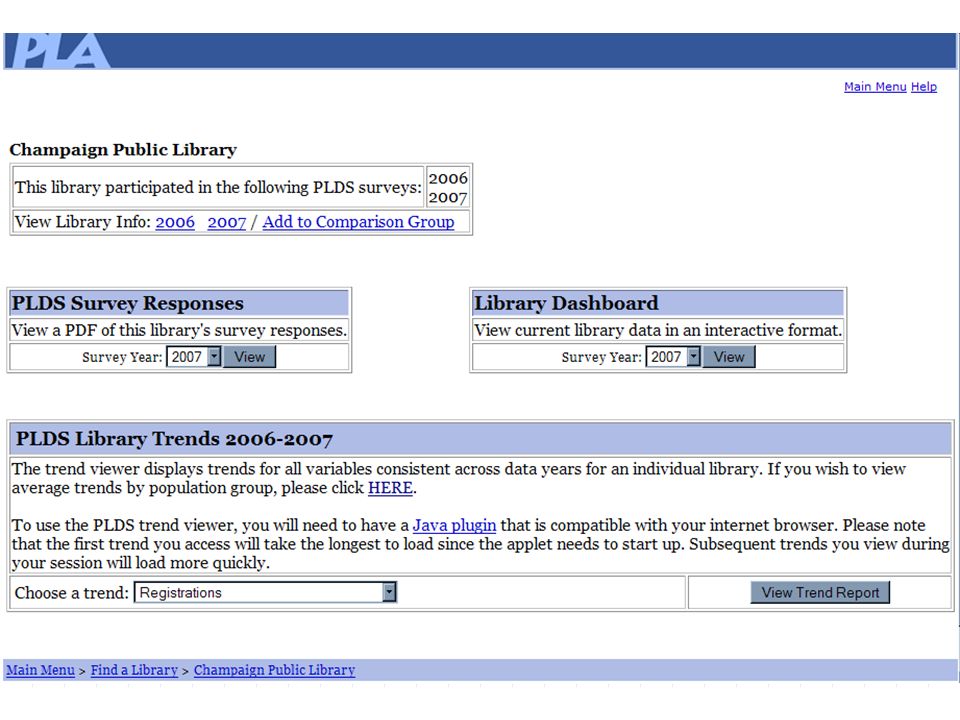
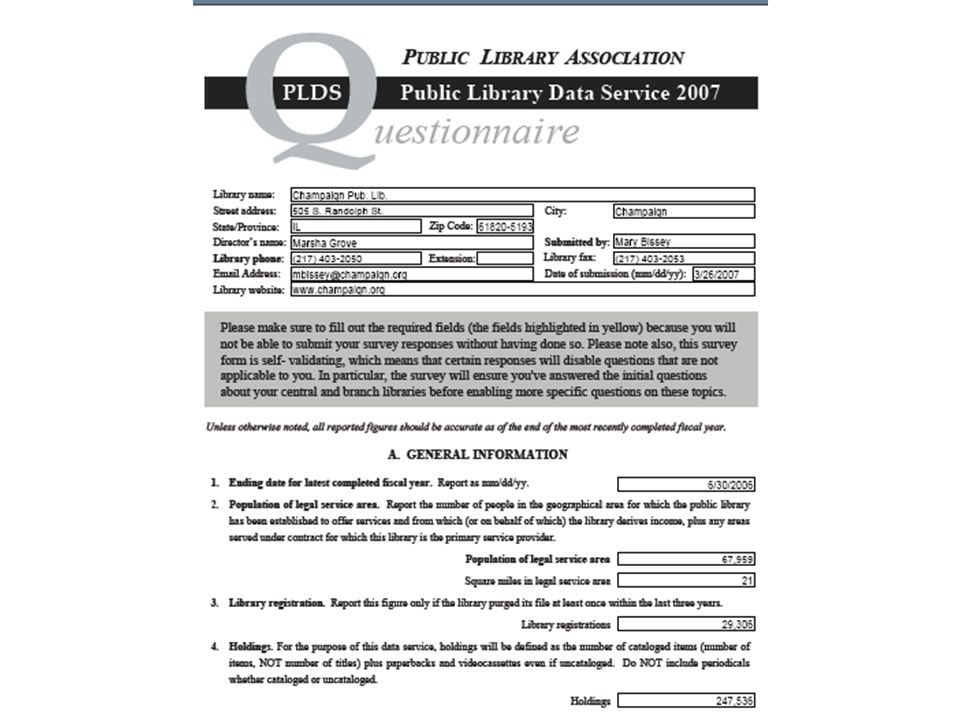
Individual Library Pages For each survey year: View Library Identification information Download and save PDF survey responses View Library Dashboard feature View interactive two-year trends Add library to Comparison Group

35
About PLDS Libraries

37
Library Dashboard Four Bar Charts: Operating Income Operating Expenditures Interlibrary Loan Staffing Levels Six Gauges: Total Circulation Total Holdings Total Reference Transactions Total Library Visits Total Program Attendance Total In-Library Materials Use

38
Library Dashboard

40
Building Your Comparison Group Add up to 20 libraries that are stored until you delete them. Check-mark the libraries you wish to view survey data for or group trends.

41
Building Your Comparison Group Once your libraries are selected, choose how you want to view the data…

42
Interactive Database Feature View all reporting libraries for 2006 or 2007 in the interactive database or concentrate only on those libraries in your comparison group The interactive database allows users to run their own analyses without the need for additional software. Users can: Sort, filter, and group data Show, hide, and rearrange data Create their own calculated values Create customized charts and cross tabs Export data into Excel/CSV/PDF file formats Save and load ongoing database sessions

43
Entering the Interactive Database

45
Interactive Database Controls This controls the table layout. Users can select which variables they do/do not want to see and reorder the variables. This allows users to place a filter on the data. Users can set the filter to a particular value or a range of values. This allows users to group data on specific criteria such as state, library type, etc. This allows the user to calculate aggregate statistics based on the entire dataset, filtered data, or grouped data. By clicking here, the user can create new columns of data based on their own calculations. This allows the user to chart variables against each other. The user can select from Pie, Bar, Line, Spline, or Scatter Plot charts. By choosing this icon, users can perform crosstabs to explore relationships between the data. The user can also determine how many records are displayed per page by clicking on this icon.

Similar presentations