Download presentation
Presentation is loading. Please wait.

1
Tax Potential vs. Tax Effort: Factors Behind the Stubbornly Low Tax Collection in Armenia Hamid R. Davoodi and David A. Grigorian Armenia: Challenges of Sustainable Development Conference in Honor of Professor Armen Alchian UCLA, May 6, 2006

2
Outline I. Overview II. Armenias Tax Performance Evolution over time and vis-à-vis other CIS Fund-supported programs, 1996-99 and 2001-04 Current PRGF program 2005-08 III. Cross-Country Regression Analysis Methodology and Data Regression Results Robustness IV. Conclusion

3
I. Overview of Economic Performance Generally strong macroeconomic performance Yet, weak structural foundations: –Large scale emigration –Poverty –Corruption –Weak fiscal package/incentives Need to improve tax collection because: –Long-term growth potential –Poverty reduction goals (as outlined in the PRSP) –Expected decline in concessional borrowing
 –Expected decline in concessional borrowing.")
16
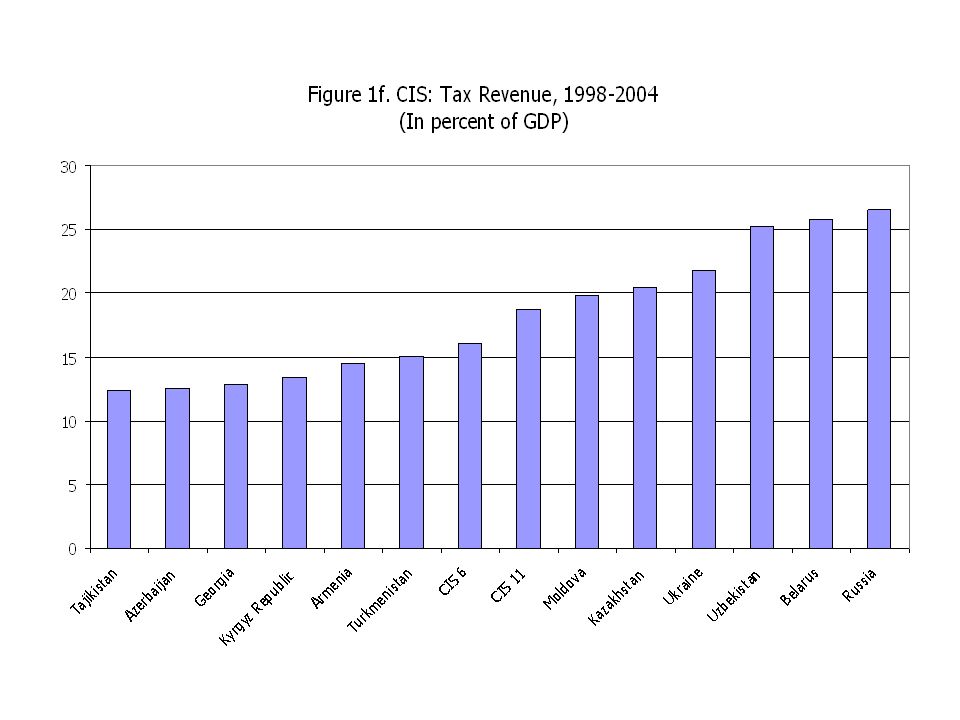
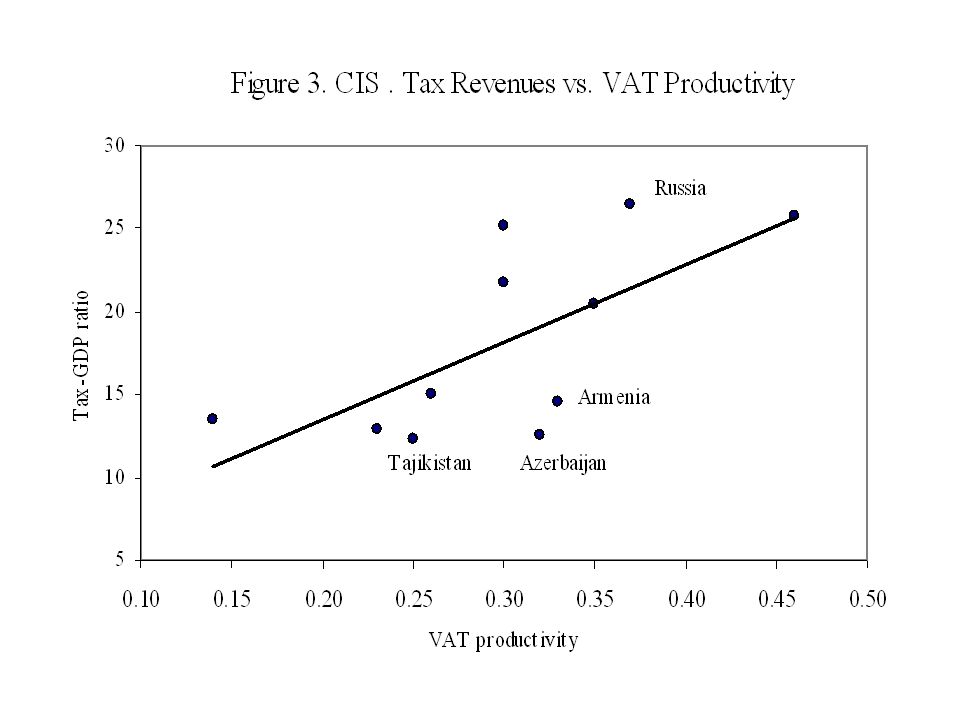
Whats wrong with this picture? Tax collection low compared to other CIS countries Tax collection low compared to its potential Decline in share of direct taxes Poor balance between equity and efficiency Lowest buoyancy of (especially direct) taxes in CIS Low VAT productivity, reflecting problems in administration and exemptions Eighteen revenue measures in 2005-08 PRGF –Six tax policy measures –Seven tax administration measures –Five customs administration
 taxes in CIS Low VAT productivity, reflecting problems in administration and exemptions Eighteen revenue measures in PRGF –Six tax policy measures –Seven tax administration measures –Five customs administration.")
17
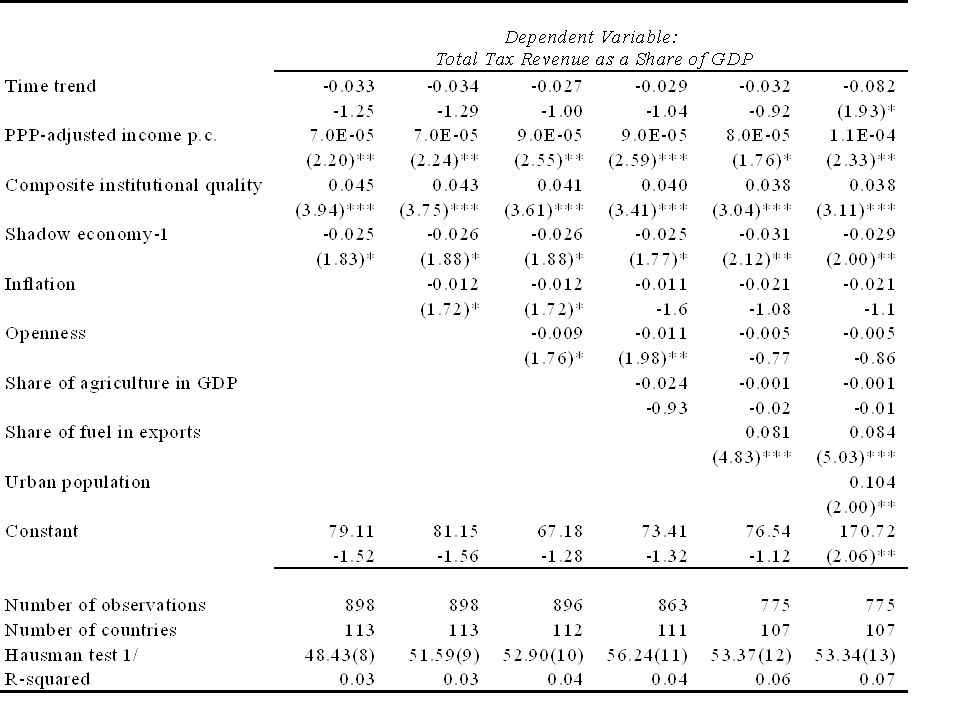
III. Regression Analysis Following the literature, determinants of tax-GDP ratio across countries and time are: Per capita GDP Institutional quality Inflation Share of agriculture Openness of the economy Shadow economic activity Fuel share of merchandize exports Share of Urban population

18
Data Sources Publicly available data on up to 113 countries For the period of 1990-2004 Indicators of institutional quality from the International Country Risk Guide (ICRG) Estimates of Shadow economy from Schneider (2005) VIOLENCE, constructed based on the dataset provided by Center for Systemic Peace
 Estimates of Shadow economy from Schneider (2005) VIOLENCE, constructed based on the dataset provided by Center for Systemic Peace")
19
Determinants of Shadow Economy All coefficients have expected signs: Bureaucratic quality reduces shadow economic activity, but at a declining rate Corporate tax rate is not significant Higher per capita income is associated with lower shadow economy More political/social violence leads to more shadow economic activity

21
Main Results Positive effect of per capita GDP on tax revenue level Positive and strong impact of institutional quality Negative and significant impact of the shadow economic activity Negative but insignificant impact of agriculture Negative sign on inflation Negative correlation between openness and taxes Finally, OIL and URBAN are both positive and significant

22
Post-estimation Analysis

25
Conclusions Armenia demonstrates low (particularly direct) tax buoyancy While finding oil may not be a feasible alternative, other tools are available Better institutions appear to cause higher tax-GDP potential both directly and indirectly (through shadow economy) Improvements in tax policy and administration would help so long as they address the fundamental incentive issues Therefore, for any attempt to increase the tax performance in Armenia to be successful, measures to improve governance, rule of law, and bureaucratic qualityall in the realm of the political willshould be in its core
 tax buoyancy While finding oil may not be a feasible alternative, other tools are available Better institutions appear to cause higher tax-GDP potential both directly and indirectly (through shadow economy) Improvements in tax policy and administration would help so long as they address the fundamental incentive issues Therefore, for any attempt to increase the tax performance in Armenia to be successful, measures to improve governance, rule of law, and bureaucratic qualityall in the realm of the political willshould be in its core")
Similar presentations


 Bangladesh: A Strategy for Growth and Employment.>")

What do we include in a Growth model? (2)Evidence of the relationship between increased trade.>")


 Minister for Energy and Minerals The United Republic.>")

 Vitek, F. (SPR)>")


