Download presentation
Presentation is loading. Please wait.

2
October 6, 2010

3
In this activity you’ll learn how CO2 can affect aquatic animals, plants and other living organisms in lakes, streams, rivers, and oceans. You’ll also learn that humans are part of the carbon cycle and how to calculate your family’s carbon footprint.

5
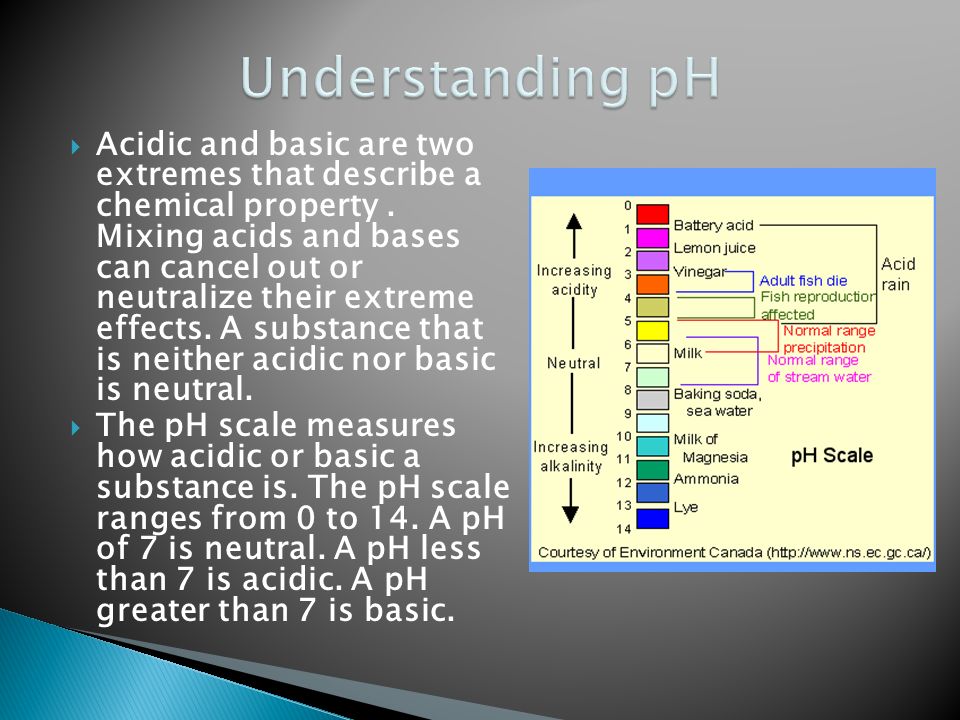
Acidic and basic are two extremes that describe a chemical property. Mixing acids and bases can cancel out or neutralize their extreme effects. A substance that is neither acidic nor basic is neutral. The pH scale measures how acidic or basic a substance is. The pH scale ranges from 0 to 14. A pH of 7 is neutral. A pH less than 7 is acidic. A pH greater than 7 is basic.

6
Use gloves when mixing Bromothymol Blue (BromBlue). Put 8 ounces of water and 2 milliliters (ml.) of BromBlue each into three clear cups. Vinegar is a acid. What do you predict will happen when you add vinegar to the BromBlue? Baking Soda is a base. What do you predict will happen when you add Baking Soda to the BromBlue?
 of BromBlue each into three clear cups. Vinegar is a acid. What do you predict will happen when you add vinegar to the BromBlue. Baking Soda is a base. What do you predict will happen when you add Baking Soda to the BromBlue .")
8
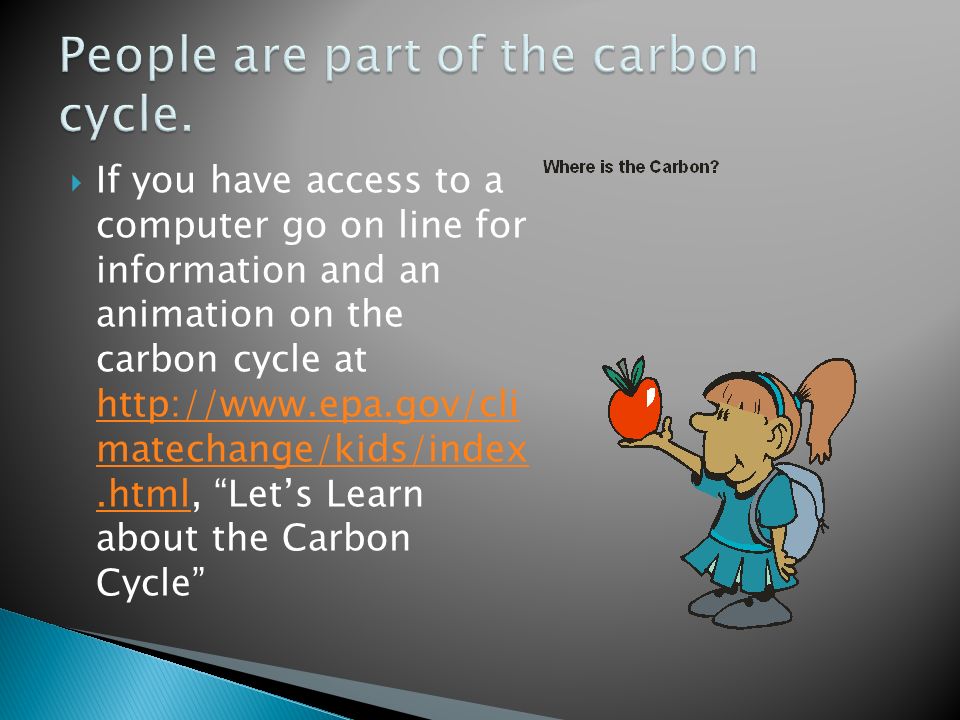
If you have access to a computer go on line for information and an animation on the carbon cycle at http://www.epa.gov/cli matechange/kids/index.html, “Let’s Learn about the Carbon Cycle” http://www.epa.gov/cli matechange/kids/index.html

9
Plants capture sunlight in the photosynthesis process- Water + Carbon Dioxide + Sunlight Produces Glucose & Oxygen

10
2 4 1.Carbon is in this form here: ________________________________ 2. Carbon is captured by plants with this process: ________________________________ The apple contains this carbon containing material: ________________________________ 3. When the apple is eaten, carbon is released here by this process: _________________________________ 4. Carbon is released here by this process:_____________________________ 3 1 Fill in the blanks with your team.

11
Turn to page 5 of your Youth Guide. Let’s state our hypothesis before we begin. Work with your team to complete this sentence, “If we add CO2 to water then the BromBlue will ……”

12
Scientists use Independent, Dependent and Controlled variables to help them be clear about their experimental design. Independent variables answer the question “What do we change?” Dependent variables answer the question “What do we observe?” Controlled variables answer the question “What do we keep the same?”

13
What is your Independent Variable? What will you change? What is your Dependent Variable? What will you observe happening? What is your Controlled Variable? What will you keep the same?”

14
Follow the directions to complete part 1 of the Experiment on pages 5- 6 in the youth guide. The person(s) in contact with the BromBlue should wear gloves and goggles.
 in contact with the BromBlue should wear gloves and goggles..")
15
Turn to page 6 of your Youth Guide. Let’s state our hypothesis before we begin Part 2. Work with your team to complete this sentence, “If we add a half tablet of effervescent antacid to water then the BromBlue will ……” What is your Independent Variable? What will you change? What is your Dependent Variable? What will you observe happening? What is your Controlled Variable? What will you keep the same?” Do the Experiment

16
You will use the data on page 9 to calculate the carbon footprint of the Green family. How does the Green family compare to your own family?

17
Gas Bill Handout The upper portion of the page has a bill for December. Note that there were 70 therms used in December 09. This is compared to 72 therms in December 08. The lower part of the page has a bill for June. Note that there were 13 therms used in June 2010 compared to 10 used in June 09. On each bill you can see how gas use changes across seasons in the bar graph provided.

18
https://www.4-h.org/NYSD https://www.4-h.org/NYSD

Similar presentations


>")


 to a solution. Or forms H 3 O + (hydronium ions) with water >")


