Download presentation
Presentation is loading. Please wait.

1
Determinants of international transport costs and connectivity and the mutual relationship between trade and transport facilitation and development Jan Hoffmann, Chief, Trade Facilitation Section, Trade Logistics Branch, Division on Technology and Logistics

2
Transport costs Trade TransportServices

3
More income to finance trade facilitation -> Better trade facilitation -> More Trade -> More income to finance trade facilitation Angola

4
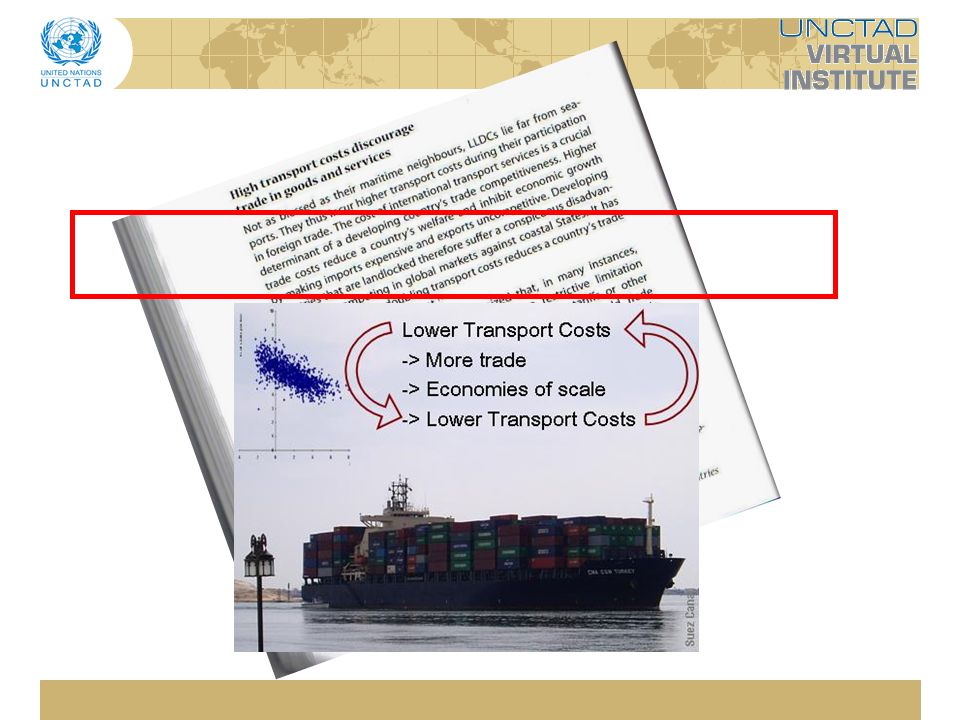
Lower Transport Costs -> More trade -> Economies of scale -> Lower Transport Costs

5
Better services -> More trade -> More income to finance infrastructure -> Better services

6
The challenge: Avoid a vicious circle, where high transport costs and low service levels discourage trade, which will further endear transport and reduce connectivity… Instead: Initiate a virtuous circle

7
Transport Costs Connectivity Trade Geneva, May 2010 Jan.Hoffmann@UNCTAD.org

8
Transport Costs Connectivity Trade Geneva, May 2010 Jan.Hoffmann@UNCTAD.org

9
Freight rates in May 2010 40’ container from Dalian to DUBAI 1200 COLOMBO 1300 B.ABBAS1300 CALCUTTA 1700 BAHRAIN1800 UM QUASER3000 PORT SUDAN3300 ROTTERDAM3500 TEMA4600 SANTOS4800 VALPARAISO5200

10
Source: UNCTAD Freight costs for countries

11
Freight as % of commodities value UNCTAD, Review of Maritime Transport

12
Transport costs Trade Volumes TransportServices ?

13
Differences in freight costs depend on… 1)Distances 2)Economies of scale 3)Imbalances 4)Type & value of goods 5)Competition 6)Port characteristics
Distances 2)Economies of scale 3)Imbalances 4)Type & value of goods 5)Competition 6)Port characteristics")
14
1)Distances 2)Economies of scale 3)Imbalances 4)Type & value of goods 5)Competition 6)Port characteristics
Distances 2)Economies of scale 3)Imbalances 4)Type & value of goods 5)Competition 6)Port characteristics")
15
Freight rates and Distance in the Caribbean UNCTAD Transport Newsletter, 1st Quarter 2007

16
Distance Distance matters much more over land than at sea Distance matters more with higher oil prices

17
1)Distances 2)Economies of scale 3)Imbalances 4)Type & value of goods 5)Competition 6)Port characteristics
Distances 2)Economies of scale 3)Imbalances 4)Type & value of goods 5)Competition 6)Port characteristics")
18
Economies of Scale moving 10 000 tons instead of 100 (in one transaction) reduces unit costs by 40 to 50%
 reduces unit costs by 40 to 50%")
19
March 2010 costs 500TEU6500TEU 12000 TEU Construction costs million USD 1074105 Construction costs USD per TEU 20 00011 4008 750 Crew12 to 1715 to 17 Source: UNCTAD, Review of Maritime Transport 2010, forthcoming and data from Drewry Shipping Consultants

20
CRS, 25 April 2010

21
1)Distances 2)Economies of scale 3)Imbalances 4)Type & value of goods 5)Competition 6)Port characteristics
Distances 2)Economies of scale 3)Imbalances 4)Type & value of goods 5)Competition 6)Port characteristics")
22
Imbalances CI-Online 10 May 2010

23
1)Distances 2)Economies of scale 3)Imbalances 4)Type & value of goods 5)Competition 6)Port characteristics
Distances 2)Economies of scale 3)Imbalances 4)Type & value of goods 5)Competition 6)Port characteristics")
24
Merchandize type and value Increase the value by 1% implies an increase of transport and insurance costs by around 0.3 – 0.4%

25
1)Distances 2)Economies of scale 3)Imbalances 4)Type & value of goods 5)Competition 6)Port characteristics
Distances 2)Economies of scale 3)Imbalances 4)Type & value of goods 5)Competition 6)Port characteristics")
26
Source: Hoffmann, Wilmsmeier, MEL 2008 Competition between carriers Case study Caribbean

27
1)Distances 2)Economies of scale 3)Imbalances 4)Type & value of goods 5)Competition 6)Port and infrastructure characteristics
Distances 2)Economies of scale 3)Imbalances 4)Type & value of goods 5)Competition 6)Port and infrastructure characteristics")
28
Port reform Difference between “best” and “worst” case in Latin America: 25% of worst case

29
Dependent variable: maritime transport costs per tonne of containerizable cargo Wilmsmeier, Hoffmann, Sanchez, in: Porteconomics, 2006

30
Dependent variable: maritime transport costs per tonne of containerizable cargo Better port infrastructure reduces maritime transport costs

31
Dependent variable: maritime transport costs per tonne of containerizable cargo Better (perceived)port efficiency reduces maritime transport costs Better (perceived) port efficiency reduces maritime transport costs
port efficiency reduces maritime transport costs Better (perceived) port efficiency reduces maritime transport costs")
32
Dependent variable: maritime transport costs per tonne of containerizable cargo Port privatization in the EXPORTING country reduces maritime transport costs

33
Dependent variable: maritime transport costs per tonne of containerizable cargo Trade facilitation in the IMPORTING country reduces maritime transport costs

34
Dependent variable: maritime transport costs per tonne of containerizable cargo Better connectivity between ports/ more competition among carriers reduces maritime transport costs

35
Differences in freight costs depend on… Distances Type & value of goods Imbalances Competition Economies of scale Port and infrastructure characteristics

36
Transport costs Trade Volumes TransportServices ?

37
Transport Costs Connectivity Trade Geneva, May 2010 Jan.Hoffmann@UNCTAD.org

38
Containerization of trade, and access to containerized transport services are important determinants of countries’ trade competitiveness How can we measure this?

39
“Maritime connectivity” UNCTAD ’ s “ Liner Shipping Connectivity Index ” (LSCI): An indicator for the supply of liner shipping services Components: Ships Container carrying capacity Shipping companies Services Maximum ship sizes
: An indicator for the supply of liner shipping services Components: Ships Container carrying capacity Shipping companies Services Maximum ship sizes")
40
The UNCTAD LSCI components Index of country averages Source: UNCTAD, based on data from Containerization International

41
New ships no longer have their own cranes

42
The UNCTAD LSCI components Index of country averages Source: UNCTAD, based on data from Containerization International

43
Bad news for smaller economies In 2009, there were fifteen LDCs with only one to four service providers – almost a doubling compared to 2004, when there had been just eight LDCs with such low levels of competition.

44
Bad news for smaller economies (cont.) The global average of direct connections per country has remained stable, while the number of direct connections per LDC has declined by 20 per cent during the last three years.
 The global average of direct connections per country has remained stable, while the number of direct connections per LDC has declined by 20 per cent during the last three years.")
45
Transport costs Trade Volumes TransportServices ?

46
LSCI African countries UNCTAD LSCI (Liner Shipping Connectivity Index) 2009 values
 2009 values")
47
Determinants of connectivity Trade volumes (+) Distance (-) Development (+) Infrastructure (+)
 Distance (-) Development (+) Infrastructure (+)")
48
Better services -> More trade -> More income to finance infrastructure -> Better services

49
More trade -> More shipping supply -> More competition -> lower freights -> More trade

50
Transport Costs Connectivity Trade Geneva, May 2010 Jan.Hoffmann@UNCTAD.org

51
Transport costs Trade TransportServices ?

52
Gravity model Participation of country B in global imports is the basic determinant of the share of country A’s exports that are destined for country B. Neighbouring countries can be expected to trade more with each other than those that are not neighbours.

53
Gravity model – what about distance? Distance / trade: negative correlation (as expected) But: the parameter for distance is not statistically significant if other variables are incorporated that capture the supply of shipping services and transport costs. Instead of distance: number of liner shipping companies that provide direct services between a pair of countries. Existence of direct liner shipping services. The freight rate
 But: the parameter for distance is not statistically significant if other variables are incorporated that capture the supply of shipping services and transport costs. Instead of distance: number of liner shipping companies that provide direct services between a pair of countries. Existence of direct liner shipping services. The freight rate.")
55
Summary 55 DIVISION ON TECHNOLOGY AND LOGISTICS, TRADE LOGISTICS BRANCH, TRADE FACILITATION SECTION

56
56 DIVISION ON TECHNOLOGY AND LOGISTICS, TRADE LOGISTICS BRANCH, TRADE FACILITATION SECTION Questions

57
57 DIVISION ON TECHNOLOGY AND LOGISTICS, TRADE LOGISTICS BRANCH, TRADE FACILITATION SECTION Thank you! Jan Hoffmann UNCTAD/ DTL Trade Logistics Branch Trade Facilitation Section Palais des Nations Jan.Hoffmann@unctad.org www.unctad.org/ttl www.asycuda.org

Similar presentations


 Inc May 29 th.>")


 IAPH Forum, HCMC Vietnam.>")

 and Gabriel Pérez S. (UNECLAC) Recent findings and key challenges.>")


 Muthanna Investment Company (MIC)>")

