Download presentation
Presentation is loading. Please wait.

1
Jan.Hoffmann@UNCTAD.org Geneva, May 2011 The demand and supply of international transport services: The relationships between trade, transport costs and effective access to global markets

2
Transport costs Trade TransportServices

3
More income to finance trade facilitation -> Better trade facilitation -> More Trade -> More income to finance trade facilitation Angola

4
Lower Transport Costs -> More trade -> Economies of scale -> Lower Transport Costs

5
Better services -> More trade -> More income to finance infrastructure -> Better services Suez Canal

6
More trade -> More shipping supply -> More competition -> lower freights -> More trade

7
The challenge: Avoid a vicious circle, where high transport costs and low service levels discourage trade, which will further endear transport and reduce connectivity… Instead: Initiate a virtuous circle

8
Transport Costs Connectivity Trade Geneva, May 2011 Jan.Hoffmann@UNCTAD.org

9
Transport Costs Connectivity Trade Geneva, May 2011 Jan.Hoffmann@UNCTAD.org

10
Trends in transport costs

12
Freight rates in January 2011 40’ container from Dalian to DUBAI 1300 COLOMBO 1600 B.ABBAS1400 CALCUTTA 2000 KARACHI1600 UM QUASER2600 PORT SUDAN2500 ANTWERP2500 TEMA3500 SANTOS3600 VALPARAISO3600 Source: biz@jitgroup.net

13
Source: UNCTAD Freight costs for countries

14
Freight as % of commodities value UNCTAD, Review of Maritime Transport

15
15 Source: OECD (Jane Korinek), data for 2007; selected countries (mostly OECD members)
, data for 2007; selected countries (mostly OECD members)")
16
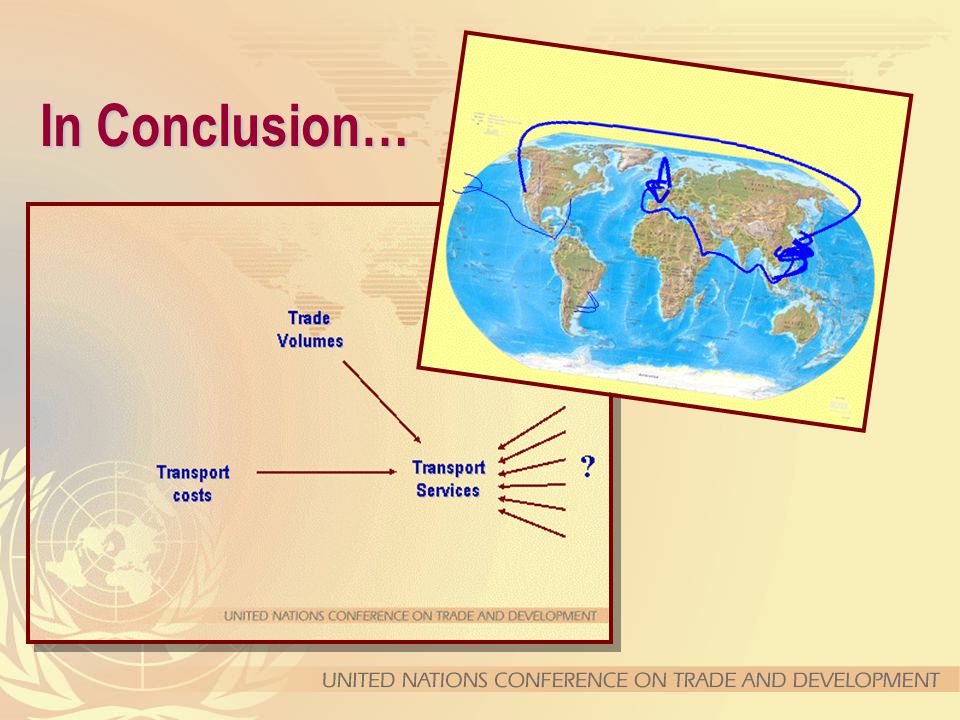
Transport costs Trade Volumes TransportServices ?

17
Differences in maritime freights depend on… 1)Distances 2)Economies of scale 3)Imbalances 4)Type & value of goods 5)Competition 6)Port characteristics
Distances 2)Economies of scale 3)Imbalances 4)Type & value of goods 5)Competition 6)Port characteristics")
18
Differences in maritime freights depend on… 1)Distances 2)Economies of scale 3)Imbalances 4)Type & value of goods 5)Competition 6)Port characteristics
Distances 2)Economies of scale 3)Imbalances 4)Type & value of goods 5)Competition 6)Port characteristics")
19
Freight rates and Distance in the Caribbean UNCTAD Transport Newsletter, 1st Quarter 2007

20
Differences in maritime freights depend on… 1)Distances 2)Economies of scale 3)Imbalances 4)Type & value of goods 5)Competition 6)Port characteristics
Distances 2)Economies of scale 3)Imbalances 4)Type & value of goods 5)Competition 6)Port characteristics")
21
Feb 2008 costs 1100TEU4250TEU8750TEU 13000 TEU Construction costs million USD 2877135167 Construction costs USD per TEU 25 00018 11715 43012 850 Crew15 to 17 Source: Dynamar, 2008, via Antonio Zuidwijk

22
22 http://www.youtube.com/watch?v=fxFs5LpDsQU&NR =1http://www.youtube.com/watch?v=fxFs5LpDsQU&NR =1

23
Economies of Scale CRS, 25 April 2010

24
Port operations 12 US$ per move savings with global operators Drewry

25
Differences in maritime freights depend on… 1)Distances 2)Economies of scale 3)Imbalances 4)Type & value of goods 5)Competition 6)Port characteristics
Distances 2)Economies of scale 3)Imbalances 4)Type & value of goods 5)Competition 6)Port characteristics")
26
Imbalances CI-Online 10 May 2010

27
Differences in maritime freights depend on… 1)Distances 2)Economies of scale 3)Imbalances 4)Type & value of goods 5)Competition 6)Port characteristics
Distances 2)Economies of scale 3)Imbalances 4)Type & value of goods 5)Competition 6)Port characteristics")
28
Merchandize type and value Increase the value by 1% implies an increase of transport and insurance costs by around 0.3 – 0.4%

29
Differences in maritime freights depend on… 1)Distances 2)Economies of scale 3)Imbalances 4)Type & value of goods 5)Competition 6)Port characteristics
Distances 2)Economies of scale 3)Imbalances 4)Type & value of goods 5)Competition 6)Port characteristics")
30
Source: Hoffmann, Wilmsmeier, IAME 2007 Competition between carriers Case study Caribbean

31
If the company itself has no direct service (i.e. it only has a service with transshipment): This company’s freight rate + $650 If other, competing, companies do provide a direct service: This companies freight rate - $425
: This company’s freight rate + $650 If other, competing, companies do provide a direct service: This companies freight rate - $425 .")
32
Differences in maritime freights depend on… 1)Distances 2)Economies of scale 3)Imbalances 4)Type & value of goods 5)Competition 6)Port characteristics
Distances 2)Economies of scale 3)Imbalances 4)Type & value of goods 5)Competition 6)Port characteristics")
33
Port reform Difference between “best” and “worst” case in Latin America: 25% of worst case

34
Dependent variable: maritime transport costs per tonne of containerizable cargo Wilmsmeier, Hoffmann, Sanchez, in: Porteconomics, 2006

35
Dependent variable: maritime transport costs per tonne of containerizable cargo Better port infrastructure reduces maritime transport costs

36
Dependent variable: maritime transport costs per tonne of containerizable cargo Better (perceived)port efficiency reduces maritime transport costs Better (perceived) port efficiency reduces maritime transport costs
port efficiency reduces maritime transport costs Better (perceived) port efficiency reduces maritime transport costs ")
37
Dependent variable: maritime transport costs per tonne of containerizable cargo Better general transport infrastructure does NOT reduce maritime transport costs

38
Dependent variable: maritime transport costs per tonne of containerizable cargo Port privatization in the EXPORTING country reduces maritime transport costs

39
Dependent variable: maritime transport costs per tonne of containerizable cargo Trade facilitation in the IMPORTING country reduces maritime transport costs

40
Dependent variable: maritime transport costs per tonne of containerizable cargo Better connectivity between ports/ more competition among carriers reduces maritime transport costs

41
To sum up: Differences in maritime freights depend on… Distances Type & value of goods Imbalances Competition Economies of scale Port characteristics

42
Transport costs Trade Volumes TransportServices ?

43
Transport Costs Connectivity Trade Geneva, May 2011 Jan.Hoffmann@UNCTAD.org

44
Trade grows faster than GDP Source: JH based on data from UNCTAD and from WTO

45
Elasticity Trade/GDP Source: UNCTAD Exports = 2.5 GDP - 3

46
For a country’s GDP to grow, e.g., 5% trade “needs” to grow 7 – 12%

47
Elasticity containers/Trade

48
Guayaquil Containerization … Hamburg

49
Tierra del Fuego in Chile

50
… the world’s driest desert

51
… Guayaquil

52
…Beirut

53
… Luanda

54
Lima

55
… Bandar Abas

56
… France

57
…Suez Canal

58
…Panama Canal

59
Anyhow: e.g. intermodal connections in Mexico

60
… Mekong River

61
… Lahore

62
Anything: UN cargo in Tanzania

63
Anything: e.g. port library in Rio de Janeiro

64
Anything: e.g. shopping in Kabul

65
Containerization of trade, and access to containerized transport services are important determinants of countries’ trade competitiveness How can we measure this?

66
“Maritime connectivity” UNCTAD’s “Liner Shipping Connectivity Index” (LSCI): An indicator for the supply of liner shipping services Components: Ships TEU capacity Shipping companies Services Maximum ship sizes
: An indicator for the supply of liner shipping services Components: Ships TEU capacity Shipping companies Services Maximum ship sizes")
67
Barbados www.ci-online.co.uk

68
Trends

69
We have reached a peak Until very recently: In spite of the (global) process of concentration, the number of companies providing (local) services increased due to the expansion of global players into (so far) new markets
 process of concentration, the number of companies providing (local) services increased due to the expansion of global players into (so far) new markets")
70
We have reached a peak Today: As global players are (now) covering all regions of the world, mergers among them (start to) lead to a reduction of competition on individual routes.
 covering all regions of the world, mergers among them (start to) lead to a reduction of competition on individual routes.")
71
Trends “The long term picture as regards the global liner shipping network appears to be mixed. On the positive side, larger ships and a higher total TEU carrying capacity can cater for the growing global trade in manufactured goods, and economies of scale help to reduce costs. On the other hand, the larger ships also pose a challenge to smaller ports as regards the necessary investments in infrastructure. The network as such is not expanding in terms of companies or services. The trend seems to be towards lower costs but also towards less choice for shippers.”

72
Direct connectivity? Out of 162 x 161 pairs of countries: How many are connected by direct services? Source: UNCTAD, based on data from Containerization International

73
What can we do with this data Observe trends in the shipping network, levels of competition, and individual countries’ access to liner shipping services. Use the data as explanatory variable in gravity models Use the data as explanatory variable for other models about transport costs and trade competitiveness Try to explain the data, i.e. what are the determinants of “connectivity” (development, trade volumes, geography, port efficiency…)
.")
74
“A comparison of the LPI and the LSCI”

75
Partial correlation coefficients

76
Causalities? Better perceived logistics performance -> more attractive for carriers -> higher LSCI Better liner shipping connectivity -> better services -> higher LPI More trade -> higher LSCI + LPI -> More trade

77
Transport costs Trade Volumes TransportServices ?

78
Determinants of maritime connectivity Trade volumes (+) Distance (-) GDP per capita in exporting country (+) Port infrastructure (+)
 Distance (-) GDP per capita in exporting country (+) Port infrastructure (+)")
79
Transport Costs Connectivity Trade Geneva, May 2011 Jan.Hoffmann@UNCTAD.org

80
Transport costs Trade TransportServices ?

81
Gravity model Participation of country B in global imports is the basic determinant of the share of country A’s exports that are destined for country B. Neighbouring countries can be expected to trade more with each other than those that are not neighbours.

82
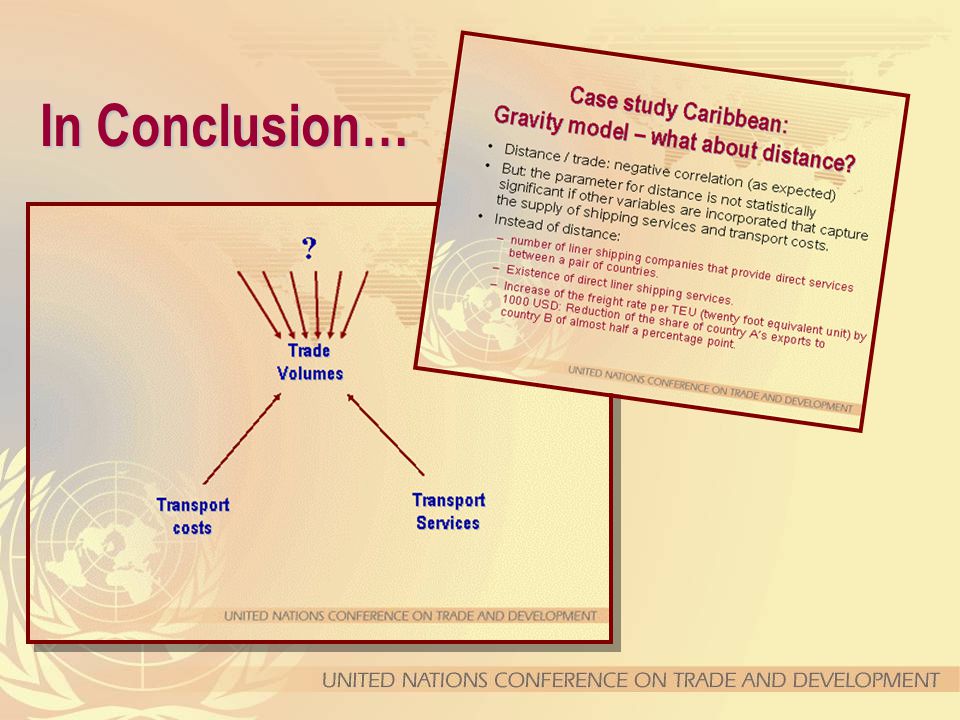
Gravity model – what about distance? Distance / trade: negative correlation (as expected) But: the parameter for distance is not statistically significant if other variables are incorporated that capture the supply of shipping services and transport costs. Instead of distance: –number of liner shipping companies that provide direct services between a pair of countries. –Existence of direct liner shipping services. –Increase of the freight rate per TEU (twenty foot equivalent unit) by 1000 USD: Reduction of the share of country A’s exports to country B of almost half a percentage point.
 But: the parameter for distance is not statistically significant if other variables are incorporated that capture the supply of shipping services and transport costs. Instead of distance: –number of liner shipping companies that provide direct services between a pair of countries. –Existence of direct liner shipping services. –Increase of the freight rate per TEU (twenty foot equivalent unit) by 1000 USD: Reduction of the share of country A’s exports to country B of almost half a percentage point..")
84
In Conclusion…

88
What I wanted to do in this first lecture: Present research on transport costs Sell our “Connectivity Index” Invite cooperation in future research

89
Transport Costs Connectivity Trade Geneva, May 2011 Jan.Hoffmann@UNCTAD.org

Similar presentations