Download presentation
Presentation is loading. Please wait.

1
© Crown copyright Met Office Modelling the climate system and climate change

2
© Crown copyright Met Office Modelling the climate system and climate change The goal of this session is a brief introduction to: the climate system drivers of climate and climate variability modelling of the climate system projections of future climate projections of future climate impacts on agriculture

3
© Crown copyright Met Office The climate system

4
© Crown copyright Met Office Components of the climate system

5
© Crown copyright Met Office The Greenhouse Effect Some solar radiation is reflected by the earth’s surface and the atmosphere EARTH Some of the infrared radiation is absorbed and re-emitted by the greenhouse gases. The effect of this is to warm the surface and the lower atmosphere Most solar radiation is absorbed by the surface, which warms Infrared radiation is emitted from the earth’s surface

6
© Crown copyright Met Office Changes in certain components of the climate system perturb (i.e. cause a change to) the radiative energy budget of the system, providing a radiative forcing. Examples include: the concentration of radiatively active species changes in the solar irradiance incident upon the planet changes affecting radiation absorbed by the surface Human-induced perturbations include: composition of the atmospheric gases increases in atmospheric aerosols land-use change (agriculture, deforestation, reforestation, afforestation, urbanisation, traffic, …) Radiative forcing
 the radiative energy budget of the system, providing a radiative forcing. Examples include: the concentration of radiatively active species changes in the solar irradiance incident upon the planet changes affecting radiation absorbed by the surface Human-induced perturbations include: composition of the atmospheric gases increases in atmospheric aerosols land-use change (agriculture, deforestation, reforestation, afforestation, urbanisation, traffic, …) Radiative forcing.")
7
© Crown copyright Met Office External radiative forcings, e.g.: solar radiation (output & Milankovitch) volcanic eruptions Internal climate variability, e.g.: ENSO (El Niño Southern Oscillation) NAO (North Atlantic Oscillation) and other leading modes of variability Natural variability of climate
 volcanic eruptions Internal climate variability, e.g.: ENSO (El Niño Southern Oscillation) NAO (North Atlantic Oscillation) and other leading modes of variability Natural variability of climate")
8
© Crown copyright Met Office The effect of the Mt. Pinatubo eruption (June 1991) on global temperature
 on global temperature.")
9
© Crown copyright Met Office Perturbations of the atmospheric composition - the enhanced greenhouse effect Effect of aerosols: direct effect (scattering of incoming solar radiation) indirect effect (affecting the radiative properties of clouds) Land-use change (agriculture, deforestation, reforestation, afforestation, urbanisation, traffic, …) Human-induced climate variations
 indirect effect (affecting the radiative properties of clouds) Land-use change (agriculture, deforestation, reforestation, afforestation, urbanisation, traffic, …) Human-induced climate variations")
10
© Crown copyright Met Office Indicators of the human influence on the atmosphere during the industrial era

11
© Crown copyright Met Office Radiative Forcings

12
© Crown copyright Met Office The response of the climate system to these forcing agents is complicated by: feedbacks the non-linearity of many processes different response times of the different components to a given perturbation The only means available to calculate the response is by using numerical models of the climate system. How do we quantify the response of the climate?

13
© Crown copyright Met Office Climate models

14
© Crown copyright Met Office General overview A global climate model (GCM) is a model of the climate system, including the atmosphere, oceans, land-surface and more. Atmosphere and ocean dynamics Model grid Physical parameterizations Initial conditions of the model Boundary conditions (e.g. land sea mask, orographic height, vegetation and soil characteristics)
.")
15
© Crown copyright Met Office Vertical exchange between layers of momentum, heat and moisture Horizontal exchange between columns of momentum, heat and moisture Vertical exchange between layers of momentum, heat and salts by diffusion, convection and upwelling Orography, vegetation and surface characteristics included at each grid box surface Vertical exchange between layers by diffusion and advection The three dimensional model grid 15° W 60° N 3.75° 2.5° 11.25° E 47.5° N

16
© Crown copyright Met Office Parameterization of physical processes Important processes occur in the atmosphere on scales smaller than those which are resolved by the grid of the dynamical part of the model. The effects of these unresolved (sub-grid scale) processes are deduced from the large scale state variables predicted by the model (wind, pressure, temperature, moisture). This procedure is called parameterization.
 processes are deduced from the large scale state variables predicted by the model (wind, pressure, temperature, moisture). This procedure is called parameterization..")
17
© Crown copyright Met Office Initial and boundary conditions All climate models require information about the initial state of the atmosphere at the beginning of the climate model experiment. These are the initial conditions of the model experiment. The three dimensional grid of a GCM has no lateral (North- South, East-West) boundaries. The upper boundary is the end of the atmosphere where it contacts outer space. The lower boundary is either the surface of the land or the bottom of the ocean. As such the GCM requires information about the topography of the Earth’s surface, called surface boundary conditions.
 boundaries. The upper boundary is the end of the atmosphere where it contacts outer space. The lower boundary is either the surface of the land or the bottom of the ocean. As such the GCM requires information about the topography of the Earth’s surface, called surface boundary conditions..")
18
© Crown copyright Met Office Development of climate models

19
© Crown copyright Met Office Predicting climate change

20
© Crown copyright Met Office Predicting Climate Change Studies of future climate change generally have the ultimate goal of trying to assess what the impacts of climate change will be on human life and the environment, as this information is of great interest to planners and decision-makers. These studies also need to assess what the level of risk associated with the various changes is, as some changes are more likely to occur than others.

21
© Crown copyright Met Office What will regional and local changes in climate, especially rainfall, be like? How will the incidence and characteristics of hazardous weather change? How will natural climate variability influence and be influenced by climate change? What will this mean for society and the natural environment? Predicting Climate Change

22
© Crown copyright Met Office Predicting Climate Change

23
© Crown copyright Met Office Land areas are projected to warm more than the oceans with the greatest warming at high latitudes Annual mean temperature change, 2071 to 2100 relative to 1990: Global Average in 2085 = 3.1oC

24
© Crown copyright Met Office Some areas are projected to become wetter, others drier with an overall increase projected Annual mean precipitation change: 2071 to 2100 Relative to 1990

25
© Crown copyright Met Office

26
Agriculture and climate change

27
Sensitivity/vulnerability Productivity of agricultural, forestry and fishery systems driven by physical, biological and chemical processes driven by changes to climate variables. Vulnerability depends on exposure and sensitivity to climate conditions, and the capacity to cope with changing conditions.

28
Agriculture – TAR CO 2 effects increase with temperature, but decrease once optimal temperatures exceeded. CO 2 effect may be greater for crops under moisture stress. Minimal warming in the tropics leads to crop yield losses. Mid- to high-latitude crops benefit from a small amount of warming (+2°C) - plant health declines with additional warming. Countries with greater wealth and natural resource endowments adapt more efficiently than those with less.
 - plant health declines with additional warming. Countries with greater wealth and natural resource endowments adapt more efficiently than those with less..")
29
Agriculture – AR4 new findings Importance of climate extremes. Large impacts of climate change on irrigation water requirements. Stabilisation of CO 2 concentrations reduces damage to crop production in the long term. Including effects of trade lowers regional and global impacts. Plant community structure is modified by elevated CO2 and climate change.

31
Agriculture – AR4 new findings Changes in forage quality and grazing behaviour are confirmed. Thermal stress reduces productivity, conception rates and is potentially life-threatening to livestock. Increased climate variability and droughts may lead to livestock loss.

32
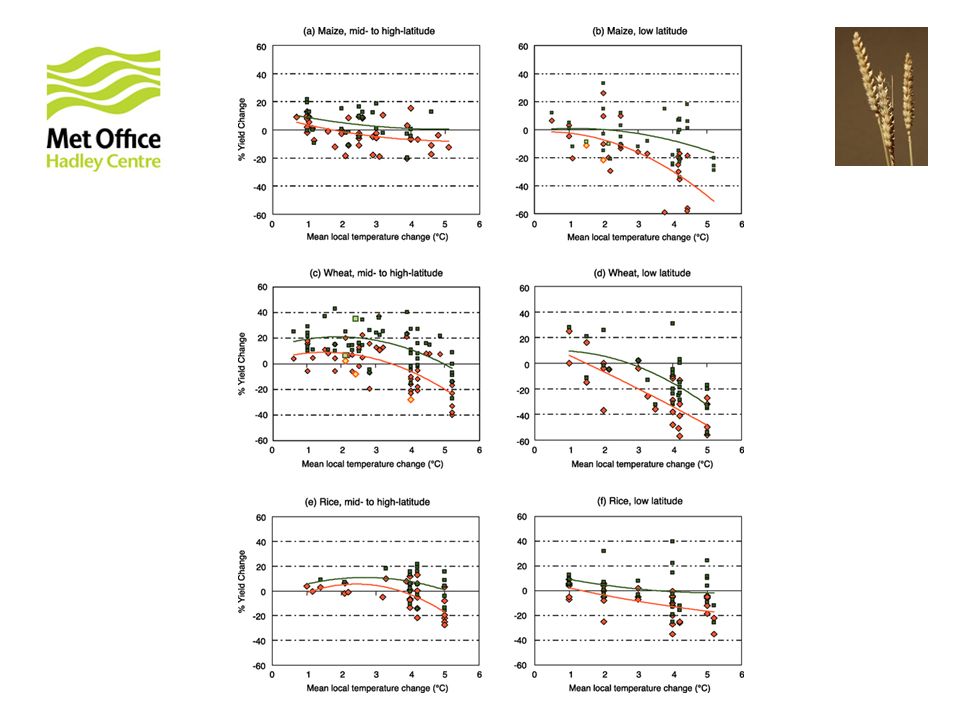
Agriculture – AR4 key conclusions Changes in the frequency and severity of extreme climate events will have more serious consequences for food production and insecurity, than changes in means of temperature and precipitation (high confidence) Climate change increases the number of people at risk of hunger (high confidence). Climate change will further shift the focus of food insecurity to sub-Saharan Africa. While moderate warming benefits crop and pasture yields in mid- to high- latitude regions, even slight warming decreases yields in seasonally dry and low-latitude regions (medium confidence).
..")
33
Agriculture – AR4 key conclusions Food trade is projected to increase in response to climate change, with increased dependence of most developing countries on food imports (medium to low confidence). Simulations suggest rising relative benefits of adaptation with low to moderate warming (medium confidence), although adaptation may stress water and environmental resources as warming increases (low confidence).
, although adaptation may stress water and environmental resources as warming increases (low confidence)..")
34
Agriculture/ forestry Major impacts of climate change on crop and livestock yields, forestry production by 2050 (literature and expert judgement of Ch 5 Lead Authors). Adaptation not taken into account.

35
Knowledge gaps 1.Response of crops other than cereals to elevated CO 2 2.Effect of climate change on pests, weeds and pathogens 3.Frequency and severity of extreme events 4.More crop model inter-comparison studies needed 5.Role of agriculture in future economy 6.Adaptive capacity across range of climate and socio-economic futures, and across developed and developing countries 7.Vulnerability at the local level 8.Impact of climate change on utilisation of biofuel crops

36
© Crown copyright Met Office... And in conclusion This presentation is intended as a brief overview of the climate system and climate modelling. For more in-depth training, consider registering for the free online course in the science of climate change and modelling at http://www.climateeducation.net This is a joint effort of the University of Oxford Continuing Education Department and the Met Office Hadley Centre consisting of 8 interactive online units intended for an educated (but non-scientist) audience.
 audience..")
37
© Crown copyright Met Office Any Questions?

Similar presentations


 Climate Models (from IPCC WG-I, Chapter 8) Climate Models Primary Source: IPCC WG-I Chapter 8 - Climate Models.>")


