Download presentation
Presentation is loading. Please wait.

1
McCreary Centre Society www.mcs.bc.ca

2
Administration took place in Grade 7-12 classes in 50 of the 59 BC School Districts. Over 29 000 surveys were collected in 1,760 classrooms between February and June 2008. Vancouver “I am happy to see a survey like this one. It’s about time questions were being asked. Now I am hoping to see some positive actions.” BC Youth Participant

3
A Picture of Health www.mcs.bc.ca

4
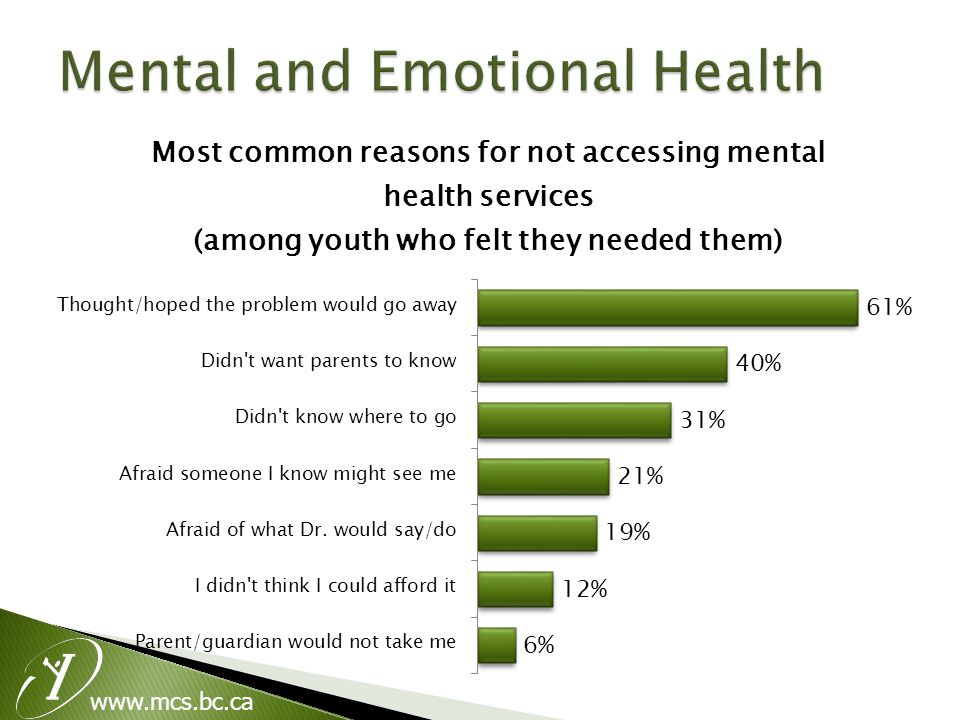
Most students are doing well; nearly all 84% report good or excellent health Serious injuries have declined 18% of females, 7% of males did not get mental health services they needed Nearly half did not eat the recommended servings of fruits or vegetables yesterday

5
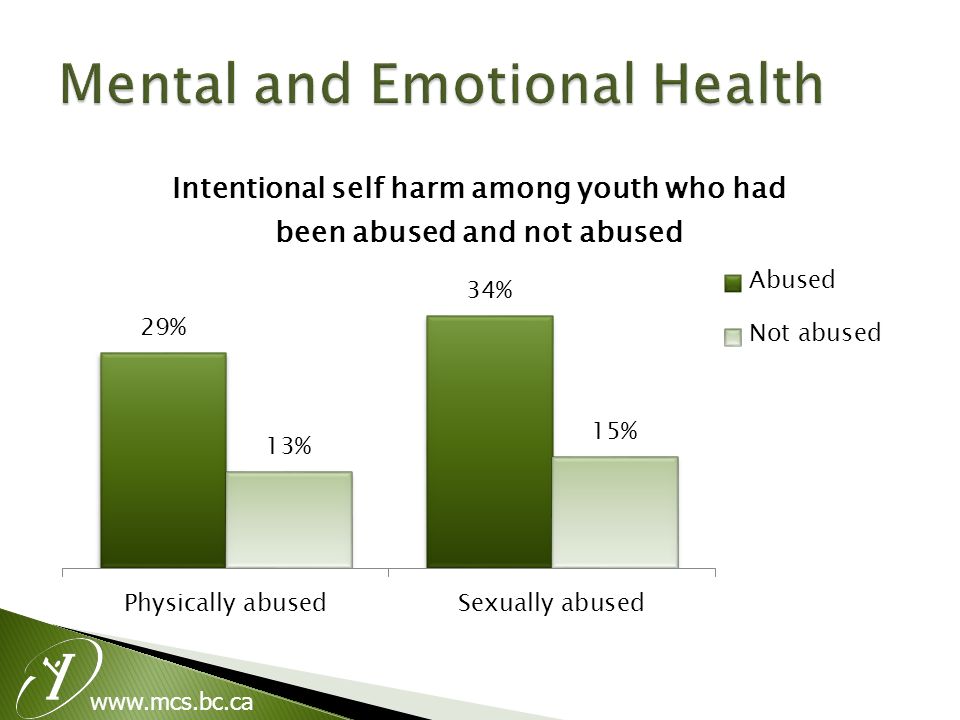
www.mcs.bc.ca No change in physical activity: only 1 in 4 males, 1 in 10 females exercise every day Suicidal thoughts and suicide attempts are lower for the first time since 1992 More than 1 in 5 females, 1 in 10 males reported deliberate self-harm

6
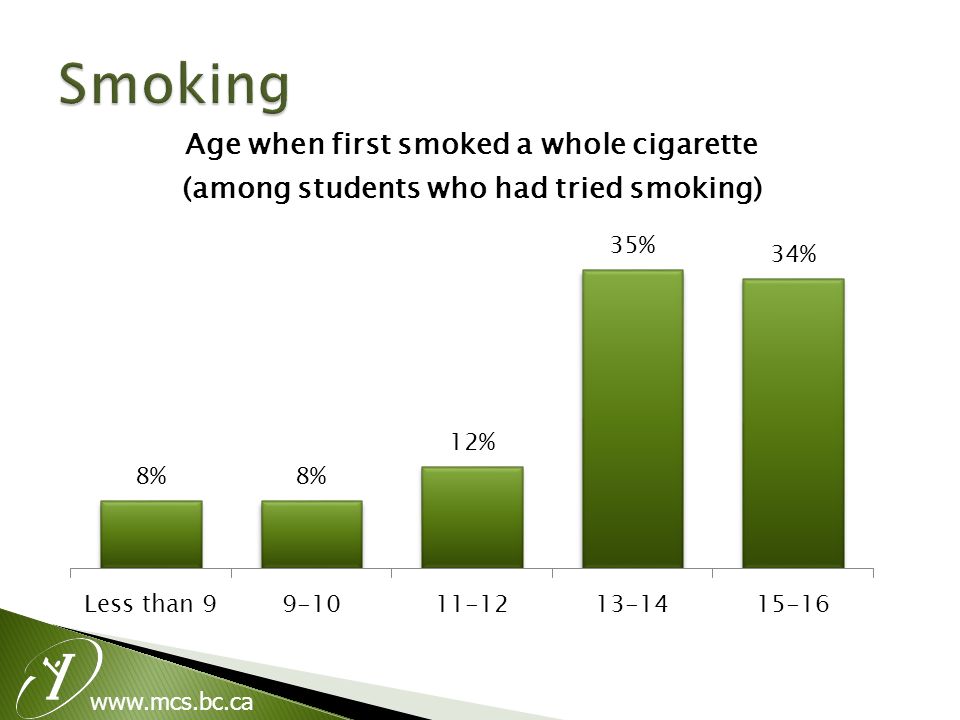
www.mcs.bc.ca Far fewer youth smoke than a decade ago, and those who do started at older ages Alcohol and marijuana use lower Fewer students had ever used cocaine, amphetamines, or mushrooms, continuing declines since 1998 But use of some other drugs, including hallucinogens like LSD, rose

7
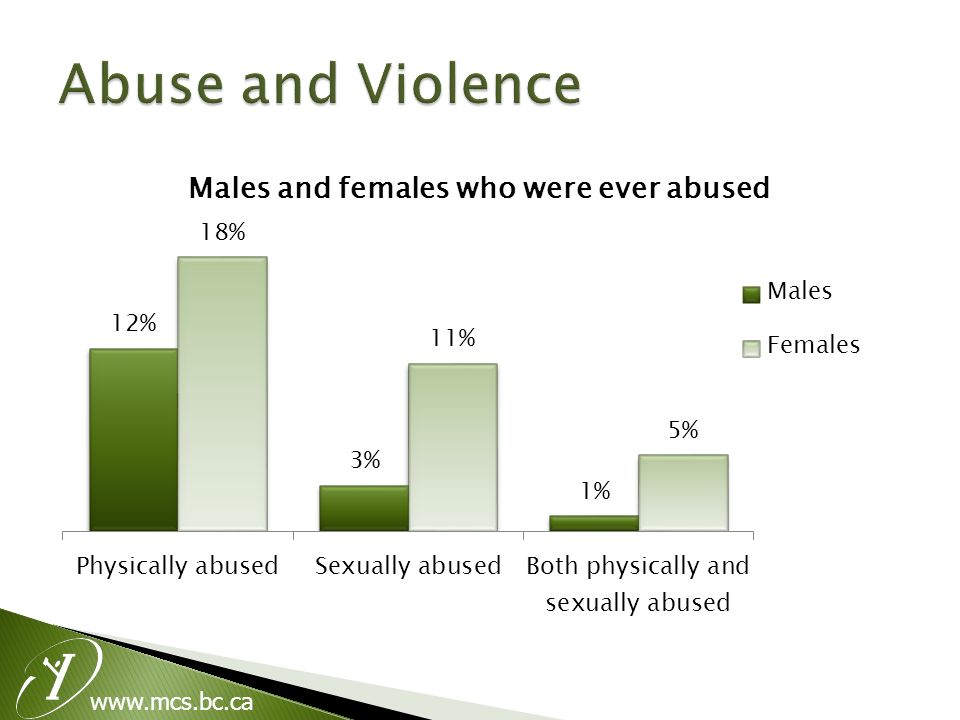
www.mcs.bc.ca Relationship violence is unchanged since 2003; 9% of males, 6% of females Pregnancy rates also stable, less than 2% Reversing trends in physical and sexual abuse, after declines since 1992 Protective factors can help even the most vulnerable youth overcome risks

8
www.mcs.bc.ca Most BC teens are doing well, and report healthier behaviours than students 10 years ago

9
Vancouver – A Picture of Health www.mcs.bc.ca

10
Ethnic or Cultural background (Youth could mark all that apply) East Asian55% European20% Southeast Asian16% South Asian8% Latin/South/Central American3% Aboriginal/First Nations3% African2% West Asian2% Australian/Pacific Islander1% Other (excluding Canadian)1% Don’t know1%
 East Asian55% European20% Southeast Asian16% South Asian8% Latin/South/Central American3% Aboriginal/First Nations3% African2% West Asian2% Australian/Pacific Islander1% Other (excluding Canadian)1% Don’t know1%")
11
www.mcs.bc.ca Who youth live with most of the time? (Youth could mark all that apply) Mother92% Father68% Other adults related to me16% Stepfather3% Other adults not related to me 2% Stepmother1% Do not live with any adults1%
 Mother92% Father68% Other adults related to me16% Stepfather3% Other adults not related to me 2% Stepmother1% Do not live with any adults1%.")
12
Vancouver – A Picture of Health www.mcs.bc.ca

13
80% reported good or excellent health, consistent with results over the past decade. 6% of youth reported a debilitating health condition or disability.

14
www.mcs.bc.ca 14% of females and 9% of males did not get medical help when they felt they needed it.

15
www.mcs.bc.ca 18% of students were injured seriously enough in the past year to need medical attention.

16
www.mcs.bc.ca Injury Prevention 62% of youth always wore a seatbelt. 24% of students always wore a helmet while bike riding.

17
www.mcs.bc.ca What youth ate and drank yesterday No Yes, once Yes, twice or more Water5%17%78% Milk, cheese, yogurt16%40%44% Fruit17%40%43% Green salad or vegetables19%40%41% Cookies, cake, donuts, chocolate bars 36%46%18% Pizza, hot dogs, potato chips, French fries 52%37%11% Pop/soda59%31%10% Hot or cold coffee or coffee-based drinks 75%18%7% Energy drinks93%5%2% At least 44% of youth fell short of the recommended daily portions of fruits and vegetables

18
www.mcs.bc.ca
19
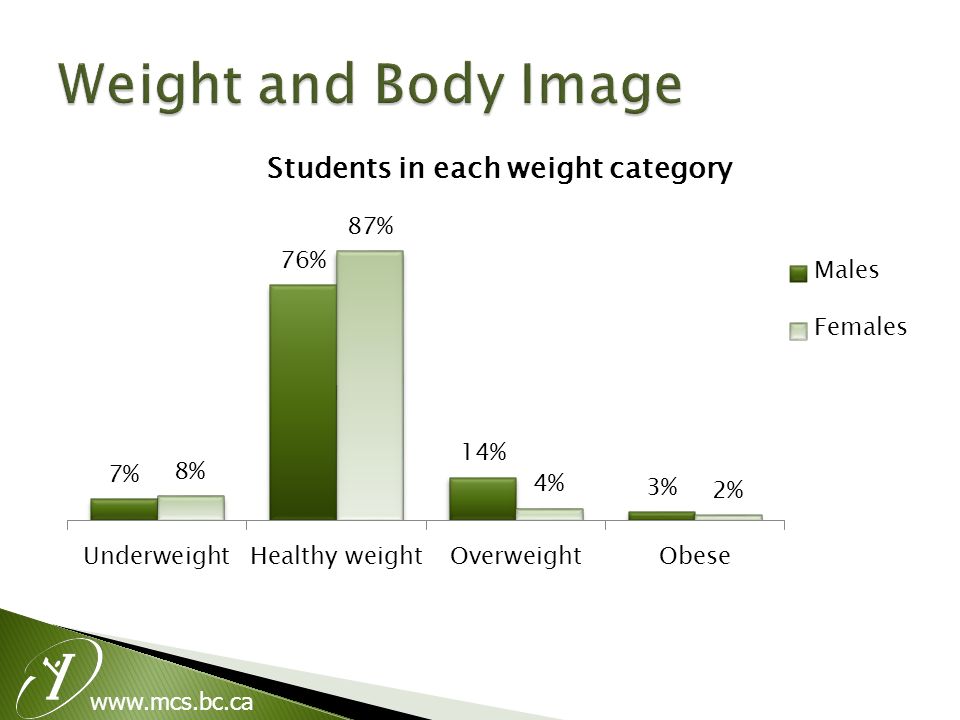
16% of males and 8% of females were very satisfied with their body image.

20
www.mcs.bc.ca
21
Vancouver – A Picture of Health www.mcs.bc.ca

27
Risk Factors for Suicide Attempts: Family or friend suicide attempts (18% vs. 3%) Sexual abuse (23% vs. 3%) Physical abuse (13% vs. 2%)
 Sexual abuse (23% vs. 3%) Physical abuse (13% vs. 2%).")
28
Vancouver – A Picture of Health www.mcs.bc.ca

29
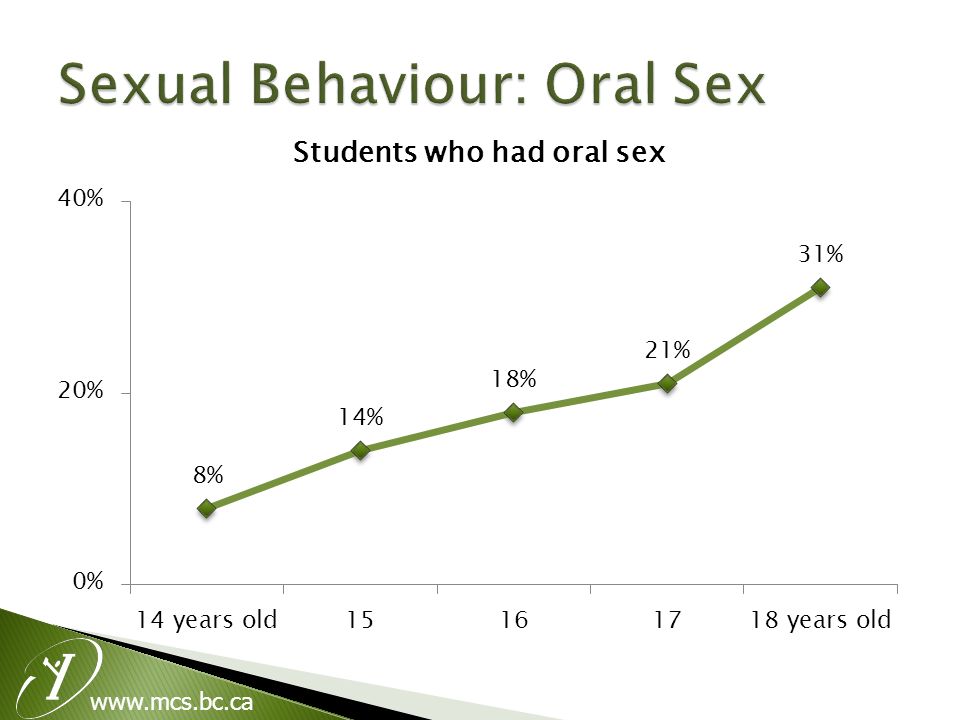
89% of youth never had sexual intercourse Most common reasons for not having sex: Not ready for sex (56%) Waiting to meet the right person (52%) Among those who had sex: Most commonly started at age 15 18% first had sex before age 14
 Waiting to meet the right person (52%) Among those who had sex: Most commonly started at age 15 18% first had sex before age 14")
30
www.mcs.bc.ca
31
Birth control method used last time youth had sex: Condoms: 63% Birth control pills: 27% Only withdrawal: 8% Emergency contraception: 10% 14% of sexually active students have been pregnant or caused a pregnancy

32
Vancouver – A Picture of Health www.mcs.bc.ca

34
Vancouver – A Picture of Health www.mcs.bc.ca

36
Note: The difference for wine consumption was not statistically significant.

37
www.mcs.bc.ca 2008 Prescription pills15% Any Hallucinogens (including ecstasy) 7% † Mushrooms5% † Cocaine5% Inhalants3% Any Amphetamines (including crystal meth) 2% Steroids2% Injected an illegal drug2% Heroin1% † Indicates that the difference between Vancouver and provincial estimates was statistically significant.
 7% † Mushrooms5% † Cocaine5% Inhalants3% Any Amphetamines (including crystal meth) 2% Steroids2% Injected an illegal drug2% Heroin1% † Indicates that the difference between Vancouver and provincial estimates was statistically significant.")
38
Vancouver – A Picture of Health www.mcs.bc.ca

40
Vancouver – A Picture of Health www.mcs.bc.ca

41
67% of students liked school “somewhat” Unlike the provincial picture, females were not more likely to like school very much (22%). Grade 7’s showed highest school connectedness vs. later grades

42
www.mcs.bc.ca
43
Vancouver – A Picture of Health www.mcs.bc.ca

44
Note: The gender difference for not exercising was not statistically significant.

45
www.mcs.bc.ca Note: The gender differences for art/drama/music, volunteering, and group/club were not statistically significant.

46
www.mcs.bc.ca

47
Vancouver – A Picture of Health www.mcs.bc.ca

48
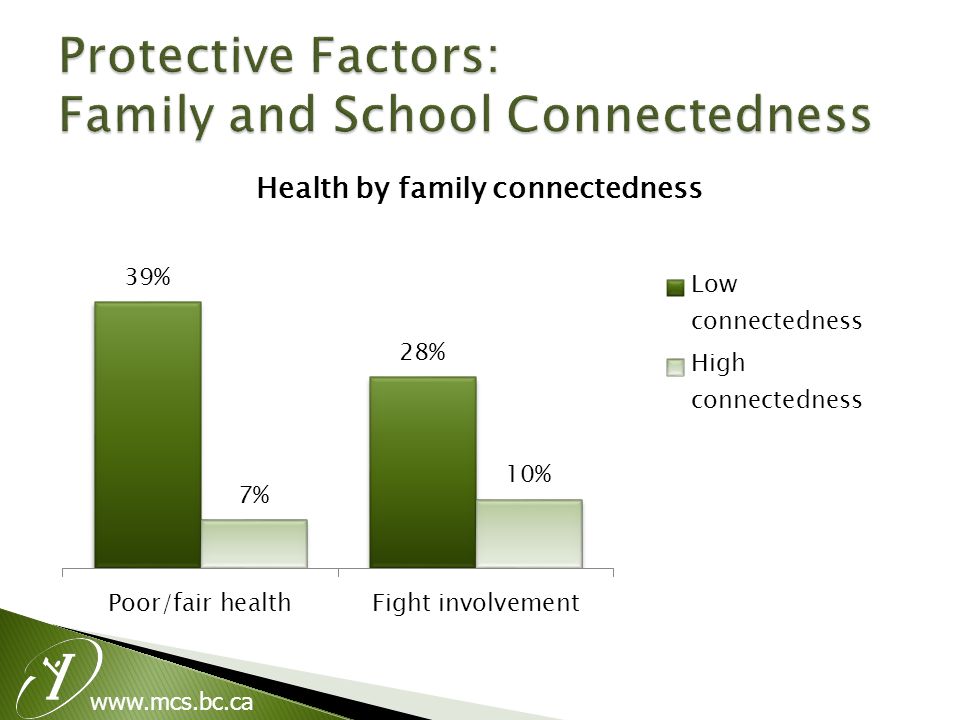
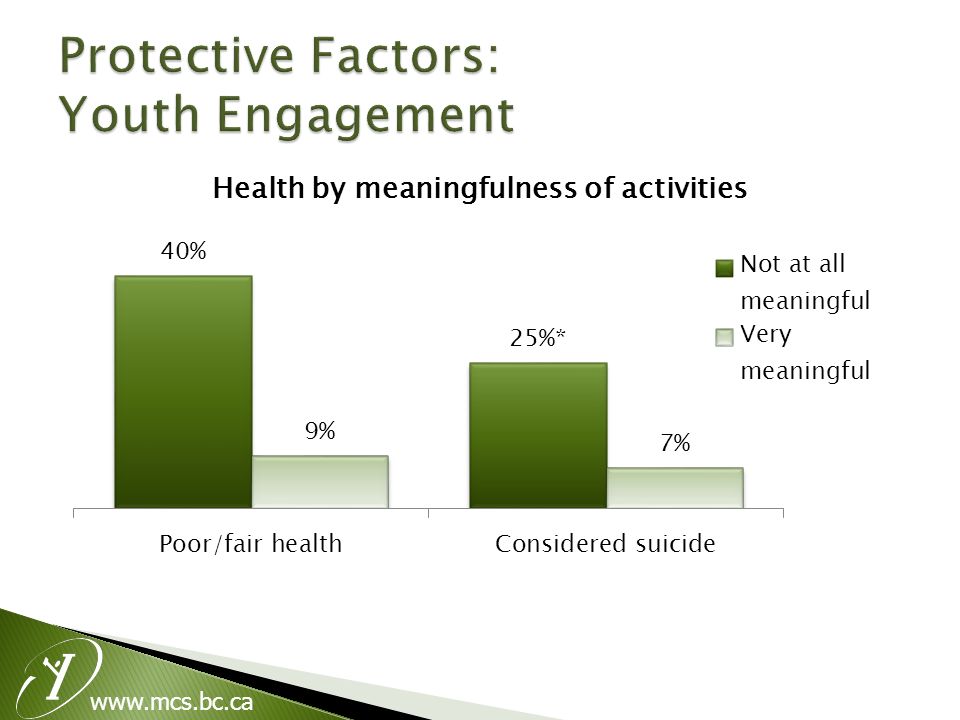
Having protective factors in their lives can promote health and reduce the negative effect of some risk behaviours. Protective factors in AHS School (e.g., school connectedness) Family (e.g., family connectedness) Community Connected to culture/ethnic group Youth engagement in activities Peer prosocial attitudes about risky behaviours Friends would disapprove of teen getting pregnant, getting drunk, beating someone up, etc.
 Family (e.g., family connectedness) Community Connected to culture/ethnic group Youth engagement in activities Peer prosocial attitudes about risky behaviours Friends would disapprove of teen getting pregnant, getting drunk, beating someone up, etc..")
49
www.mcs.bc.ca
51
A Picture of Health www.mcs.bc.ca

52
80% of youth in this area reported that their health was good or excellent. In the past year, 18% of students in this area were injured seriously enough to need medical attention. In terms of injury prevention, bicycle helmet use (among students who cycled) was similar to that across the province, whereas rates of driving after consuming alcohol were lower (5% vs. 10% provincially)
 was similar to that across the province, whereas rates of driving after consuming alcohol were lower (5% vs. 10% provincially).")
53
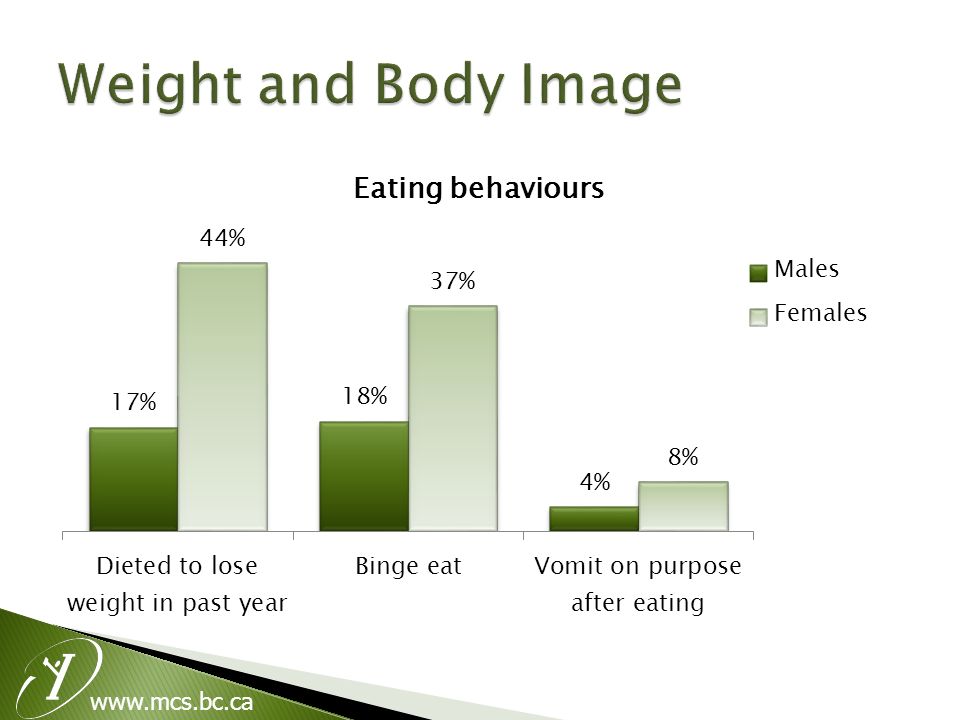
www.mcs.bc.ca 12% of youth did not get medical help when they felt they needed it. Among students who were a healthy weight, 55% of females were trying to lose weight and 28% of males were trying to gain weight. Ten percent of youth did not exercise at all during the past week. Compared to the entire province, youth in this area were more likely to participate in art, drama, and music activities as well as clubs or groups, but were less likely to participate weekly in sports activities or to cycle.

54
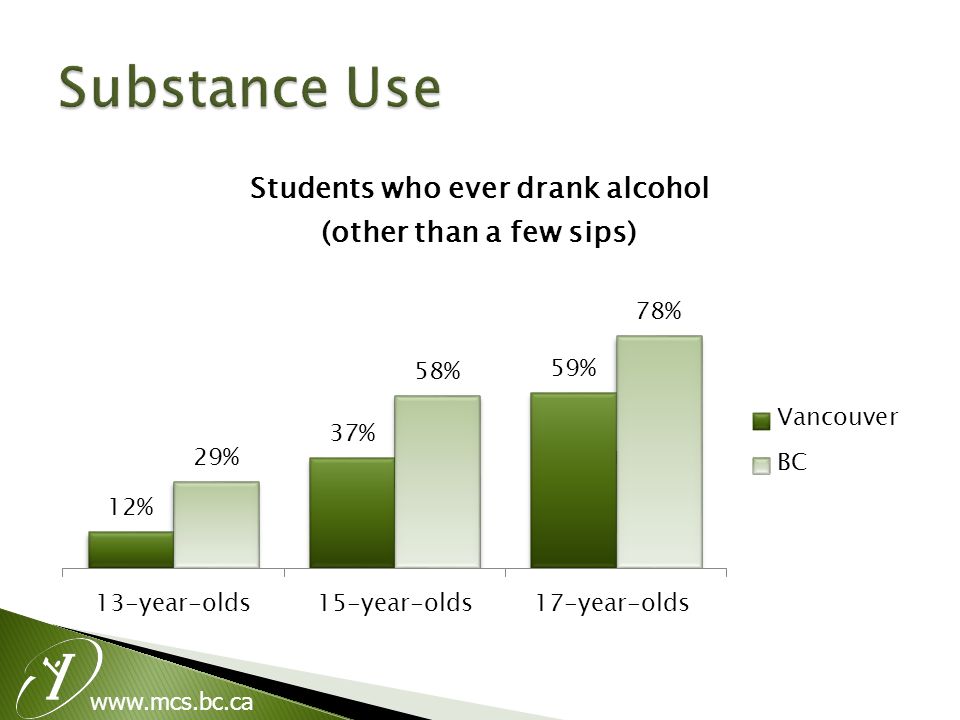
www.mcs.bc.ca The percentages of students who had tried smoking, alcohol or marijuana were all lower than the provincial rates. Among students in Vancouver who had tried alcohol, 34% binge drank in the past month. Students in this area were less likely to have had sex compared to students in the province as a whole. Although students in this area were less likely to have had sex, 14% of sexually active students reported that they have been pregnant or caused a pregnancy

55
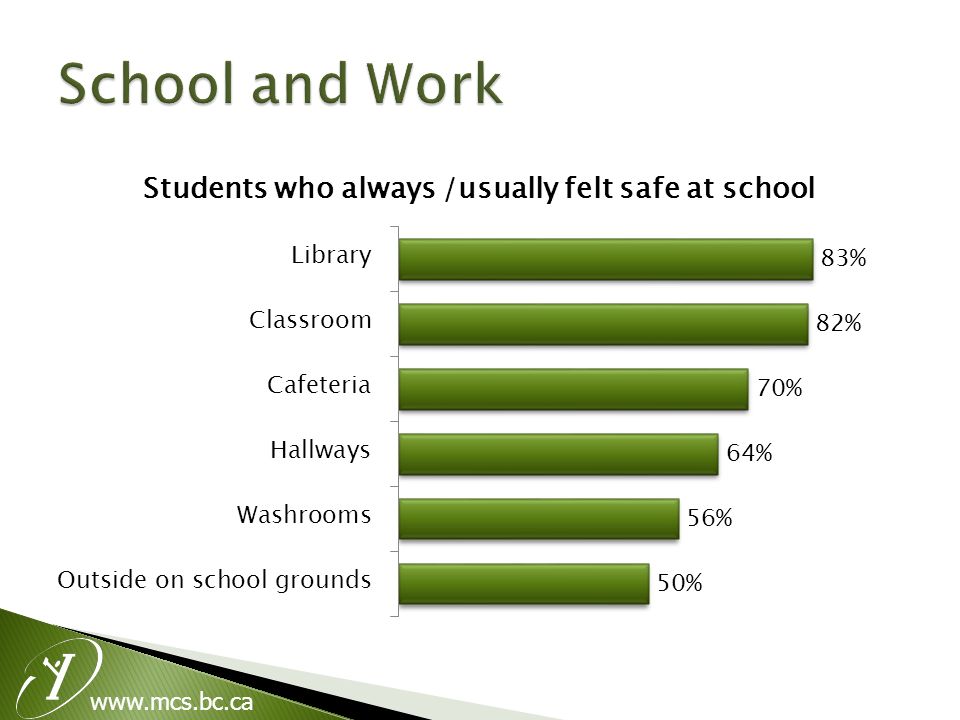
www.mcs.bc.ca The percentage of students who had been physically attacked or assaulted while at school or travelling to or from school in the past year was lower than the provincial rate, but they were less likely to report always feeling safe at school. Although many students felt they could seek support from adults both inside and outside of their family, the rates were lower than the province overall. Youth in this area reported higher levels of cultural connectedness. Compared to BC as a whole, local students were more likely to think that their friends would be upset with them if they got arrested, beat someone up, got drunk or used marijuana.

56
A Picture of Health

57
www.mcs.bc.ca 14 reports at HSDA level Additional in-depth reports (eg substance use) Fact sheets on key topics ‘Next Steps’ youth workshops and other resources for youth
 Fact sheets on key topics ‘Next Steps’ youth workshops and other resources for youth")
58
www.mcs.bc.ca McCreary Centre Society 3552 East Hastings Street Vancouver V5K 2A7 mccreary@mcs.bc.ca 604 291 1996

Similar presentations


 Pollard Middle School 2004 Student Risky Behaviors.>")


