Download presentation
Presentation is loading. Please wait.

1
(University Lille1/Polytech’Lille)
SunRise : Smart Urban Networks for Resilient Infrastructure & Sustainable Ecosystems Smart City Demonstrator Professor Isam Shahrour & Professor Ilan Juran Director, LGCgE Director W-SMART R&D Center (University Lille1/Polytech’Lille) Bruno Nguyen, President, W-SMART
 Bruno Nguyen, President, W-SMART.")
2
70 km Urban Network: Water (drinking and sewage) District heating Gas
Electrical Public lighting 70 km Urban Network:

3
Scientific City Campus
SWN: VITENS EAU DE PARIS EAUX DU NORD KWR Université de Lille CEA-List CALMWATER Small town: 110 Hectares users 70 km of Urban Network m2 of constructions

4
15 Kms of networks 49 hydrants 250 valves

5
Monitoring : 90 Automatic Meter Readings (AMRs)
")
6
Monitoring : 5 Pressure sensors

7
Monitoring District metered areas (DMA) (under construction)
 (under construction)")
8
Web platform (ISI for you)
Data collection system VHF 169 MHz GPRS Data retrieval Web platform (ISI for you)
")
9
Example of AMR reading

10
Water Consumption in the Campus (week-end)
High Consumption Low Consumption

11
Example of pressure variation

12
Hydraulic Modeling (EPANET)
")
13
“W- SMART” Water Security Management Academy for Research & Technology –University Industry Collaborative Research & Development Center University Lille-1 – W-SMART – KWR Research Institute – CEA LIST Institute

14
Leak detection methods
Analysis of the minimum night flow (MNF) measured District metered areas (DMA) Statistical analysis of historical data
 measured. District metered areas (DMA) Statistical analysis of historical data.")
15
Daily distributed volume
Leakage Detection Leakage detection with increasing average night flow and daily distributed volume Most of leakage detection are detected with the average night flow and confirmed with the daily distributed volume. Rising detection has to be correlated with operation events (it can be due to filling swimming pool for example). Average night flow Daily distributed volume
. Average night flow. Daily distributed volume.")
16
Limitation: Mirror Effect
Majority errors in analysis of the distribution data for leak detection are due to a default in the human identification of the mirror effect. Deficient flow-meter between two areas (volume transferred not measure) therefore “mirror effect” while the sub network curve of distributed water is not affected. Deficient flow-meter between two areas (volume transferred not measure) therefore “mirror effect” while the sub network curve of distributed water is not affected.
 therefore mirror effect while the sub network curve of distributed water is not affected. Deficient flow-meter between two areas (volume transferred not measure) therefore mirror effect while the sub network curve of distributed water is not affected.")
17
INCOM Leakage detection with virtuals sensors
Efficient 2011 Leakage detection with virtuals sensors INCOM The real-time sub-network distributed flow rate water is compared to the historical flow rate water for similar period A low and high threshold alarm system detect abnormal evolution of the sub-network water distribution F. Montiel, B. Nguyen – Eau de Paris -

18
AMR-DMA Pipe leakage detection example
Comparison between Daily water distributed volume trend and Daily water consumption volume trend in the same sub network. Daily water losses calculated trend in a sub network.

19
Command and Control System of Systems C2SOS
Multi-sensor Signal Multivariable Signature Recognition Sensor Anomaly Multi-spot Spatial System Integration Signature Recognition Sensor Health CIM - Database Sensors Severity Confidence Location Mitigation Existing SCADA, Monitoring, Database Tools - IGIS, BPRMS, Pattern Recognition, Simulator, Forcasting

20
Anomaly Prediction - Flow
Exceeds Expected but not Peak Actual Flow Predicted Flow Curves Detection Time Now Statistical Variance

23
Water Quality Management

24
On-Line Water Quality Control at Eau De Paris

25
Online real-Time water quality systems
Intellisonde S::can Optiqua These sensors will be tested Laboratory ⇨ m laboratory-scale distribution system In field ⇨ The choice of the site of city scientific of Lille 1

26
Laboratory pilot system
Total length = 61 m 16 mm opaque double layer pipes Diameter = 16mm. Measuring point Injection

27
S::can Optiqua 41m 61m Injection Water / Tank Sampling point
Drain / Treatment Optiqua 41m Intellisonde 61m

28
Display of Data from EDP Chlorscan Anomalies detected via C2SOS
Source: Bio-SMART & INCOM Projects – M17 Project Meeting Minutes

29
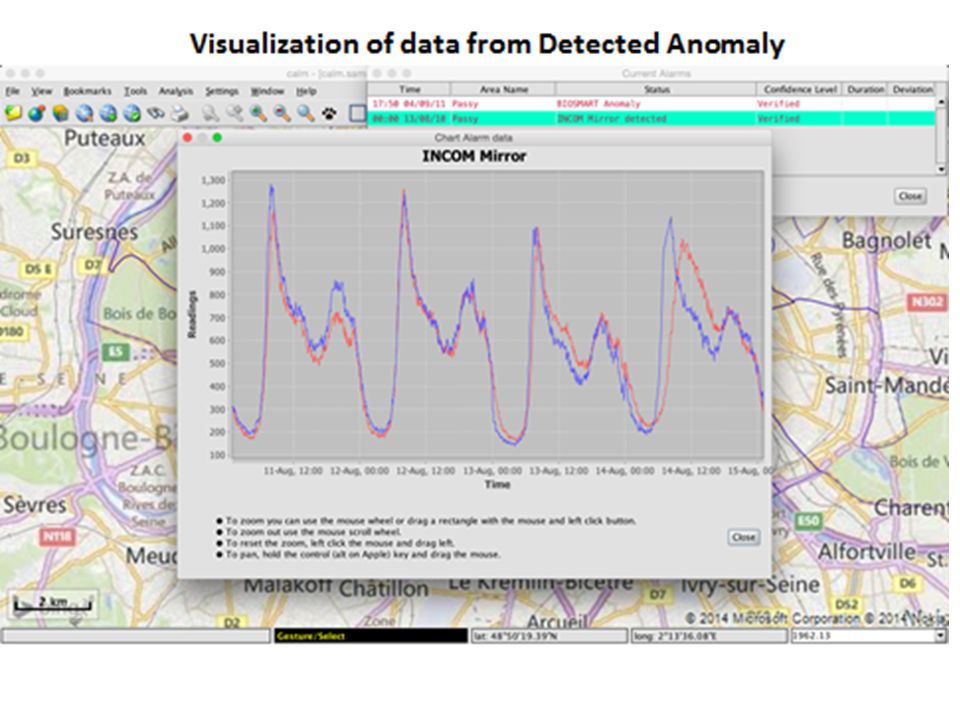
Alarming at Passy Source: Bio-SMART & INCOM Projects – M17 Project Meeting Minutes

31
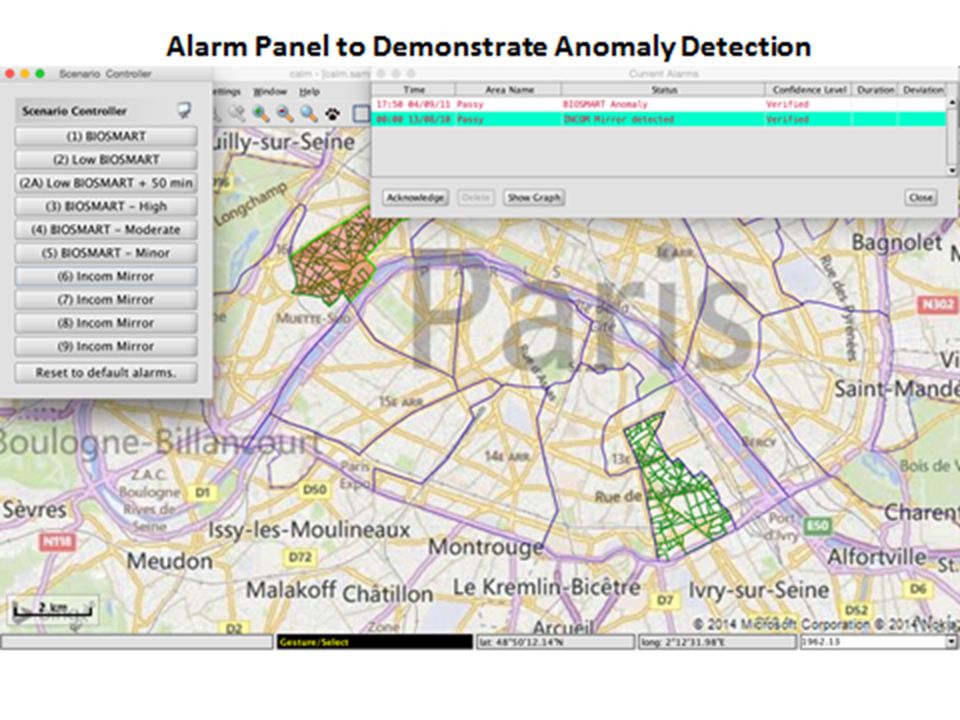
Scenario Controller and Alarm Panel
Source: Bio-SMART & INCOM Projects – M17 Project Meeting Minutes

32
Bio-Contamination Mitigation Decision Support System Demo-Illustration (W-SMART, 2009)
")
34
THANK YOU FOR YOUR ATTENTION

Similar presentations


 Web Tool for the advanced management of LV Network Trends in Power Industry in the European Context VIII Antonello.>")

>")


 and Advantica Ltd. (Outside USA). All rights reserved by the respective owner. Benefits of an Integrated Compliance.>")
 also known as Monitoring and Targeting (M&T) is the key to measuring.>")


 # 1.>")


 Pipe Network.>")

