Download presentation
Presentation is loading. Please wait.

1
CHAPTER 7 Ocean Circulation
Fig. CO7

2
Ocean currents Large-scale moving seawater Surface ocean currents
Transfer heat from warmer to cooler areas Similar to pattern of major wind belts Affect coastal climates Deep ocean currents Provide oxygen to deep sea Affect marine life

3
Types of ocean currents
Surface currents Wind-driven Primarily horizontal motion Deep currents Driven by differences in density caused by differences in temperature and salinity Vertical and horizontal motions

4
Measuring surface currents
Direct methods Floating device tracked through time Fixed current meter Indirect methods Pressure gradients Radar altimeters Satellites measuring bulges which are due to shape of ocean flow and currents Doppler flow meter (Acoustic Doppler Current Profiler) Measures shift in frequency of sound waves to determine current movement Fig. 7.1a
 Measures shift in frequency of sound waves to determine current movement. Fig. 7.1a.")
5
Measuring deep currents
Floating devices tracked through time Chemical tracers (radioactive isotopes) Tritium Chlorofluorocarbons Characteristic temperature and salinity Arrays of bottom monitors and cables
 Tritium. Chlorofluorocarbons. Characteristic temperature and salinity. Arrays of bottom monitors and cables.")
6
Surface currents Frictional drag between wind and ocean
Wind plus other factors such as… Distribution of continents Gravity Friction Coriolis effect cause Gyres or large circular loops of moving water

7
Ocean Gyres World’s 5 subtropical gyres: North Atlantic Gyre
South Atlantic Gyre North Pacific Gyre South Pacific Gyre Indian Ocean Gyre

8
When talking about location of currents, we refer to the ocean basin – not the land!
For instance, the Gulf Stream is a Western Boundary current of the North Atlantic Even though it runs along side the eastern US

9
Ocean gyres 3 2 4 1 4 2 Subtropical gyres
Center of each is about 30o N or S Major parts Equatorial currents flow west Western Boundary currents flow north or south Northern or Southern Boundary currents – push water east Eastern Boundary currents flow north or south 3

10
Other surface currents
Equatorial countercurrents flow east, counter to equatorial currents in the subtropical gyres As trade winds push equatorial current of subtropical gyre west, water builds up in western part of ocean basin Since coriolis effect is minimal at equator, that build-up of water then flows east at equator Subpolar gyres flow eastward Fig. 7.5

11
Other factors affecting surface currents
Ekman transport Geostrophic currents Western intensification of subtropical gyres All of these are connected Fig. 7.5

12
Ocean Circulation To view this animation, click “View” and then “Slide Show” on the top navigation bar.

13
Ekman spiral and transport
Surface currents move at angle to wind Ekman spiral describes speed and direction of seawater flow at different depths Each successive layer moves increasingly to right (N hemisphere) Initial push of water and then Coriolis effect comes into play
 Initial push of water and then Coriolis effect comes into play.")
14
Ekman spiral and transport
Average movement of seawater under influence of wind affected by Coriolis effect 90o to right of wind in Northern hemisphere 90o to left of wind in Southern hemisphere

15
Ekman Spiral and Coastal Upwelling/Downwelling
To view this animation, click “View” and then “Slide Show” on the top navigation bar.

16
Geostrophic flow Ekman transport piles up water within subtropical gyres Surface water flows downhill (gravity) and Also to the right (Coriolis effect) Balance of downhill and to the right causes net geostrophic flow around the “hill” Fig. 7.8
 and. Also to the right (Coriolis effect) Balance of downhill and to the right causes net geostrophic flow around the hill Fig")
17
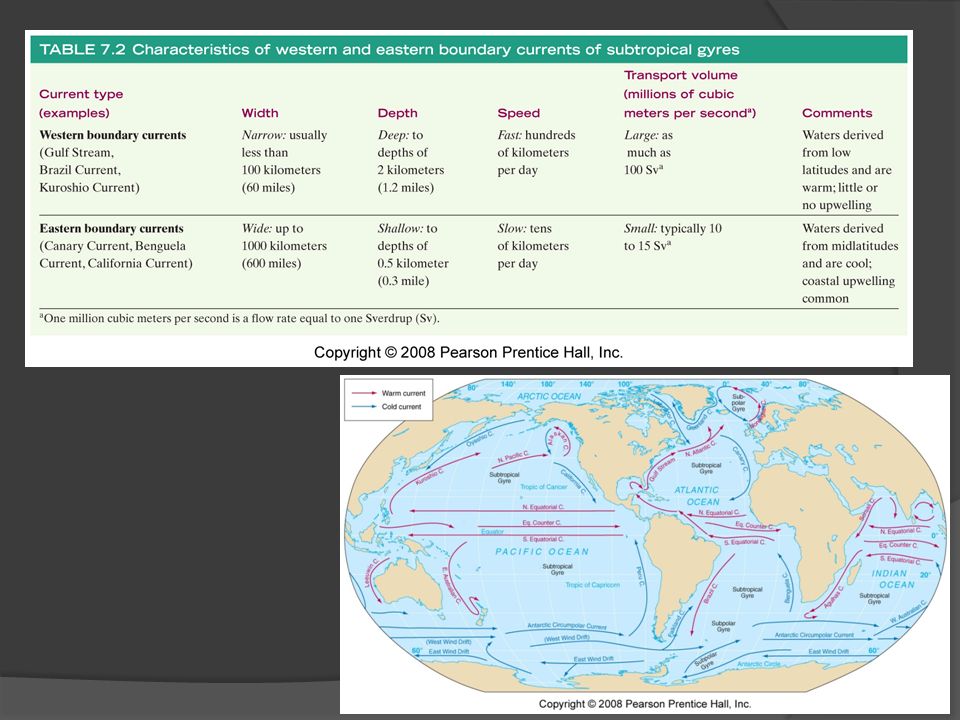
Western intensification
Top of hill of water displaced toward west due to Earth’s rotation water piles up on western side of gyre Western boundary currents intensified Faster Narrower Deeper Warm

18
Eastern Boundary Currents
Eastern side of ocean basins Tend to have the opposite properties of Western Currents Slow Wide Shallow Cold

20
Ocean currents and climate
Warm ocean currents warm air at coast Creates warm, humid air on coast Humid climate on adjoining landmass Cool ocean currents cool air at coast Cool, dry air Dry climate on adjoining landmass August temperatures February temperatures

21
Ocean currents and climate
August temperatures February temperatures Fig. 7.9

22
Diverging surface seawater
Divergence winds move surface seawater away from geographical equator due to Coriolis effect Deeper seawater (cooler, nutrient-rich) flows up to replace surface water Equatorial Upwelling High biological productivity Fig. 7.10
 flows up to replace surface water. Equatorial Upwelling. High biological productivity. Fig")
23
Converging surface seawater
Convergence surface seawater moves towards an area Surface seawater piles up Nutrient depleted surface water moves downward Downwelling Low biological productivity Occurs at center of gyres Fig. 7.11

24
Coastal upwelling and downwelling
Winds blowing down coasts Ekman transport moves surface seawater… onshore (downwelling) or… offshore (upwelling) Fig. 7.12
 or… offshore (upwelling) Fig")
25
Upwelling at higher latitudes
Remember there is no pycnocline at the poles Therefore, water moving towards the poles cools and becomes more dense, like all of the other water at the poles This allows there to be significant vertical mixing Very productive waters – this is where large animals (such as whales) go to feed
 go to feed.")
26
Antarctic circulation
Antarctic Circumpolar Current (West Wind Drift) Encircles Earth Transports more water than any other current East Wind Drift from polar easterlies Antarctic Divergence from opposite directions of west and east wind drifts Antarctic Convergence piles up and sinks below warmer sub-Antarctic waters Fig. 7.14
 Encircles Earth. Transports more water than any other current. East Wind Drift from polar easterlies. Antarctic Divergence from opposite directions of west and east wind drifts. Antarctic Convergence piles up and sinks below warmer sub-Antarctic waters. Fig")
27
Atlantic Ocean circulation
North Atlantic Subtropical Gyre Gulf Stream (GS) North Atlantic Current Canary Current (C) North Equatorial Current (NE) Merges with S. Equatorial current to form Antilles and Caribbean currents Converge to form Florida Current (F) thru Florida Strait May form Loop current into Gulf of Mexico Atlantic Equatorial Counter Current (EC) – between North and South Equatorial currents No. Atlantic current F
 North Atlantic Current. Canary Current (C) North Equatorial Current (NE) Merges with S. Equatorial current to form Antilles and Caribbean currents Converge to form Florida Current (F) thru Florida Strait. May form Loop current into Gulf of Mexico. Atlantic Equatorial Counter Current (EC) – between North and South Equatorial currents. No. Atlantic current. F.")
28
North Atlantic Subtropical Gyre
North Atlantic Subtropical Gyre Sargasso Sea Center of gyre – eddy Sargassum “weed” accumulates in convergence Provides habitat for many marine animals

29
Fig. 7.16

30
Atlantic Ocean circulation
South Atlantic Subtropical Gyre South Equatorial Current (SE) Brazil Current (Br) Antarctic Circumpolar Current (WW) Benguela Current (Bg) Fig. 7.14
 Brazil Current (Br) Antarctic Circumpolar Current (WW) Benguela Current (Bg) Fig")
31
Gulf Stream Best studied
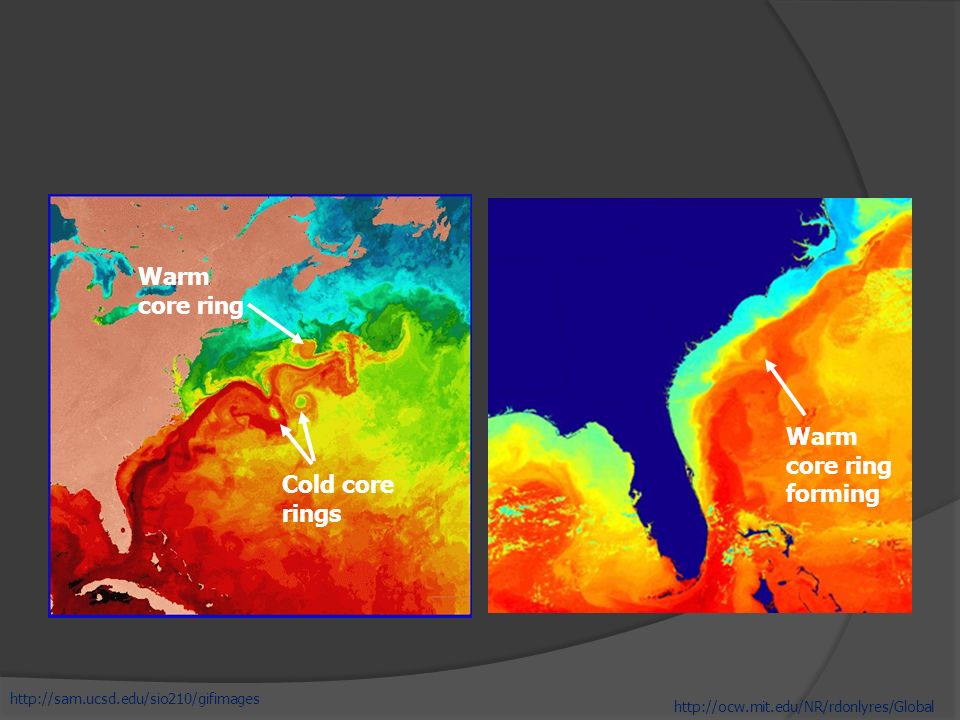
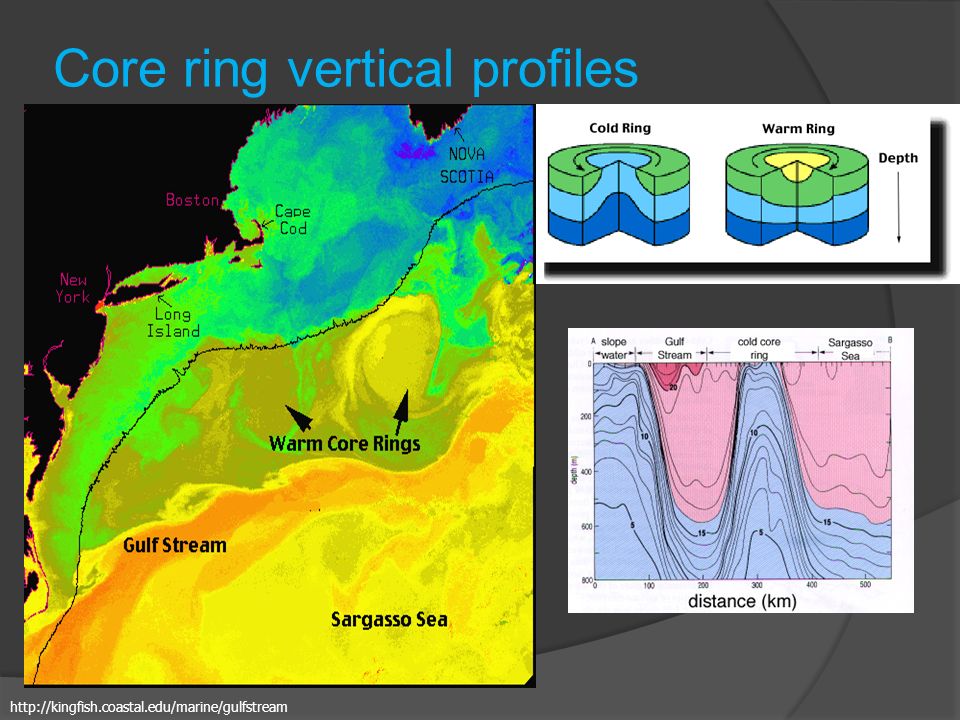
Meander is a bend in current may pinch off into a loop Warm-core rings form to north Cold-core rings form to south Unique biological populations Fig. 7.17b

32
Warm core ring Warm core ring forming Cold core rings
33
Core ring vertical profiles
34
Warm core ring off “Loop Current” in the Gulf of Mexico

35
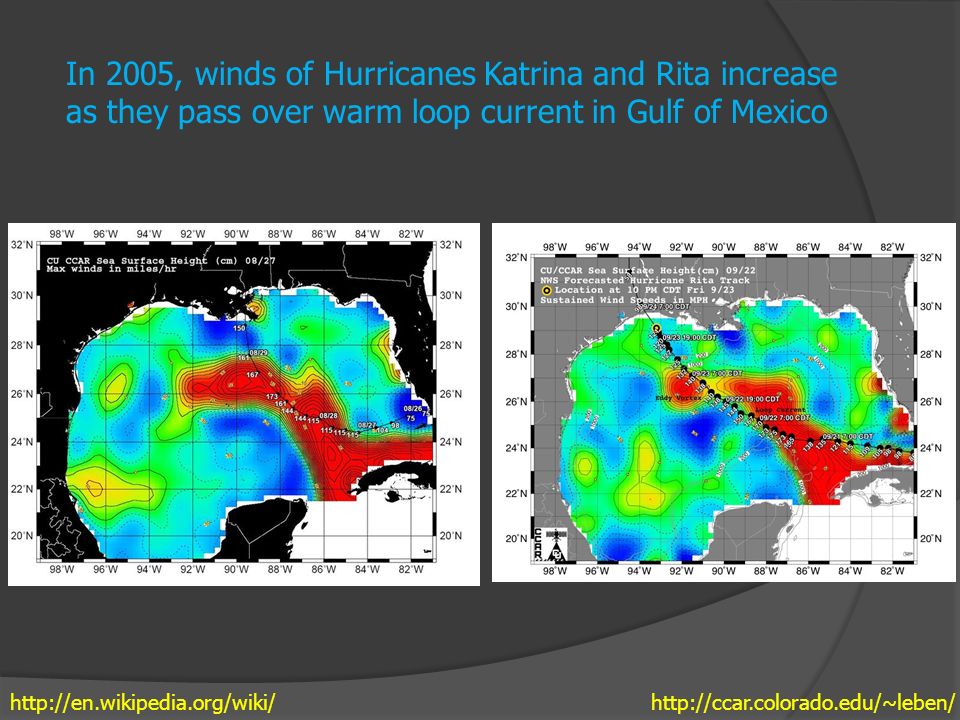
In 2005, winds of Hurricanes Katrina and Rita increase as they pass over warm loop current in Gulf of Mexico
36
Other North Atlantic currents
Labrador Current Irminger Current Norwegian Current North Atlantic Current

37
Climate effects of North Atlantic currents
Gulf Stream warms East coast of U.S. and Northern Europe North Atlantic and Norwegian Currents warm northwestern Europe Labrador Current cools eastern Canada Canary Current cools North Africa coast

38
Pacific Ocean circulation
North Pacific subtropical gyre Kuroshio North Pacific Current California Current North Equatorial Current Alaskan Current Fig. 7.19

39
Figure 7.19

40
Pacific Ocean circulation
South Pacific subtropical gyre East Australian Current Antarctic Circumpolar Current Peru Current South Equatorial Current Equatorial Counter Current

41
Relationship of sea surface temp and high altitude pressure
Atmospheric and oceanic disturbances in Pacific Ocean – El Niño-Southern Oscillation (ENSO) Relationship of sea surface temp and high altitude pressure Normal conditions Air pressure across equatorial Pacific is higher in eastern Pacific Strong southeast trade winds Pacific warm pool on western side Thermocline deeper on western side Upwelling off the coast of Peru bring nutrient-rich waters to surface As, you are looking at these figures pay attention to where thermocline is (remember that raising thermocline leads to upwelling which brings nutrients and oxygen-rich waters up to surface for organisms
 Relationship of sea surface temp and high altitude pressure. Normal conditions. Air pressure across equatorial Pacific is higher in eastern Pacific. Strong southeast trade winds. Pacific warm pool on western side. Thermocline deeper on western side. Upwelling off the coast of Peru bring nutrient-rich waters to surface. As, you are looking at these. figures pay attention to. where thermocline is. (remember that raising. thermocline leads to. upwelling which brings. nutrients and oxygen-rich. waters up to surface for. organisms.")
42
Normal conditions Fig. 7.20a

43
El Niño-Southern Oscillation (ENSO)
Warm (El Niño) High pressure in eastern Pacific weakens Weaker trade winds In strong El Nino events, trade winds can actually reverse Warm pool migrates eastward Thermocline deeper in eastern Pacific Downwelling lowers biological productivity in East Pacific Corals particularly sensitive to warmer seawater Fish kills
 High pressure in eastern Pacific weakens. Weaker trade winds. In strong El Nino events, trade winds can actually reverse. Warm pool migrates eastward. Thermocline deeper in eastern Pacific. Downwelling lowers biological productivity in East Pacific. Corals particularly sensitive to warmer seawater. Fish kills.")
44
El Niño and La Niña To view this animation, click “View” and then “Slide Show” on the top navigation bar.

45
El Niño-Southern Oscillation (ENSO)
Warm (El Niño) Produces heavy rains and flooding in equatorial western South America Droughts in western Pacific Droughts in Indonesia and Northern Australia
 Produces heavy rains and flooding in equatorial western South America. Droughts in western Pacific. Droughts in Indonesia and Northern Australia.")
46
Cool phase (La Niña) Increased pressure difference across equatorial Pacific – overshoots return to normal from El Niño Stronger trade winds Stronger upwelling in eastern Pacific Shallower thermocline Higher biological productivity Cooler than normal seawater Higher than normal hurricane season in Atlantic

47
El Niño-Southern Oscillation (ENSO) Cool phase (La Niña)
Fig. 7.20c

48
ENSO events El Niño warm phase about every 2 to 10 years
Highly irregular Phases usually last 12 to 18 months Fig. 7.22

49
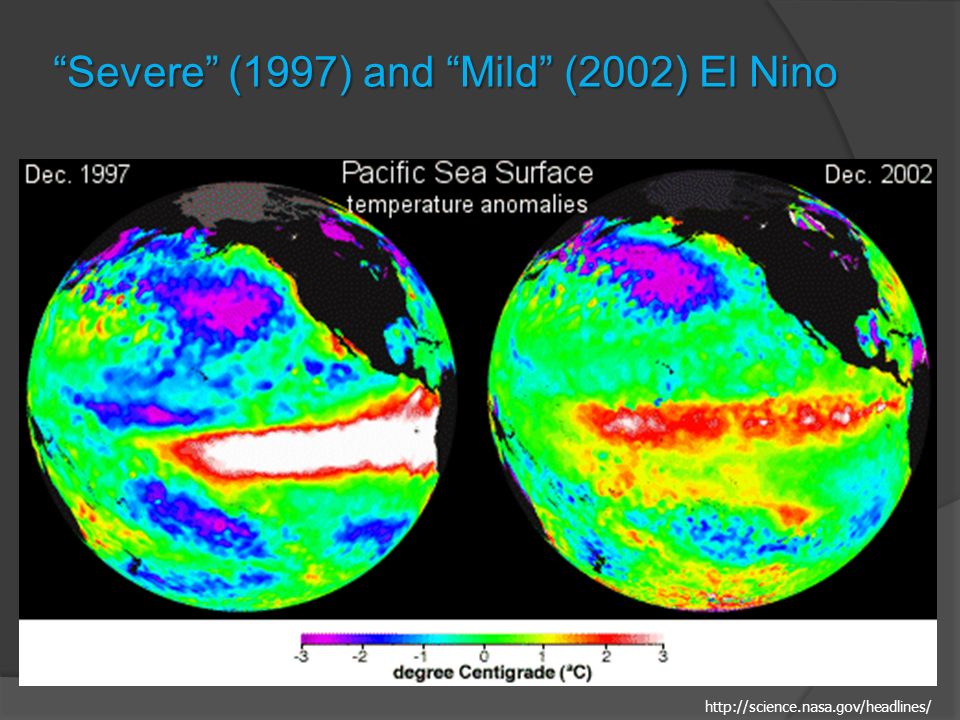
ENSO events Fig. 7.21 Strong events effect global weather
, Mild events only effect weather in equatorial South Pacific , , Effects of strong event can vary Can be drier than normal or wetter than normal Can be warmer than normal or cooler Can produce thunderstorms and tornados in midwest Can produce droughts in west Pushes jet stream eastward, pushing Atlantic hurricanes east, away from U.S. Less hurricanes reach US during El Nino, more during La Nina Flooding, drought, erosion, fires, tropical storms, harmful effects on marine life Examples: coral reef death in Pacific, crop failure in Philippines, increased cyclones in Pacific, drought in Sri Lanka Fig. 7.21

50
“Severe” (1997) and “Mild” (2002) El Nino
51
Freeze probability lower during La Nina
Freeze probability slightly higher during El Nino

52
Thermohaline circulation
Caused by density differences due to temp and salinity in different areas Below the pycnocline 90% of all ocean water Slow velocity

53
Thermohaline circulation
Bottom water formation Movement caused by differences in density (temperature and salinity) Formed by freezing saltwater dense brine sinks Cooler seawater denser Saltier seawater denser
 Formed by freezing saltwater dense brine sinks. Cooler seawater denser. Saltier seawater denser.")
54
Thermohaline circulation
Originates in high latitude surface ocean Near Greenland & Iceland in North Atlantic Weddell Sea Antarctic Bottom Water (coldest) Forms densest oceanic water flows on bottom Moves north in all three ocean basins Once surface water sinks (high density) it changes little Deep-water masses identified on T-S diagram
 Forms densest oceanic water flows on bottom. Moves north in all three ocean basins. Once surface water sinks (high density) it changes little. Deep-water masses identified on T-S diagram.")
55
Thermohaline circulation
Fig. 7.26

56
Thermohaline circulation
Selected deep-water masses Antarctic Bottom Water North Atlantic Deep Water Antarctic Intermediate Water Oceanic Common Water Cold surface seawater sinks at polar regions and moves equatorward

57
Conveyor-belt circulation
Combination deep ocean currents and surface currents Fig. 7.27

58
Ocean Circulation To view this animation, click “View” and then “Slide Show” on the top navigation bar.

59
Deep ocean currents Cold, oxygen-rich surface water to deep ocean
Dissolved O2 important for life and mineral processes Deep ocean currents do bring water across the equator Changes in thermohaline circulation can cause global climate change Example: warmer surface waters with increased melting of ice caps less dense surface waters Bottom water will not form and sink Gulfstream may be altered long-term cooling, particularly in northern Europe less oxygen deep ocean

60
Misconceptions Earth events taking place within the global environment are not interconnected, such as El Nino is not important to people living in the midwest. Humans are the only cause of global warming. The greenhouse effect will cause all living things to die.

61
Ocean Literacy Principles
1c - Throughout the ocean there is one interconnected circulation system powered by wind, tides, the force of the Earth’s rotation (Coriolis effect), the Sun, and water density differences. The shape of ocean basins and adjacent land masses influence the path of circulation. 1d - Sea level is the average height of the ocean relative to the land, taking into account the differences caused by tides. Sea level changes as plate tectonics cause the volume of ocean basins and the height of the land to change. It changes as ice caps on land melt or grow. It also changes as sea water expands and contracts when ocean water warms and cools. 3a - The ocean controls weather and climate by dominating the Earth’s energy, water and carbon systems. 3b - The ocean absorbs much of the solar radiation reaching Earth. The ocean loses heat by evaporation. This heat loss drives atmospheric circulation when, after it is released into the atmosphere as water vapor, it condenses and forms rain. Condensation of water evaporated from warm seas provides the energy for hurricanes and cyclones. 3c - The El Niño Southern Oscillation causes important changes in global weather patterns because it changes the way heat is released to the atmosphere in the Pacific. 3d - Most rain that falls on land originally evaporated from the tropical ocean. 3f - The ocean has had, and will continue to have, a significant influence on climate change by absorbing, storing, and moving heat, carbon and water. 3g - Changes in the ocean’s circulation have produced large, abrupt changes in climate during the last 50,000 years.
, the Sun, and water density differences. The shape of ocean basins and adjacent land masses influence the path of circulation. 1d - Sea level is the average height of the ocean relative to the land, taking into account the differences caused by tides. Sea level changes as plate tectonics cause the volume of ocean basins and the height of the land to change. It changes as ice caps on land melt or grow. It also changes as sea water expands and contracts when ocean water warms and cools. 3a - The ocean controls weather and climate by dominating the Earth’s energy, water and carbon systems. 3b - The ocean absorbs much of the solar radiation reaching Earth. The ocean loses heat by evaporation. This heat loss drives atmospheric circulation when, after it is released into the atmosphere as water vapor, it condenses and forms rain. Condensation of water evaporated from warm seas provides the energy for hurricanes and cyclones. 3c - The El Niño Southern Oscillation causes important changes in global weather patterns because it changes the way heat is released to the atmosphere in the Pacific. 3d - Most rain that falls on land originally evaporated from the tropical ocean. 3f - The ocean has had, and will continue to have, a significant influence on climate change by absorbing, storing, and moving heat, carbon and water. 3g - Changes in the ocean’s circulation have produced large, abrupt changes in climate during the last 50,000 years.")
62
Sunshine State Standards
SC.8.P.8.4 Classify and compare substances on the basis of characteristic physical properties that can be demonstrated or measured; for example, density, thermal or electrical conductivity, solubility, magnetic properties, melting and boiling points, and know that these properties are independent of the amount of the sample. SC.912.E.7.2 Analyze the causes of the various kinds of surface and deep water motion within the oceans and their impacts on the transfer of energy between the poles and the equator. SC.912.P Describe heat as the energy transferred by convection, conduction, and radiation, and explain the connection of heat to change in temperature or states of matter

Similar presentations


>")

 EarthsClimate_Web_Chapter.pdfEarthsClimate_Web_Chapter.pdf, p. 22-24.>")


>")
 above Earth. Densest – N, O, & water vapor Stratosphere->")