Download presentation
Presentation is loading. Please wait.

1
Chapter 53 Population Ecology

2
53.1 Dynamic biological processes influence population density, dispersion, and demographics

3
Population Population- a group of individuals of a single species living in the same general area Three fundamental characteristics of a population Density Dispersion Demographics

4
Density and Dispersion
Scientists have begun investigating the boundaries of a population. They may be natural or arbitrarily defined Density – the number of individuals per unit area or volume Dispersion – the pattern of spacing among individuals within the boundaries of the population

5
Density Almost impossible to actually count the number of individuals
Some ecologists will estimate and extrapolate Mark-Recapture method Density is not a static property Immigration- the movement of organisms into an area Emigration- the movement of organisms out of the area

6
Patterns of Dispersion
Clumped – sea stars grouping together where food is abundant Uniform – penguins maintaining almost equal spacing due to aggressive interactions between neighbors Random – dandelions growing wherever the seeds land and germinate

7
(a) Clumped (b) Uniform (c) Random
 Clumped (b) Uniform (c) Random")
8
Demographics Demography – the study of vital statistics of populations and how they change over time Life tables Survivorship curves

9
Life Tables Age-specific summaries of the survival pattern of a population Best way to construct one is to follow the fate of a cohort from birth until death A group of individuals of the same age

10
Survivorship Curves A graphing method of representing the data in a life table Three different types of patterns Type I- flat to start then drops steeply Humans and other mammals Type II – steady decline Squirrels Type III – drops sharply at the start Oysters

11
Survivorship Curves Number of survivors (log scale) 1,000 I 100 II 10
50 100 Percentage of maximum life span

12
Reproductive Rates Demographers typically ignore males and focus on females A reproductive table (fertility schedule) is an age specific summary of the reproductive rates in a population. Tallies the number of female offspring produced by each age group
 is an age specific summary of the reproductive rates in a population. Tallies the number of female offspring produced by each age group.")
13
53.2- Life history traits are products of natural selection

14
Natural selection favors traits of organisms that allow them to survive longer and reproduce
Life history- the trait that affects an organism’s schedule of reproduction and survival Start of reproduction How often reproduction occurs Amount of offspring per reproduction cycle

15
Evolution and Life History Diversity
One-shot reproduction Semelparity- one big reproduction of offspring (big bang reproduction) Iteroparity- offspring over many years 2 critical factors: Survival rate of offspring Likelihood hood that adults will live to reproduce again
 Iteroparity- offspring over many years. 2 critical factors: Survival rate of offspring. Likelihood hood that adults will live to reproduce again.")
16
Evolution and Life History Diversity
Semelparity if offspring aren’t likely to survive long Iteroparity if the environment is favorable to the adults

17
“Trade-offs” and Life Histories
Natural selection cannot maximize all reproduction variables simultaneously Time, energy, and nutrients limit reproduction of organisms Trade-offs between survival and reproduction Selective pressures between number of offspring and size of offspring Parent care and learn through 1st year makes an impact

18
53.3- The Exponential Model Describes Population Growth in an Idealized, Unlimited Environment

19
Potential to expand if resources are right
Reveals capacity of species for increase and conditions under which capacity may be expressed

20
Per Capita Rate of Increase
Population will increase with births and emigrations Populations will decrease with deaths and immigration Change in population= (birth + immigration) – (deaths + emigrations)
 – (deaths + emigrations)")
21
Per Capita Rate of Increase
Per capita birth rate- number of offspring produced by an average member of the population Per capita death rate- expected number of deaths per a unity of time Most interested in the difference between the death and birth rates

22
Per Capita Rate of Increase
R=b-d R is the indication whether a given population is growing or declining Zero population growth (ZPG) the birth and death rates equal zero
 the birth and death rates equal zero.")
23
Exponential Growth Exponential population growth- population increase under ideal conditions J-shaped curved Can mean the introduction to a new environment Numbers that have been affected by a catastropic event

24
53.4 The logistic model describes how a population grows more slowly as it nears its carry capacity

25
Exponential growth model assumes that resources are unlimited
Not the case in the real world Carrying capacity (K) – the maximum population size that a particular environment can sustain
 – the maximum population size that a particular environment can sustain.")
26
The Logistic Growth Model
The per capita rate of increase approaches zero as the carrying capacity is reached 𝑑𝑁 𝑑𝑡 = 𝑟 𝑚𝑎𝑥 𝑁 (𝐾−𝑁) 𝐾 Will produce an s-shaped curve
 𝐾. Will produce an s-shaped curve.")
27
Exponential growth 2,000 = 1.0N 1,500 K = 1,500 Population size (N)
dN = 1.0N dt 1,500 K = 1,500 Population size (N) Logistic growth 1,000 dN 1,500 – N = 1.0N dt 1,500 500 5 10 15 Number of generations
 Logistic growth. 1,000. dN. 1,500 – N. = 1.0N. dt. 1, Number of generations.")
28
1,000 180 150 800 120 Number of Paramecium/mL 600 Number of Daphnia/50 mL 90 400 60 200 30 5 10 15 20 40 60 80 100 120 140 160 Time (days) Time (days) (a) A Paramecium population in the lab (b) A Daphnia population in the lab
 Time (days) (a) A Paramecium population in the lab. (b) A Daphnia population in the lab.")
29
Logistic Model and Real Populations
The logistic model assumes that populations will adjust instantaneously This is not typically the case This will cause a population to temporarily overshoot the carrying capacity Allee effect- individuals may have a more difficult time surviving or reproducing if the population size is too small

30
Logistic Model and Life Histories
K-selection- density dependent Operates in populations living at a density near their carrying capacity R-selection- density independent Traits that maximize reproductive success in uncrowded environments

31
53.5 Many factors that regulate population growth are density dependent

32
Population Change and Population Density
Density independent populations will have birth and death rates that will not change with density Density dependent populations will have birth and death rates that will rise and fall with density

33
Density-Dependent Population Regulation
Without some type of negative feedback between population density and the rates of birth and death, a population will never stop growing. Competition for resources Increasing population density competing for declining nutrients will lead to a lower birth rate Toxic Wastes The accumulation of toxic waste can effect population size Intrinsic Factors In some cases the physiological factors rather than the environmental factors will influence the population size

34
Continued Territoriality Disease Predation
Territory spaces becomes a resource in which individuals compete for. Disease If the transmission rate of a certain disease depends on the crowding in a population, density will be effected Predation A predator encounters and captures more food as the density of the prey increases

35
Territoriality (a) Cheetah marking its territory (b) Gannets
 Cheetah marking its territory (b) Gannets")
36
Predation 50 2,500 Wolves Moose 40 2,000 30 1,500 Number of wolves
Number of moose 20 1,000 10 500 1955 1965 1975 1985 1995 2005 Year

37
Population Dynamics Focuses on the complex interactions between the biotic and abiotic factors that cause variation in the size of populations Populations of large mammals were once thought to remain stable over time, this is not the case

38
Immigration, Emigration, and Metapopulations
Immigration and emigration can also affect populations Metapopulation- a group of spatially separated populations of one species that interact through immigration and emigration Local populations can be thought of as occupying small patches of suitable environment within a sea of unsuitable habitat Patches will vary in size, quality, and isolation from other patches There are many factors that will influence how patches interact

39
Chapter 54 Community Ecology

40
54.1 Community interactions are classified by whether they help, harm, or have no effect on the species involved

41
Competition Interspecific competition – has a negative effect on the survival and reproduction of the predator population and a negative effect on that of the prey population. Occurs when individuals of different species compete for a resource that limits their growth and survival. ie. Weeds compete from soil nutrients and water. Grasshoppers vs. bison for grass they both eat.

42
Competition: Competitive Exclusion
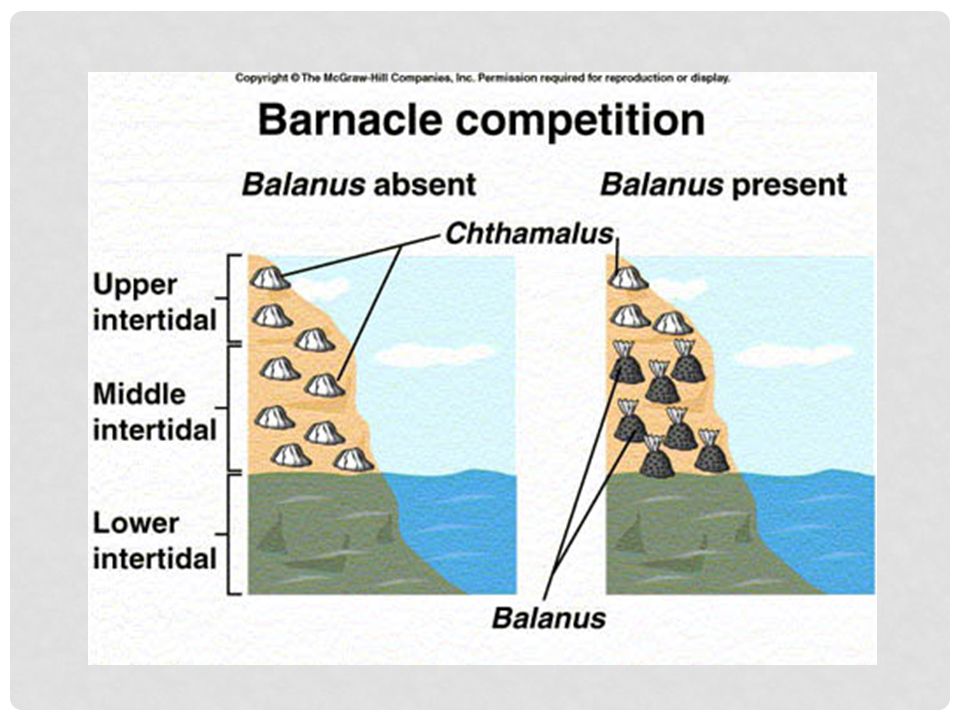
Two species competing for the same limiting resources cannot coexist in the same place. Without disturbances, one species will use the resource more efficiently and reproduce more rapidly than the other. The slight reproductive advantage will eventually lead to local elimination of the inferior competitor. This is called competitive exclusion.

43
Competition: Ecological Niches
Ecological niche – the sum of a species’ use of the biotic and abiotic resources in its environment. An organism’s niche is its ecological role , how it “fits into” an ecosystem. Two species cannot coexist permanently in a community if their niches are identical. However, ecologically similar species can coexist in a community if there are more significant differences in their niches. Resource partitioning – the differentiation of niches that enables similar species to coexist in a community.

44
Competition: Ecological Niches
A species’ fundamental niche (the niche potentially occupied by that species) is often different from its realized niche (portion of its fundamental niche that it actually occupies). The fundamental niche of a species can be identified by testing the range of conditions in which it grows and reproduces without competitors. Also test if a potential competitor limits a species’ realized niche by removing the competitor and seeing if the first species going into the newly available space.
 is often different from its realized niche (portion of its fundamental niche that it actually occupies). The fundamental niche of a species can be identified by testing the range of conditions in which it grows and reproduces without competitors. Also test if a potential competitor limits a species’ realized niche by removing the competitor and seeing if the first species going into the newly available space.")
46
Competition: Character Displacement
Allopatric – geographically separate Sympatric – geographically overlapping In some cases, the allopatric populations of species are morphologically similar and use similar resources. In contrast, sympatric populations show differences in body structures and in the resources they use. This tendency for characteristics to diverge more in sympatric populations of two species is character displacement.

47
Predation A positive predator population survival and reproduction activity with negative prey population survival and reproduction activity. Both predators and prey have adaptations that help eat, and help avoid being eaten such as claws, teeth, heat sensing organs, and poison while prey can hide, alert, flee, or form herds/schools.

48
Predation Animals display a variety of morpholocial and physiological defensive adaptations. Cryptic coloration (camouflage) – makes prey difficult to spot Aposematic coloration (warning) – animals with effective chemical defenses often show this. Batesian mimicry – a palatable or harmless species mimics a harmful model. Mullerian mimicry – two or more unpalatable species resemble each other. Each species gains and additional advantage because the more unpalatable prey they are, the more quickly avoid them as prey.
 – makes prey difficult to spot. Aposematic coloration (warning) – animals with effective chemical defenses often show this. Batesian mimicry – a palatable or harmless species mimics a harmful model. Mullerian mimicry – two or more unpalatable species resemble each other. Each species gains and additional advantage because the more unpalatable prey they are, the more quickly avoid them as prey.")
49
Batesian mimicry

50
Mullerian mimicry

51
Cryptic coloration

52
Aposematic coloration

53
Herbivory Positive predator survival and reproduction with negative prey survival and reproduction. Used for when an organism eats parts of a plant or alga. Specialized adaptations like chemical sensors enabling them to distinguish toxic from nontoxic plants to eat. Prey relies on toxins or spikes and thorns.

54
Symbiosis Symbiosis – when individuals of two or more species live in direct and intimate contact with one another.

55
Symbiosis: Parasitism
Positive predator survival and reproduction and negative prey survival and reproduction. A parasite derives its nourishment from another organism, the host. Endoparasites – parasites that live within the body of their host. Ectoparasites – parasites that fee on the external surface of a host. Parasites can significantly affect the survival, reproduction, and density of their host population (directly or indirectly).
.")
56
Symbiosis: Mutualism Benefits both species.
Sometimes involve the evolution of related adaptations in both species, with changes in either species likely to affect the survival and reproduction of the other.

57
Symbiosis: Commensalism
Benefits one species but neither harms nor helps the other. Difficult to document in nature because any close association between species likely affects both species if only slightly. Some associations that are possibly commensal involve one species obtaining food that is inadvertently exposed by another.

58
54.2 Dominant and keystone species exert strong controls on community structure

59
Species Diversity The variety of different kinds of organisms that make up the community is the species diversity of a community. One component is species richness – number of different components. Other is relative abundance – the proportion each species represents of all individuals in the community. Often calculate an index of diversity based on species richness and relative abundance. (Shannon diversity)
")
60
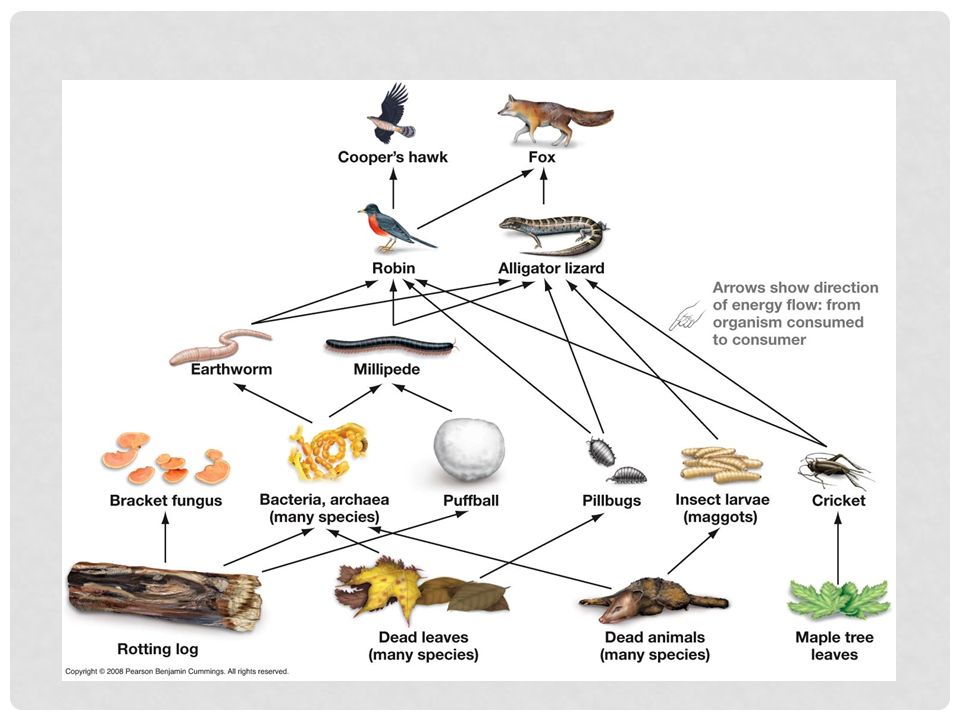
Trophic Structure The structure and dynamics of a community depend to a large extent on the feeding relationships between organisms (trophic structure). Food chain – transfer of food energy up the trophic levels.
. Food chain – transfer of food energy up the trophic levels.")
61
Trophic Structure: Food Webs
Arrows linking species according to who eats whom. A given species may weave into the web at more than one trophic level. Species are grouped with similar trophic relationships in a given community into broad functional groups.

63
Trophic Structure: Limits on Food Chain Length
Energetic hypothesis – the length of a food chain is limited by the inefficiency of energy transfer along the chain. Only about 10% of the energy stored in the organic matter of each trophic level is converted to organic matter at the next trophic level. Dynamic stability hypothesis – long food chains are less stable than short chains. The longer a food chain is, the more slowly top predators can recover from environmental setbacks so food chains should be shorter in unpredictable environments. The size of a carnivore and its feeding mechanism put some upper limit on the size of food it can take which can limit the food chain length limit.

64
Species with a Large Impact: Dominant Species
Dominant species – species in a community that are most abundant or that collectively have the highest biomass. Exert a powerful control over the occurrence and distribution of other species. Dominance could be a result of exploiting limited resources, or successfully avoiding predation. One way to discover the impact of a dominant species is to remove it form the community.

65
Species with a Large Impact: Keystone Species
Keystone species- not necessarily abundant in a community. Exert strong control on community structure but not by numerical might but by their pivotal ecological niches. One way to look at the impact is to remove the keystone species. Highlights the importance of a keystone species in maintaining the diversity of a community.

66
Species with a Large Impact: Foundation Species (Ecosystem “Engineers”)
Some organisms exert their influence on a community by causing physical changes in the environment. Such organisms may alter the environment through their behavior or their large collective biomass. The effects of foundation species can be positive or negative on other species depending on the needs of the other species. By altering the structure or dynamics of the environment, foundation species sometimes act like facilitators. They have positive effects on the survival and reproduction of other species in the community.

67
Disturbance influences species diversity and composition
54.3 Disturbance influences species diversity and composition

68
A disturbance is an event that changes a community by removing organisms from it or altering resource availability. (flood, hurricane, fire, drought, overgrazing, or human activity) The emphasis on change has produced the nonequilibrium model (most communities are constantly changing after being affected by disturbances).
 The emphasis on change has produced the nonequilibrium model (most communities are constantly changing after being affected by disturbances).")
69
Characterizing Disturbance
Types of disturbances and their frequency and severity vary from community to community. The intermediate disturbance hypothesis states the moderate levels of disturbance can create conditions that foster greater species diversity than low or high levels of disturbance. At the low end, low levels of disturbance can reduce species diversity by allowing competitively dominent species to exclude less competitive species.

70
Ecological Succession
Ecological succession – the disturbed area may be colonized by a variety of species, gradually replaced by another species who are then also gradually replaced. Primary succession – process begins in a virtually lifeless area. Often only life-forms present are autotrophic prokaryotes and heterotrophic prokaryotes and protists. Secondary succession – when an existing community has been cleared by some disturbance that leaves the soil intact.

71
Human Disturbance Humans have the greatest impact on biological communities worldwide. Reduces species diversity in many communities. Human disturbance is often severe. Agriculture development, ocean trawling, cutting a forest, and cattle grazing.

72
54.4- Biogeographic Factors Affect Community Biodiversity

73
Influences on a diverse community:
Species interaction Dominate species Types of disturbances Biogeographic factors have the largest impact range

74
Latitudinal Gradient Plants and animals are most diverse in the topics
2 key factors: evolutionary history and climate Species diversity may increase as more speciation occurs in a community Climate is likely the primary cause Solar radiation and water availability

75
Latitudinal Gradient Evapotranspiration- evaporation of water from the soil as well as the transpiration of water by plants Potential evapotranspiration is a measure of potential water loss Determined by solar radiation and temperature Species richness correlates with both types evapotranspiration

76
Area Effects Species-area curve- biodiversity pattern; shows that the larger the geographic area of a community is, the more species it has Proposed by Alexander von Humboldt Slope indicates the richness increase

77
Island Equilibrium Model
Islands are isolated and have limited sizes New colonization Rate of immigration Rate of extinction Affects on immigration/extinction: distance from mainland and size Equilibrium will eventually be met between extinction and immigration

78
54.5- Community Ecology is Useful for Understanding Pathogen Life Cycle and Controlling Human Disease

79
Pathogens- disease-causing microorganisms, viruses, viroid, or prions
Pathogens have universal affects on ecosystems Alter community structure quickly

80
Pathogens and Community Structure
Coral reefs are easily affected Terrestrial ecosystems are also affected by pathogens A reason for studying: human transportation via activities Can be transferred around the world

81
Community Ecology and Zoonotic Diseases
Zoonotic pathogens- pathogens transferred from other animals to humans Direct contact Intermediate species called vector Need to understand parasite life cycle and be able to track the spread of zoonotic diseases

82
Community Ecology and Zoonotic Diseases
Community interactions are the underlying sources between pathogen/host interactions Changes in environment have an affect on pathogen interactions

83
Essays Name and describe the types of symbiosis. Give examples.
Name and explain the two models of growth. Use examples of both Draw type I, II, and III survivorship curves on a graph with labeled axes. Explain why the growth rate of species with a type I survivorship curve depends primarily on fertility rates. Explain why the growth rate of species with a type III survivorship curve is extremely sensitive to changes in adult survivorship.

Similar presentations