Download presentation
Presentation is loading. Please wait.

1
Physical development of children. Anthropometry Topic 5-6

2
Physical DEVELOPMENT: Neuropsychological biological

3
Stages: The measurement of anthropometric data The estimation of physical development

4
Methods of anthropometry

5
І. Адекватне обчислення віку дата обстеження – дата народження Закруглення віку до повного місяця або року ± 0,5 року або місяця

6
Weight, body mass. Index of physical growth; Index of quality of nutrition; Sign of some diseases; Symptom of dehydratation; Symptom of excessive hydratation, fluid retention.

7
Weight, body mass. Index of physical growth; Index of quality of nutrition; Sign of some diseases; Symptom of dehydratation; Symptom of excessive hydratation, fluid retention.

8
Physical growth estimation

9
Weight, body mass. Index of physical growth; Index of quality of nutrition; Sign of some diseases; Symptom of dehydratation; Symptom of excessive hydratation, fluid retention.

10
Physical growth estimation

11
Empirical formulas for: Length Height Body mass Circumferences

12
Infant body length Birth to 6 months: L = L birth + 3 * а (cm) –7-12 months: L = 64 + а, –where “а” age in months Other method - –Before 6 mnts:66 – 2,5 х (6-а) (cm) –After 6 mnts : 66 + 1,5 х (а-6)
 –7-12 months: L = 64 + а, –where а age in months Other method - –Before 6 mnts:66 – 2,5 х (6-а) (cm) –After 6 mnts : ,5 х (а-6)")
13
Infant weight Birth to 6 months: W = W birth + 800 * а (g) –3-12 months: W = (9 + а)/2 (kg), –where “а” age in months Other method - –at 6 mnts: W birth * 2 –at 12 mnts : W birth * 3
 –3-12 months: W = (9 + а)/2 (kg), –where а age in months Other method - –at 6 mnts: W birth * 2 –at 12 mnts : W birth * 3")
14
- Bounds - 7-10% - Rough estimate of body dimensions - For prompt use

16
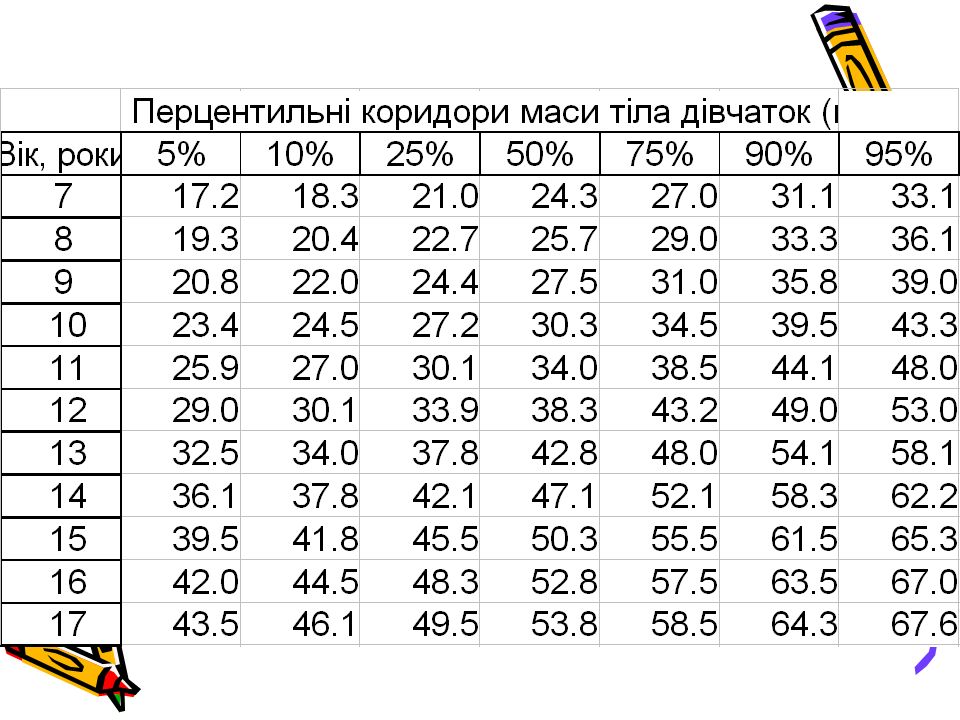
Methods of anthropometric stadards: -Accuracy -Reliability -Objectivity Types of anthropometric stadards: -Parametric (sigmal, regression) -Nonparametric (percentile)
 -Nonparametric (percentile)")
17
± 1 σ ± 2 σ ± 3 σ Mean

18
1 % 50 % 100 %

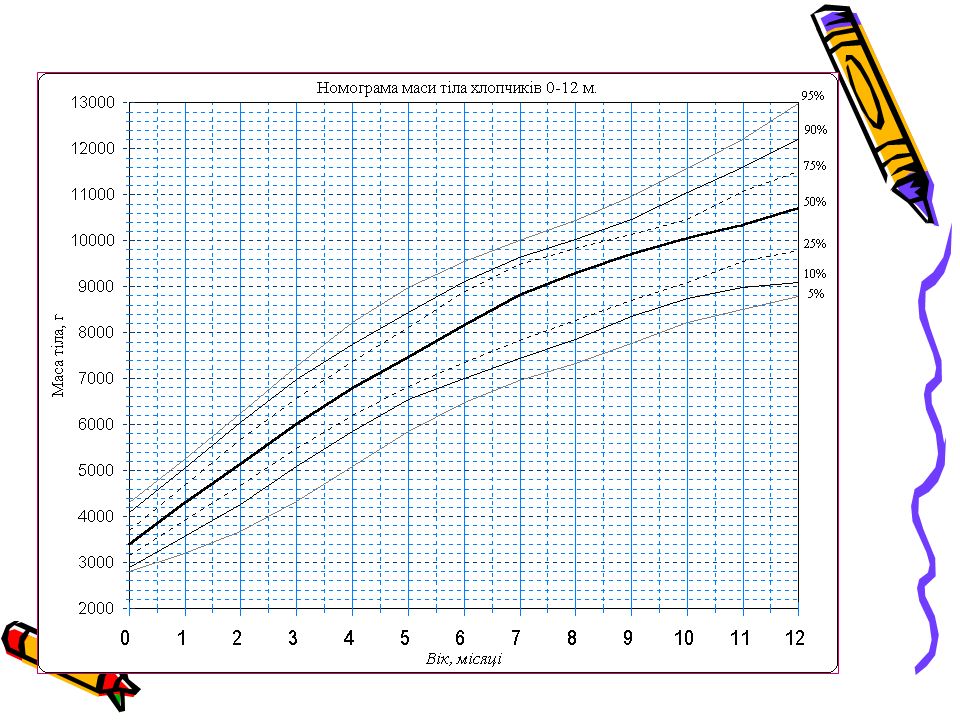
19
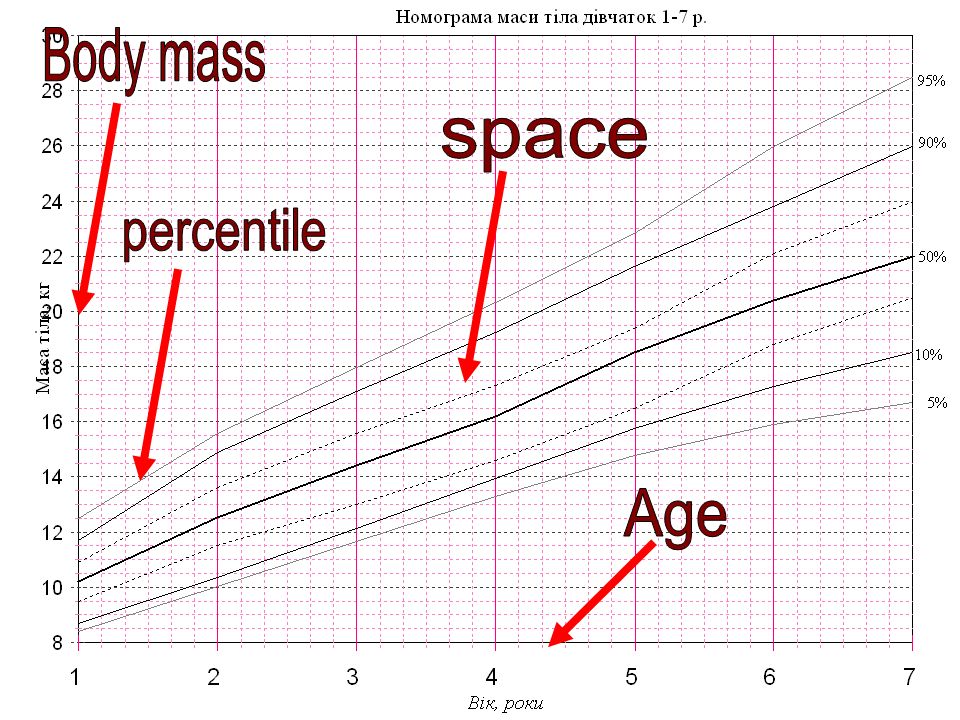
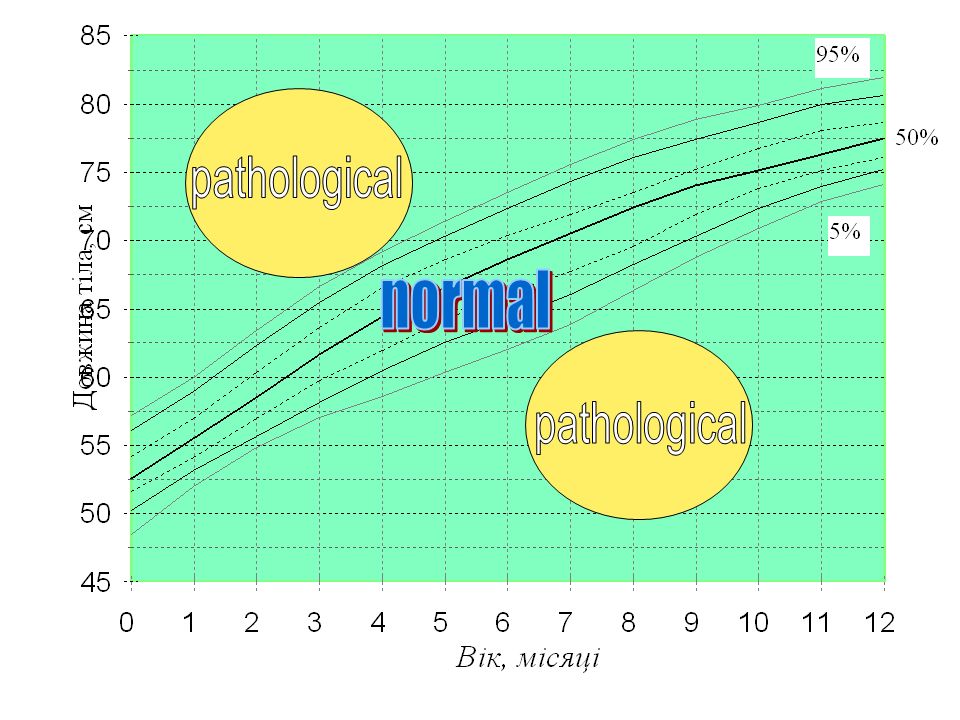
Centum = 100 All anthropometric data of special children group (separated by age and gender) are divided for 100 intervals. 2 types – percentile tables percentile charts

24
Anthropometric indexes

25
Height (in cm) – body mass (in kg) =100 Index Brauquas Body mass index - BMI BMІ = W / H 2 (kg/m 2 ).
 – body mass (in kg) =100 Index Brauquas Body mass index - BMI BMІ = W / H 2 (kg/m 2 ).")
26
Body mass deficiency Body mass excess

27
Hypotrophy, leanness I degree < 11 – 20 % II degree < 21 – 30 % III degree < 30 %

28
Obesity І degree: > 10-29% ІІ degree : > 30-49% ІІІ degree : > 50-100% IV degree : > 100%

Similar presentations


.>")
 Definitions: Obesity: having a very high amount of body fat in relation to lean body mass, or Body Mass Index.>")

 and understand its scope and effects Share who some of the.>")

 Adult Nutrition.>")
, or Quetelet index, is a measure for human body shape based on an individual's weight and height.>")


-for-age Growth Charts: A Training for Health Care Provider Assistants Adapted by the CHDP Bay Area Nutrition Subcommittee.>")


