Download presentation
Presentation is loading. Please wait.

1
Longitudinal Study to Measure Effects of MSP Professional Development on Improving Math and Science Instruction: Year 3 Update Report MSP-RETA Project (2002 – 05)
")
2
A collaborative study conducted by: Council of Chief State School Officers (CCSSO) American Institutes for Research (AIR) Wisconsin Center for Educational Research (WCER)
 American Institutes for Research (AIR) Wisconsin Center for Educational Research (WCER)")
3
Goals for This Workshop Demonstrate Online, Web-based Tools – Surveys of Enacted Curriculum (SEC) – Professional Development Activity Log -- PD Quality Items and Scales [see pdf] MSP Study Design –Sample of Teachers –Longitudinal Findings Provide information and access
![Goals for This Workshop Demonstrate Online, Web-based Tools – Surveys of Enacted Curriculum (SEC) – Professional Development Activity Log -- PD Quality Items and Scales [see pdf] MSP Study Design –Sample of Teachers –Longitudinal Findings Provide information and access](http://images.slideplayer.com/23/6815345/slides/slide_3.jpg "Goals for This Workshop Demonstrate Online, Web-based Tools – Surveys of Enacted Curriculum (SEC) – Professional Development Activity Log -- PD Quality Items and Scales [see pdf] MSP Study Design –Sample of Teachers –Longitudinal Findings Provide information and access")
4
Study Questions / Objectives Effects of MSP vs. Other PD on Improving Instruction ? Use of Hi Quality Survey tools to Evaluate PD Quality? Disseminate to MSPs, Other users

5
MSP PD Study Sites Brockport/Rochester – SUNY Cleveland Municipal SD Corpus Christi – AIMS - TX A&M El Paso – UTEP [see survey data] State MSPs: ID, IL, OR, OK, ME, MT, Boston Also: NJ MSP -- 12 districts – Rutgers NC MSP 17 districts – UNC SW PA MSP SCALE – Los Angeles
![MSP PD Study Sites Brockport/Rochester – SUNY Cleveland Municipal SD Corpus Christi – AIMS - TX A&M El Paso – UTEP [see survey data] State MSPs: ID, IL, OR, OK, ME, MT, Boston Also: NJ MSP districts – Rutgers NC MSP 17 districts – UNC SW PA MSP SCALE – Los Angeles](http://images.slideplayer.com/23/6815345/slides/slide_5.jpg "MSP PD Study Sites Brockport/Rochester – SUNY Cleveland Municipal SD Corpus Christi – AIMS - TX A&M El Paso – UTEP [see survey data] State MSPs: ID, IL, OR, OK, ME, MT, Boston Also: NJ MSP districts – Rutgers NC MSP 17 districts – UNC SW PA MSP SCALE – Los Angeles")
6
Project Staff Leadership PI –Rolf Blank, CCSSO Co-PIs –Bea Birman & Mike Garet (AIR) –Andy Porter, Vanderbilt University –John Smithson (WCER) PD –Kwang Suk Yoon (AIR) Year 3 Report available on www.SECsurvey.org / Projectswww.SECsurvey.org For more info...
 –Andy Porter, Vanderbilt University –John Smithson (WCER) PD –Kwang Suk Yoon (AIR) Year 3 Report available on / Projectswww.SECsurvey.org For more info...")
7
MSP Study Logic Model During MSP Program Professional Development Experiences Type Duration Collective Participation Active Learning Coherence Content Focus Before MSP Program Instructional Practice Content, Activities, & Strategies Controlling for Teacher Characteristics Background Variables Target Class Students Diversity Program Characteristics Emphasis Year 1Year 2Year 3Year 0 Professional Development Activity Log (PDAL) Survey of Enacted Curriculum (SEC) Wave 1 Professional Development Experiences After MSP Program Instructional Practices Analyze alignment change– Instruction w/ Stands. Survey of Enacted Curriculum (SEC) Wave 2 Professional Development Experiences
 Wave 2 Professional Development Experiences.")
8
Longitudinal Analysis – 4 MSPs — Early Findings—Treatment vs. comp For more info... More PD time, content focus Math Content: increased depth, decreased perform procedures Math Practices: inc. communicating understanding Science Practices: inc. multiple assessment Science Content: inc Applying scientific Concepts, decr. Memorization expectation.

9
MSP RETA – Reports on line www.MSPnet.org www.SECsurvey.org/projects

10
Rationale for SEC Assessment Standards Curriculum

11
Key Question -- SEC Tools Research into Practice How can Educators obtain reliable, valid data to determine Alignment of instruction with required standards and assessments?

12
And You could compare how you teach content compared to how others across the nation teach? You could use anonymous teacher data to start a powerful school discussion about what the teacher needs are?

13
Applications Alignment analysis --instruction, standards, assessments Instructional improvement in schools Needs assessment/ Evaluation Indicators – monitoring change over time

14
What if… You could use data on instructional quality and content to guide professional development? You could have consistency across grade levels? You could know how well aligned your state standards were to the state assessment?

15
English Language Arts & Reading The SEC Data-set SUMMARY MEASURES ContentPracticeClimateProf. Dev./// Science Instructional Content Instr. Activities Tchr. Char./Opinions/Beliefs Professional Development Mathematics

16
SUMMARY MEASURES ContentPracticeClimateProf. Dev./// VariableSummary Measure Description PDhrs PDfreq PDactive PDcohere PDcoll PDcnt PDdata PDstnd PDstlrn # of PD Hours reported Frequency of PD Activities PD that involved active engagement of teachers PD that is part of a coherent plan & goals Collective participation from school/department PD with focus on subject matter content PD with focus on Student Data PD with focus on Standards & Instruction PD with focus on Student Learning

17
PDAL Tool Research Into Practice How can educators obtain reliable, valid data to determine the quality of professional development activities?

18
Applications Analysis of PD Quality —research based criteria Examine how PD relates to teachers’ instruction Track teachers’ PD over time Identify Teachers’ PD needs Target PD to improve instruction

19
What if…. You could have data on the content and quality of PD for district, school, teacher? You could examine teachers’ PD and aligned instruction, as measured by SEC? You had data about teachers’ actual PD experiences when addressing their needs?

20
Steps in PDAL Development Evaluation of Eisenhower Program –Identified features of quality Evolution of survey instrumentation –From individual to aggregate profile/portfolio –Use of cognitive labs for refinement

21
School & Class Description Instructional Activities General Problem Solving Activities Pairs & Small Group Work Use of Hands-on Materials Use of Calculators/Computers & other Ed. Tech. Assessment Use Instructional Influences Instructional Readiness Teacher Opinions Professional Development Types Content Focus Active Learning Collegial Participation Coherence Time Span Teacher Characteristics Instructional Content Survey Sections

22
Surveys of Enacted Curriculum A neutral content grid with cognitive demand The intended curriculum: State content standards— What students should learn The enacted curriculum: What teachers teach The learned curriculum: Student outcomes based on school learning The assessed curriculum: State (and other) assessments— tested learning
 assessments— tested learning")
24
Content Matrix

26
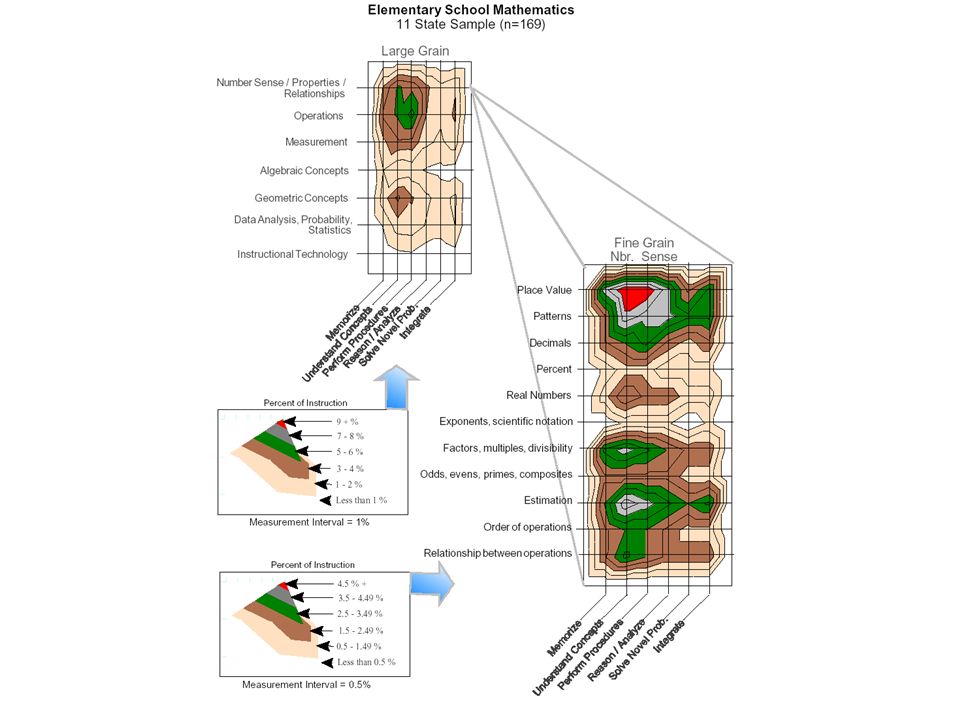
Content Maps

29
Alignment Content Analysis Conducted with each State’s standards, assesments – middle grades

32
Descriptive results can be reported using a variety of graphic displays

35
Standards-based Alignment among Instruction, Assessment, and Professional Development

36
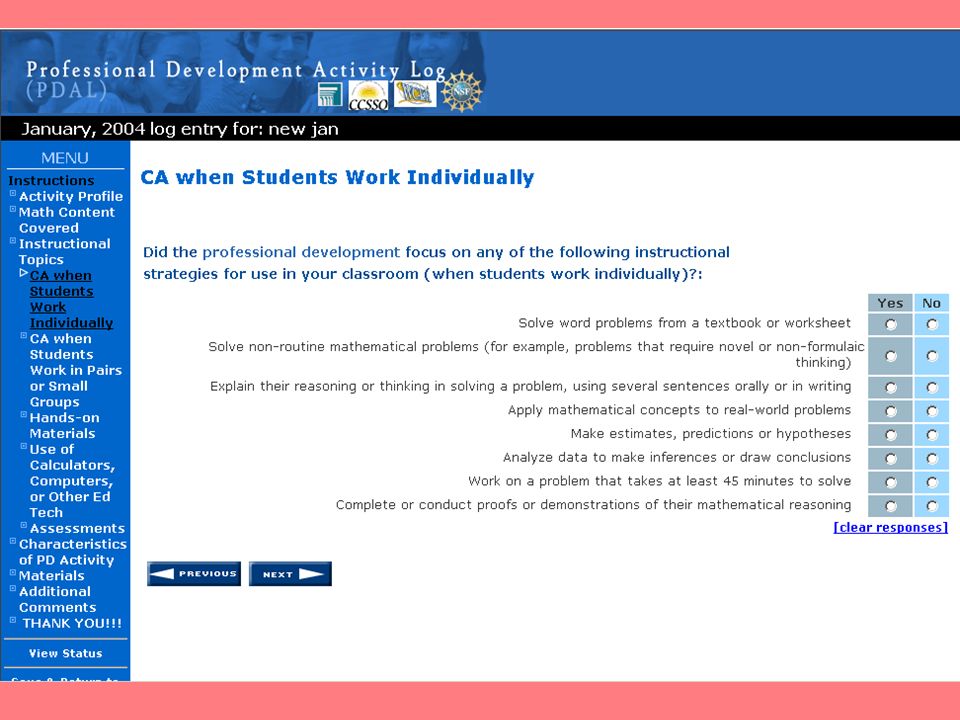
Professional Development Activity Log (PDAL) Help teachers create an ongoing monthly log of any professional learning activity in which they participate Longitudinal data collected over 15 months Web-based, self-administered log Aligned with SEC (e.g., content coverage) Inclusive approach to professional development –Includes MSP-sponsored and non-MSP-sponsored activities –Documents one-time and recurring activities –Captures both formal and informal activities
 Help teachers create an ongoing monthly log of any professional learning activity in which they participate Longitudinal data collected over 15 months Web-based, self-administered log Aligned with SEC (e.g., content coverage) Inclusive approach to professional development –Includes MSP-sponsored and non-MSP-sponsored activities –Documents one-time and recurring activities –Captures both formal and informal activities")
37
Overview Comparisons between teacher logs with survey Teachers’ experience with logs Lessons learned Next steps

38
Professional Development Activity Log (PDAL) The PDAL is a web-based, self-administered, longitudinal data collection tool for teachers to record their professional development experiences in detail with the assistance of a series of structured prompts Teachers log on to their password-protected web account and fill out their PDAL at regular intervals Visit www.PDAL.net for more informationwww.PDAL.net
 The PDAL is a web-based, self-administered, longitudinal data collection tool for teachers to record their professional development experiences in detail with the assistance of a series of structured prompts Teachers log on to their password-protected web account and fill out their PDAL at regular intervals Visit for more informationwww.PDAL.net")
39
Why PDAL? Collects disaggregate information about specific PD activities – Increases the level of specificity of PD data and reduces bias introduced by gross data aggregation Gathers accurate, reliable, and time-sensitive information – Minimizes recall problem with retrospective reports Tailors technical assistance to teachers based on their response patterns Allows teachers to review their own logs – Teachers can reflect on their own PD experiences Generates context sensitive questions

40
Overview Comparisons between teacher logs with survey Teachers’ experience with logs Lessons learned Next steps

41
PDAL Entries Name of activity Number of hours spent on each activity and its duration Whether the activity is a one-time or continuous event (e.g., recurring over a number of months) Type of activity (e.g., workshop, summer institute, study group) Purpose of activity (e.g., strengthening subject matter knowledge) PD quality features (e.g., active learning, coherence, collective participation) Content focus (e.g., algebraic concepts: absolute values, use of variables, etc.) Instructional practice – instructional topics covered in each activity (e.g., use of calculators, computers, or other educational technology)
 Type of activity (e.g., workshop, summer institute, study group) Purpose of activity (e.g., strengthening subject matter knowledge) PD quality features (e.g., active learning, coherence, collective participation) Content focus (e.g., algebraic concepts: absolute values, use of variables, etc.) Instructional practice – instructional topics covered in each activity (e.g., use of calculators, computers, or other educational technology)")
42
Why PDAL? Collects disaggregate information about specific PD activities – Increases the level of specificity of PD data and reduces bias introduced by gross data aggregation Gathers accurate, reliable, and time-sensitive information – Minimizes recall problem with retrospective reports Tailors technical assistance to teachers based on their response patterns Allows teachers to review their own logs – Teachers can reflect on their own PD experiences Generates context sensitive questions

44
Research Questions To what extent is the quality of the professional development supported by MSP activities consistent with research-based definitions of quality (e.g., content focus, active learning, coherence, collective participation, and sustained efforts)? What effects do teachers' professional development experiences have on instructional practices and content taught in math and science classes? Are high-quality professional development activities more likely than lower-quality activities to increase the alignment of instructional content with state standards and assessments?

45
Participants Four MSP projects were selected for the study. In each project, we are collecting data with teachers in middle schools or middle grades about their professional development in mathematics and science education (Total teacher N=474). Our study model, instruments, data and reports will benefit each of the four participating sites, and we hope that all of the MSP projects will be able to incorporate some aspects of this evaluation model.
. Our study model, instruments, data and reports will benefit each of the four participating sites, and we hope that all of the MSP projects will be able to incorporate some aspects of this evaluation model..")
46
Data Collection Using the Surveys of Enacted Curriculum (SEC), measure the subject content and instructional practices teachers are employing in math and science instruction, prior to MSP implementation in Year 1 (Spring 2003); Using the Professional Development Activity Log (PDAL), identify the characteristics of professional development activities in which teachers participated through MSP-supported or other programs to improve math and science instruction, over 15 months through Year 2 (Fall 2004); and Repeating the SEC, measure the subject content and instructional practices again in Year 3 (Spring 2005), to determine change in practices after participation in the broad range of MSP-supported professional development activities.
, measure the subject content and instructional practices teachers are employing in math and science instruction, prior to MSP implementation in Year 1 (Spring 2003); Using the Professional Development Activity Log (PDAL), identify the characteristics of professional development activities in which teachers participated through MSP-supported or other programs to improve math and science instruction, over 15 months through Year 2 (Fall 2004); and Repeating the SEC, measure the subject content and instructional practices again in Year 3 (Spring 2005), to determine change in practices after participation in the broad range of MSP-supported professional development activities.")
47
Survey of Enacted Curriculum (SEC) Description about target class Instructional practice (e.g., instructional time in target class, classroom instructional preparation) Content alignment: time on topic and expectation for students (e.g., memorize facts, perform procedure, or solve non-routine problems) Professional development experiences Teacher opinions about school culture (e.g., trust) Teacher characteristics
 Description about target class Instructional practice (e.g., instructional time in target class, classroom instructional preparation) Content alignment: time on topic and expectation for students (e.g., memorize facts, perform procedure, or solve non-routine problems) Professional development experiences Teacher opinions about school culture (e.g., trust) Teacher characteristics")
48
SEC Content Topics Math, Science, ELA The SEC provides a neutral, research- based language to describe content of English language arts, mathematics, and science. NCLB anyone?

51
Advantages of PDAL Gathers accurate, time-sensitive information; Minimizes recall problem with retrospective reports Collects disaggregate information about specific PD activities – Reduces bias introduced by gross data aggregation Generates context sensitive questions Alleviates teachers’ response burden Minimizes data entry errors Be able to tailor technical assistance to teachers based on their response patterns Allows teachers to review their own logs – Teachers can reflect on their own PD experiences

52
Analysis of PDAL Data Examine the viability of PDAL as alternative PD data collection instrument (Implementation analysis) –Sample attrition; response rates; extent of missing data; TA needs; other PDAL development and implementation issues Produce rich description & correlates of PD activities (Descriptive analysis) –Patterns of responses to monthly logs –Patterns of teachers’ PD experiences –Latent classes of teachers based on their PD experiences –Correlates of high-quality PD activities Assess the impact of PD on math & science instruction (Impact analysis)
 –Sample attrition; response rates; extent of missing data; TA needs; other PDAL development and implementation issues Produce rich description & correlates of PD activities (Descriptive analysis) –Patterns of responses to monthly logs –Patterns of teachers’ PD experiences –Latent classes of teachers based on their PD experiences –Correlates of high-quality PD activities Assess the impact of PD on math & science instruction (Impact analysis)")
53
For More Information & Services CCSSO –RolfB@ccsso.org; –Carliseg@ccsso.org www.SECsurvey.org TA/PD Workshops—Use of Data TERC—Diana N (DEC model), Others Learning Point Assoc /NCREL
, Others Learning Point Assoc /NCREL")
54
For SEC Access, Alignment, Research WCER –johns@education.wisc.edu –aminor@wisc.edu www.SEConline.org

55
For PDAL Information AIR –bbirman@air.org –ksyoon@air.org -- mgaret@air.org -- rjacobson@air.org

Similar presentations


 U.S. Department of Education, Title I, Enhanced Assessment.>")


