Download presentation
Presentation is loading. Please wait.

1
Peak Height Ratios in Forensic STR Analyses: Pattern of Occurrence & Effects of Concentration Data from: Illinois State Police Laboratory Illinois State Police Laboratory Broward County Sheriffs Lab & Forensic Bioinformatics 69%

2
Validation

3
Size Ladders are Used to Make Allele Calls

5
LocusNMean% ABI SD99%CINMean% FBI SD99%CI D3S13586893481167 193 93 89 5.2 9.4 77 62 VWA7493578180925.675 D16S5397092674220889.460 FGA8093578269925.775 THO17092674318918.067 TPOX7892674298888.663 CSF1PO8492674234889.161 D8S11799392674180934.879 D21S119591770230925.576 D18S5110091673271896.769 D5S8186592577122934.978 D13S3177393578173935.676 D7S8207993675159 261 92 88 5.9 9.4 74 60

6
Figure from: STR ANALYSIS BY CAPILLARY ELECTROPHORESIS: DEVELOPMENT OF INTERPRETATION GUIDELINES FOR THE PROFILER PLUS AND COFILER SYSTEMSFOR USE IN FORENSIC SCIENCE by Deborah Hobson, Jill Smerick, and Jenifer Smith DNAU I, FBI Laboratory, Washington, D.C.

7
RFU values for smaller allele in each heterozygote

8
Frequency of Occurrence of Heterozygote Peak Height Ratios in Percentages in All Loci in the Illinois State Police Validation Studies

9
Mean PHR with 95% CI for Each CODIS Locus

10
Reference Sample Peak Height Ratios

12
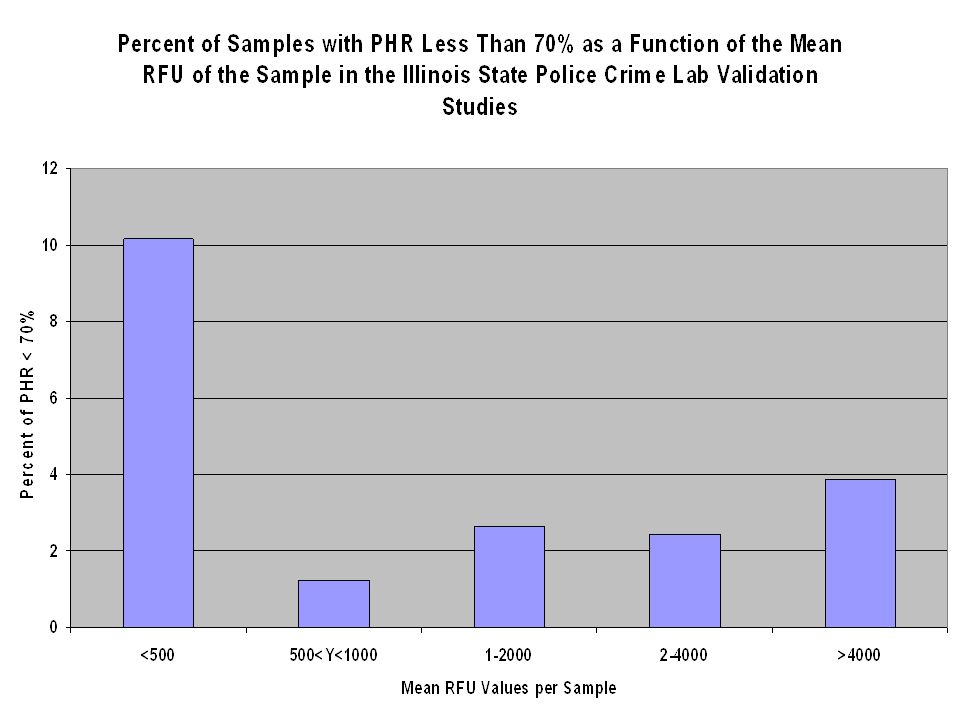
The mean Peak Height Ratio is significantly smaller and the variance larger for smaller DNA samples as reflected by the mean RFU of a sample. Above that threshold the mean PHR & Variance does not differ significantly among peak height classes.

14
Relationship between RFU & the percent of profiles with PHRs above (Yes) and below (NO) 70%. Chi-Squared = 21.58, 4df, p = 0.00024

18
Amplifications from same dilution tube (~30 pg). (2-012802 10.19 AM) Allelic imbalance present. Allele dropout @ D18. Different DNA profiles @ D3, D21, D18 and D13.

19
The bottom line is simple; Peak Height Ratios (PHRs) have a higher probability of being imbalanced and show significantly greater imbalances in small and/or degraded samples of DNA when using Profiler Plus and Cofiler to type STR DNA in crime scene type samples. A significant number of samples at all RFU classes show peak height ratios below 70%. This is especially true of small and/or degraded samples like those collected at many crime scenes. The Illinois State Police DNA labs use of a 70% rule to infer single source samples and in interpreting the relative contributions to mixtures is not justified by the data in their own validation studies. I have seen similar data from the validation studies of many other crime labs (e.g., Minnesota BCA, Broward County Sheriffs Lab, Bode Technology, West Palm Beach Sheriffs Office, Connecticut State Police Crime Lab, FBI Laboratory, and studies done by the kits manufacturers.

Similar presentations


>")


>")

