Download presentation
Presentation is loading. Please wait.

1
Updates PS-11 (PM CEMS), Multi-metals CEMS, Multi-metals Fence Line Monitoring, & CEMS Cost Model
, Multi-metals CEMS, Multi-metals Fence Line Monitoring, & CEMS Cost Model")
2
Status of PS – 11 for PM CEMS
Promulgated January 12, 2004 PS-11 (initial correlation) Procedure 2 (ongoing QA/QC) Corrections final November ‘06 Guidance development Spreadsheets, statistical tools, problem troubleshooting Final November ‘06
 Procedure 2 (ongoing QA/QC) Corrections final November ‘06. Guidance development. Spreadsheets, statistical tools, problem troubleshooting. Final November ‘06.")
3
Applicability of PM CEMS
Work in any stack where filterable PM stack test (Method 17, Method 5, Method 5B or Method 5i) is used for compliance Work in wet or dry stacks Some technologies work only in dry stacks and others work in both
 is used for compliance. Work in wet or dry stacks. Some technologies work only in dry stacks and others work in both.")
4
Correlation Testing Requirements
Calibration gases not feasible PM CEMS responses are correlated to reference method for PM concentration using regression analysis Minimum of 15 test runs simultaneous with PM CEMS responses Low, medium, high levels

5
L G & E – Mill Creek 7 7

6
Operational PM CEMS Electric utilities (coal) Approximately 8 units
wet stacks and dry stacks 4 to 5 have passed audit tests showing stability of correlations Pulp mill recovery boiler (spent liquor) 3 years of data 2 solid/liquid incinerators 2 years of data for one 15 recent coal-fired utility permits require PM CEMS
 3 years of data. 2 solid/liquid incinerators. 2 years of data for one. 15 recent coal-fired utility permits require PM CEMS.")
7
PM CEMS Costs First costs $120K (expected to go down 15% next year)
Includes correlation testing and installation Annual costs $40K SO2 CEMS costs for comparison First costs $134K Annual costs $30K COMS costs for comparison First costs $64K Annual costs $13K Adjusted PM CEMS costs for elimination of COMS First costs $120K - $64K = $56K Annual costs $40K - $13K = $27K

8
Regulatory Options Require PM CEMS
Deviation regulatory language similar to industrial boiler MACT “Deviation not always a violation” Or, allow units to have a grace period prior to PM CEMS data becoming enforceable Make an option, but not require, PM CEMS for units as a replacement for COMS

9
Future PM CEMS Work PM 2.5 PM CEMS Development Dilution technology
Sharp cut cyclones Beta Gauge for back end gravimetrics Baldwin Environmental and Desert Research Hope to go to field in ‘08

10
Multimetal CEMS Eli Lilly Petitioned EPA for Alternative monitoring for their Haz Waste Incinerator in Lafayette, Indiana Metals, particulate matter (PM), and HCl/Cl Continuous Monitoring in place of parameters (scrubber flow rates, temperatures,etc.)
, and HCl/Cl Continuous Monitoring in place of parameters (scrubber flow rates, temperatures,etc.)")
11
Concept to Proof Eli Lilly hired Cooper Environmental
Met with us and OSWER Program designed together M-301 testing in the lab to prove quantitative aerosol generator (QAG) M-301 testing in the field to prove the multimetals CEMS with the QAG Multimetals CEMS called X-ACT Non-destructive X-ray Fluorescence analysis (XRF)
 M-301 testing in the field to prove the multimetals CEMS with the QAG. Multimetals CEMS called X-ACT. Non-destructive X-ray Fluorescence analysis (XRF)")
12
Draft Methods from Program
Multimetals CEMS Performance Specification Multimetals filter method Multimetals quantitative aerosol generation method HCL low level performance specification

13
Multimetal Fence Line Monitoring
Real-Time Ambient Metals Emissions Apportionment?

14
Fugitive Emissions Can Dominate Local Impacts –
Not all stacks are created equal Blast Furnace Upset Doctors Clinic School Stack/Ducted Emissions

15
Can it be modified for a fence line monitor application?
Xact CEMS Method 301 Validated AMP Approved On-Stack Certified 2.5 Years On-Stack Operations Can it be modified for a fence line monitor application?

16
Concentration Range of Interest
mg/m3 µg/m3 ng/m3 pg/m3 Xact-CEMS Xact-IAP XFM Xact-FLM Fence Line Xact-ATM Air Toxics QAG Validation

17
Why Multi-Metals FLM? Metals
Eight of EPA’s 33 highest concern pollutants High local concentrations Persistent Under reported Fugitive/Area/Low Emissions Can dominate local exposure Infrequent/difficult measurements High uncertainty Stack Emissions Uncertain, but MM-CEMS available

18
Why Short Term averaging?
Protect Health Accurate emissions assessment Minimize emissions before they become problem

19
Xact-CEMS to FLM Transition
CEMS to FLM Modifications Inlet Inlet Tape Flow Sampling and Analysis Module Firmware Time Control Module Flow Module

20
XACT-FLM SAMPLING AND ANALYSIS
Sample Flow X-Ray Tube Aerosol Deposit Analysis Area Filter Tape Filter Tape

21
WS, WD and MMs Can Provide Accurate Emissions Apportionment
This illustration showing various operations and possible sources within a plant will have or not have an impact on a particular monitor depending on the directional sector from which the wind is reaching the monitor. This directional dependence of source impacts along with short sampling and analysis times greatly increases a source impact’s “signal to noise” ratio, which is otherwise reduced or blurred with longer sampling times. With near real-time metals measurements and source apportionment, the plant could use this information to identify problem sources or procedures and correct them before significant exposure has occurred. With time, problem sources and operations would be eliminated and the community should see a continuing decrease in monitored concentrations. This feedback to the plant may be one of the more valuable aspects of this kind of monitoring.

22
Multiple Species Contribute to Accurate Apportionment
Portland, OR CAMS - January 27, 1978 Traffic Sources (road dust, tail pipe) Industrial Source (ferromanganese) 12 am - 4 am 4 am - 8 am 8 am - 12 pm Percent PM2.5 Mass This slide illustrates how time variability of multi-element measurements provide an invaluable tool for identifying specific sources or source categories responsible for elemental impacts. In this case, as the day progresses the impact from a specific ferromanganese furnace (K, Cr, and Mn) decreases due to meteorology/operations while the traffic-related impacts from road dust (Al, Si, Ca,Ti and Fe) and leaded-automobile exhaust (Br and Pb) increase due to meteorology and increasing vehicle miles traveled. This clear impact from the ferromanganese furnace would not be as apparent in a 24-hour average elemental analysis sample.
 Industrial Source (ferromanganese) 12 am - 4 am. 4 am - 8 am. 8 am - 12 pm. Percent PM2.5 Mass. This slide illustrates how time variability of multi-element measurements provide an invaluable tool for identifying specific sources or source categories responsible for elemental impacts. In this case, as the day progresses the impact from a specific ferromanganese furnace (K, Cr, and Mn) decreases due to meteorology/operations while the traffic-related impacts from road dust (Al, Si, Ca,Ti and Fe) and leaded-automobile exhaust (Br and Pb) increase due to meteorology and increasing vehicle miles traveled. This clear impact from the ferromanganese furnace would not be as apparent in a 24-hour average elemental analysis sample.")
23
Pseudo-deterministic Receptor Model (PDRM)
Urban Arsenic – Sydney, FL Ondov, U of MD 2005 As concentration (ng/m³) 09:00 12:00 15:00 18:00 21:00 00:00
 09:00. 12:00. 15:00. 18:00. 21:00. 00:00.")
24
This Technology Provides a Tool to:
Assess and protect health Effectively enforce compliance Effectively reduce emissions - Near real time response would allow emissions minimization before becoming a problem - Clearly, a multi-metals monitor unlike single species monitors, can provide measurements to not only assess hazardous metal impacts and protect health, but as important can contribute to the identification of specific responsible processes within a plant and as such contribute to the effective reduction of emissions both in the short term as well as long term trends.

25
Other Potential Applications
Air quality and emissions assessment Strategy development and regulation setting Compliance assurance and enforcement Emergency response, clean up and solid waste management

26
Possible Discussion Topics
Regulatory options? How do these options impact measurements? Monitor location and number Reporting times Where to monitor – fence line or local community? How close to fence line to be a “fence line monitor”? Modeling approach

27
Where do we go from here?

29
Key Xact-FLM DETECTION LIMITS (µg/m³)*
Element Kimoto** Gore** Cr As Cd Cu Pb Mn Co Ni Se Ag Sb Range of Interest: 0.01 to 1,000 µg/m3 *95% confidence, interference free **60 minute sampling and analysis, 40 lpm/cm2

30
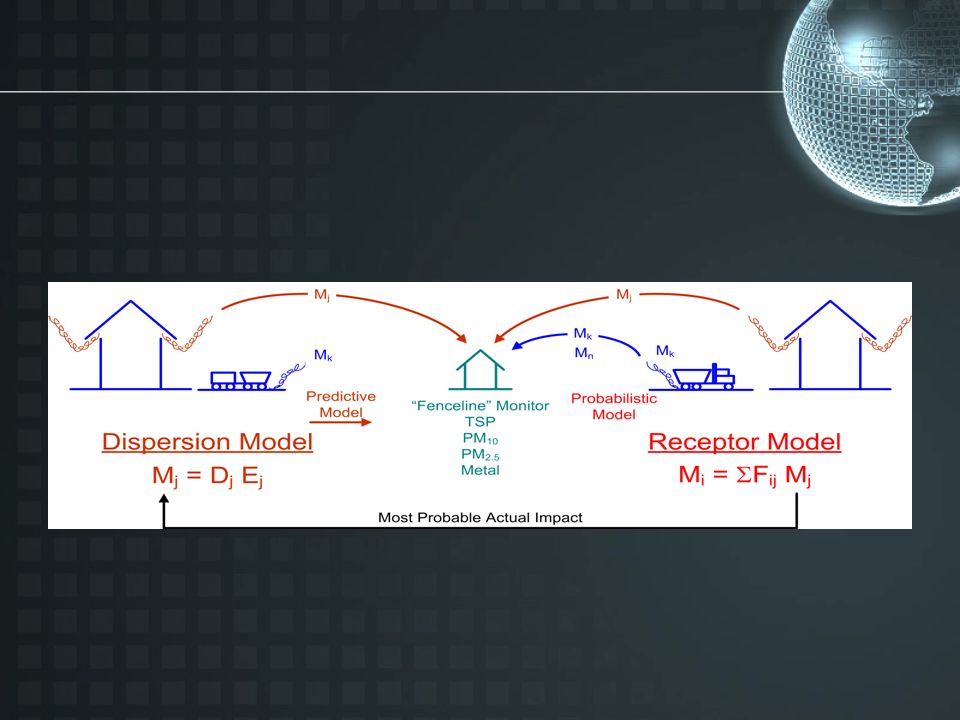
Comparison of Emission Estimating Models
Measured Impact Model Product Periodic Stack Measurements Plant Operating Model Feed/Fuel Controls Total Emission Estimate PI-ORS FL-Plume Measurements Total Emission Estimate Dispersion/Flow Modeling Receptor Modeling MM-Xact-FLM Measurements Reconciled Dispersion Modeling -PDRM Source/Process-Specific Impact Contribution Total and Source- Specific Emissions

31
CEMS Revised Cost Model

32
CEMS Revised Cost Model
Crude Computer model early 90’s for SO2 and NOx 1998 – Updated Menu driven model with real cost data and questionnaire information 2006 – Updated cost information Added Bag leak detectors and Hg CEMS Split PM CEMS into several categories Xcel Spreadsheet format EMC website

33
First Costs Labor Test ODCs Total Planning 2,534 352 2,886 Select Equipment 10,941 3,067 14,008 Support Facilities 19,065 Purchase CEMS Hardware 95,400 Install and Check CEMS 6,762 11,979 18,741 Performance Specification Tests 2,244 33,855 628 36,726 QA/QC Plan 2,570 11,981 692 15,244 25,052 45,836 131,182 202,070 Annual Costs Day-to-Day Activities 10,310 1,000 11,310 Annual RATA 885 33,485 34,370 PM Monitor RCA PM Monitor RRA Cylinder Gas Audits (ACA/SVA for PM) 1,164 15,881 17,045 Recordkeeping and Reporting 1,253 160 1,413 Annual QA & O&M Review and Update 2,074 2,980 5,054 Capital Recovery 3,567 6,527 18,680 28,775 Total w/o capital recovery 15,686 20,021 69,192 Total with capital recovery 19,254 40,012 38,702 97,967
 1, , ,045. Recordkeeping and Reporting. 1, ,413. Annual QA & O&M Review and Update. 2,074. 2,980. 5,054. Capital Recovery. 3,567. 6, , ,775. Total w/o capital recovery. 15, , ,192. Total with capital recovery. 19, , , ,967.")
Similar presentations
 Programs Lessons learned from a Brick up side the head.>")


 Plant at Magnetic Park, Desborough Appraisal of Air Quality Impacts Associated with Stack Emissions.>")


 for HCl CEMS to support emissions monitoring in the Portland Cement MACT and Electric.>")