Download presentation
Presentation is loading. Please wait.

1
TRANSEARCH Data for Planning in Tennessee By Jerry Everett The University of Tennessee, Knoxville

2
Scope of My Presentation Our Data Related Project Tasks The Data’s Characteristics Examples of Analysis Results Lessons Learned Remaining Work

3
Our Tasks Provide Assistance to in Procuring and Maintaining Commodity Flow Data Determine How The Large MPOs Can Use Freight Flow Data For Regional Freight Planning and Identify Analytical Tools –Example applications –Analytical tools Provide Assistance To TDOT And MPO’s In Carrying Out Freight Planning Studies –Examples: review documents, process Transearch data

4
Freight Data- Vehicles or Commodities? Commodities –Manufactured goods, Construction materials, Petroleum –Consumer goods: TV, furniture, etc. –Small packages and Mail, etc. Vehicles –Panel Trucks and Vans –Single Unit –Combination units from “Pup” trailer to double and triple trailers

5
TRANSEARCH Data TRANSEARCH is one of the most complete sources of commodity flow data. It is based on > 100 sources including way bills, surveys etc. “Snap Shoot” of Single Point in time –But some components may be a base-year plus growth Uses conversion rates by commodity to translate from tons to truckloads (trucks on hwy)
.")
6
TRANSEARCH Data Specs Annual Tonnage (2001) of freight flows by –3 digit (238) and 4 digit (728) Standard Transportation Commodity Classification (STCC) Extent of Movements include –TN Origins –TN Destinations –Movements Thru TN Modes –Hwy: Truckload & Less than Truck Load (LTL) & Private Truck –Rail –Intermodal –Water –Air –River Drayage
 of freight flows by –3 digit (238) and 4 digit (728) Standard Transportation Commodity Classification (STCC) Extent of Movements include –TN Origins –TN Destinations –Movements Thru TN Modes –Hwy: Truckload & Less than Truck Load (LTL) & Private Truck –Rail –Intermodal –Water –Air –River Drayage")
7
TRANSEARCH Data Specs continued…. Geographic Coverage –TN County-to-County Flows & some within county –Thru movements for Truck and Rail Between external U.S. origins/destinations Traffic between US and Mexico (Including TN O/Ds) Traffic between US and Canada (Including TN O/Ds) –Rest of US Geography at 4 levels – Key Adjacent Counties, Key States, Key City BEA areas, Census Regions
 Traffic between US and Canada (Including TN O/Ds) –Rest of US Geography at 4 levels – Key Adjacent Counties, Key States, Key City BEA areas, Census Regions.")
8
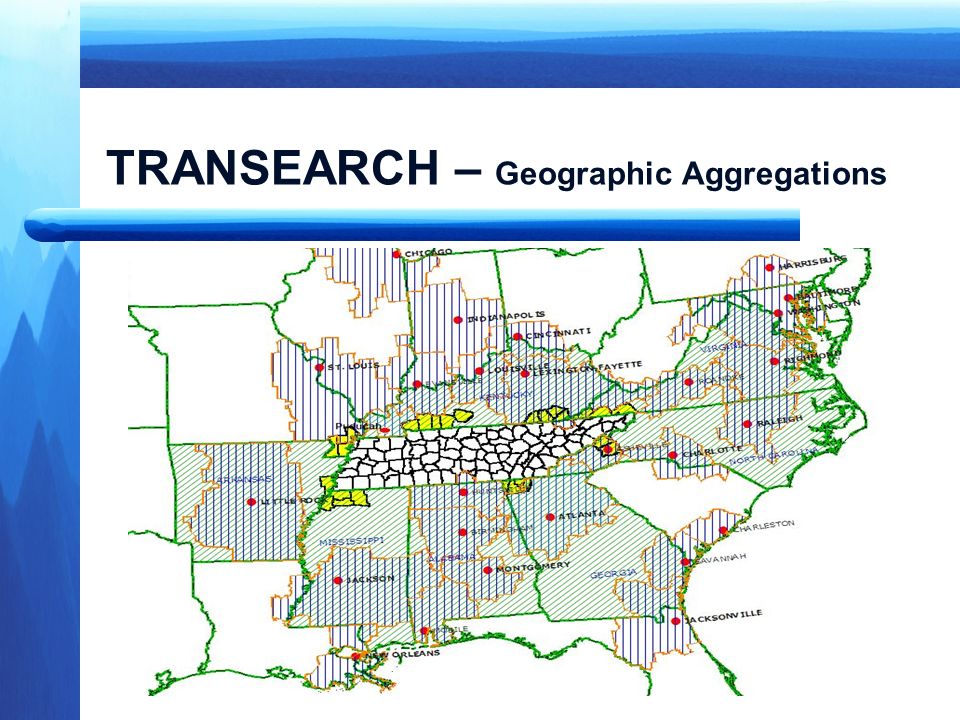
TRANSEARCH – Geographic Aggregations

10
TRANSEARCH – Geographic Aggregations Census Regions

11
General Highway Flow Statistics Loaded Hwy Flow Table has 724,197 records Hwy Network has 102,407 links Largest single movement appears to be within Shelby county -1,060,227 truck loads of empty semi-trailers Most tons moved appears to be 16,607,160 tons of nonmetallic minerals between Hawkins County and Sullivan County

12
Terminology Truck Tons – The annual tonnage of a specified commodity that flows between an O/D - Truckloads, LTL and Private Truck Loads – The annual number of loads of a commodity that flows between an O/D - Truckloads, LTL and Private. Carloads – net short-tons (2000 lbs.) moving in carloads Warehouse & Distribution Center - represents traffic coming out from this kind of operation, but no detail on commodity is available
 moving in carloads Warehouse & Distribution Center - represents traffic coming out from this kind of operation, but no detail on commodity is available.")
13
Example Queries Top 10 Commodities Originating in TN Destination All of US (Including TN) Moving by Highway
 Moving by Highway")
14
Top 10 Commodities Originating in US Destination Tennessee (Including TN) Moving by Highway
 Moving by Highway")
15
Top 10 Commodities Originating in Tennessee Destination US (Including TN) Moving by Air
 Moving by Air")
16
Top 10 Destinations of Commodities Moving by Highway from Knox County

17
Top 10 Origins of Commodities Moving by Highway to Knox County

18
Truck Loads Destined for Nashville MPO Area by Commodity

19
Truck Loads Destined for Nashville MPO Area by Commodity Excluding Empty Trailers

20
Distribution of Truck Flows in TN Annual

21
Distribution of Truck Flows in TN Daily

22
Nashville MPO Area Annual Truck Loads by Movement 1541 daily 6007 daily 5606 daily

23
Key Definitions First Segment-Last Segment – The first/last section of hwy used on the probable route Network -Hwy = Older version of NHPN -Rail = Older version of FRA network Routing –Initial performed by ORNL for Reebie using least impedance algorithms –“Re-Routing” performed by UT using TransCAD –UT Daily Flows based on 312 days a year Tools – Access, Excel, TransCAD & “Add-In”

24
Network in Preparation for Routing

25
TransCAD “Add-In” Screen

26
Annual Truck Flows in Tennessee

27
Annual Flows Routed Based on Distance

28
Daily Truck Flows Links with Truck Volume >8000

29
Annual Truck Volumes Moving Through TN

30
Daily Trucks Moving Through TN Links with Truck Volume >5000

31
Daily Flows US to Canada Links with Truck Volume > 250

32
Issues with Routing Transearch Ex. Motor Vehicles Originating in TN Saturn Nissan 840

33
Data Issues No Formal Documentation Provided Routing – difficult to implement Flows on Network –Corridor assignment rather than a facility –Our flows are course –Annual vs. Daily Multimodal Shipments are not clearly linked Within county and county-to-county (in close proximity) may be not be extremely reliable –Not all trucks are counted –Some over represented? Some double counting in U.S.-Mexico tables Data does not include dollar value of commodity
 may be not be extremely reliable –Not all trucks are counted –Some over represented. Some double counting in U.S.-Mexico tables Data does not include dollar value of commodity.")
34
Next Steps Complete development of documentation Continue to Implement Routing Options Cross-Check Flows with other data Develop “standard” queries and charts Analyze flows in some corridors on network compare with TRIMS data Investigate Canadian and Mexican flows in more detail

35
Concluding Remarks Transearch data is useful and can be very powerful It requires more effort than expected Disaggregate Applications Need Verification It will need to be supplemented with other data for some analyses Applications are broader than Transportation

36
Acknowledgements Thanks to –Max Baker at UT –Paul Ricotta at Caliper

Similar presentations
 Model Formulation and Scenario Analysis Frank Southworth Oak Ridge National Laboratory Oak Ridge, TN 37831 NETS Program.>")
 A Multimodal Freight Routing Model Frank Southworth Oak Ridge National Laboratory Oak Ridge, TN 37831 NETS Program Review.>")
 Data Fusion Efforts and Issues Frank Southworth Oak Ridge National Laboratory Oak Ridge, TN 37831 NETS Program Review.>")


 February 27, 2014.>")

