Download presentation
Presentation is loading. Please wait.

1
MLOSS: Whistler 2008 scientific visualisation for python John Hunter Tradelink Chicago jdh2358@gmail.com

2
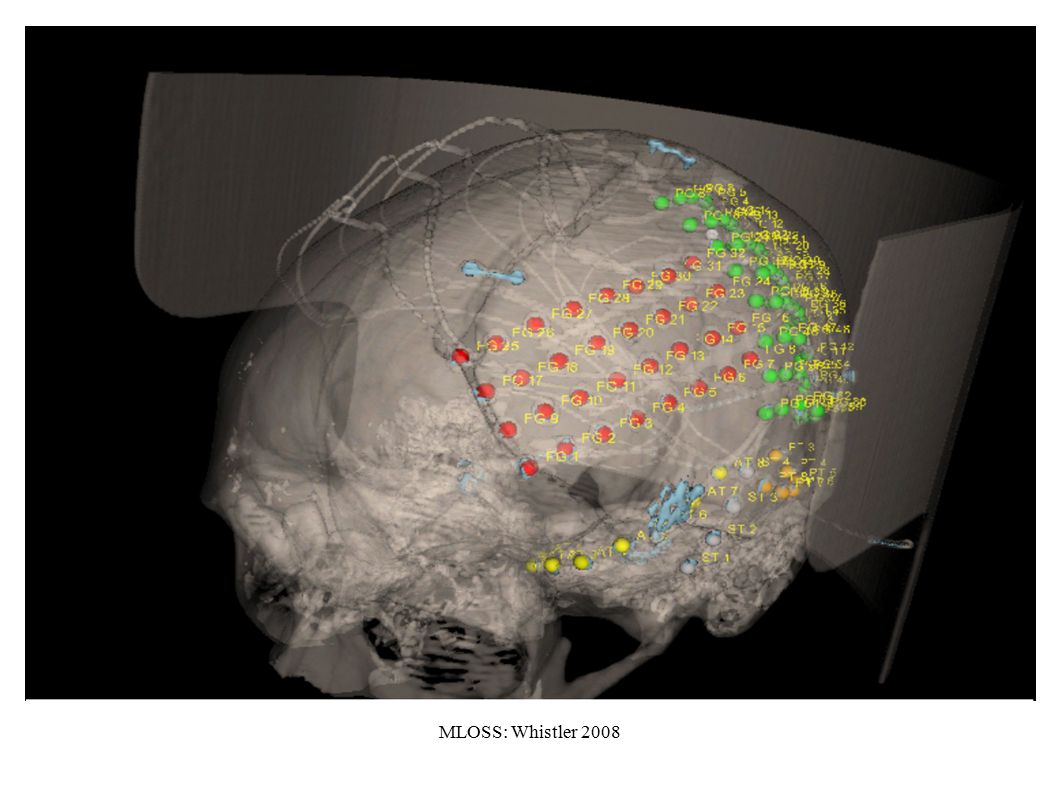
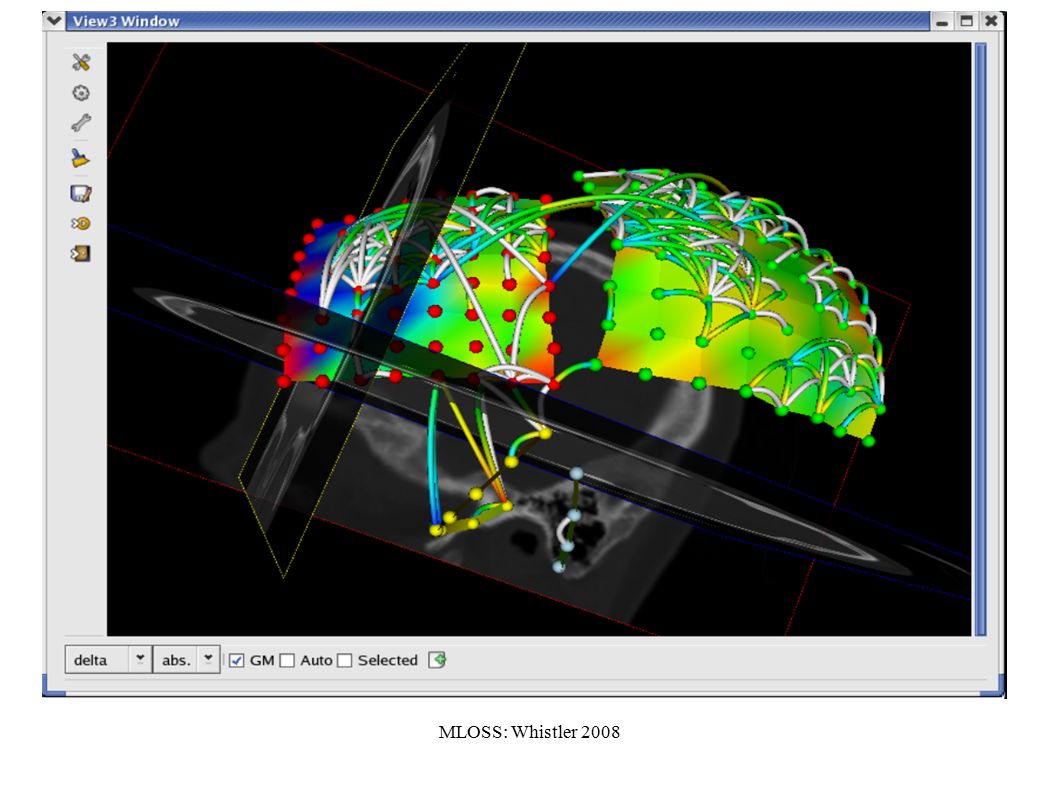
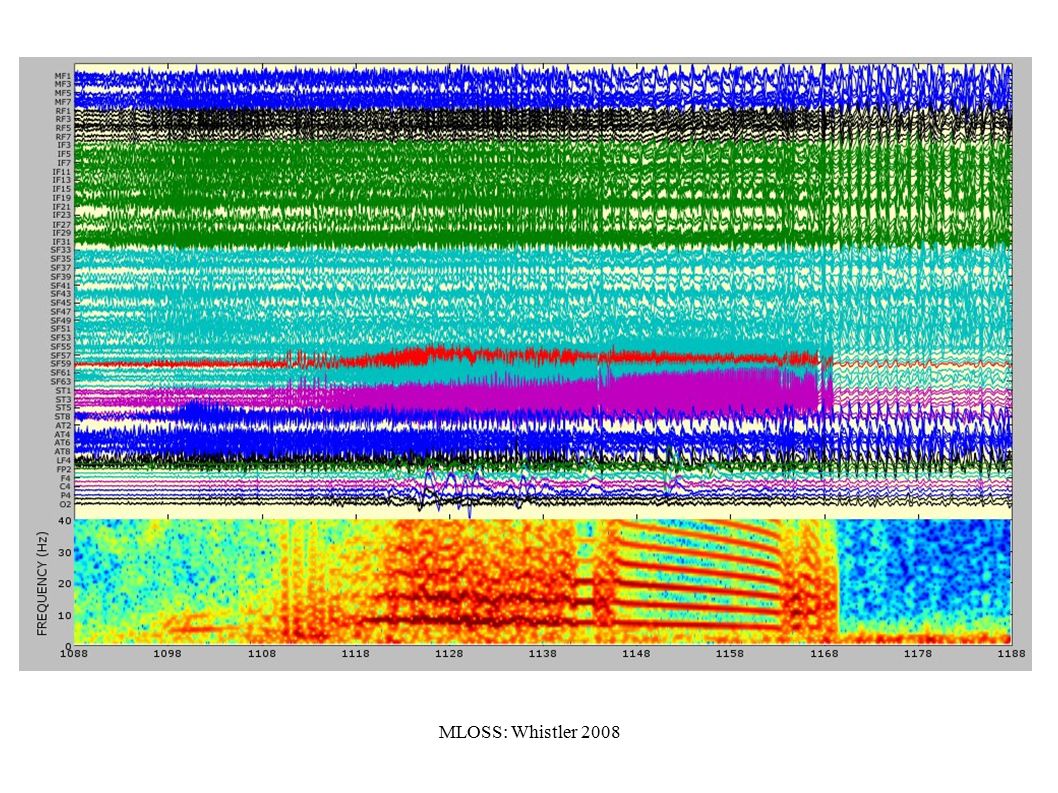
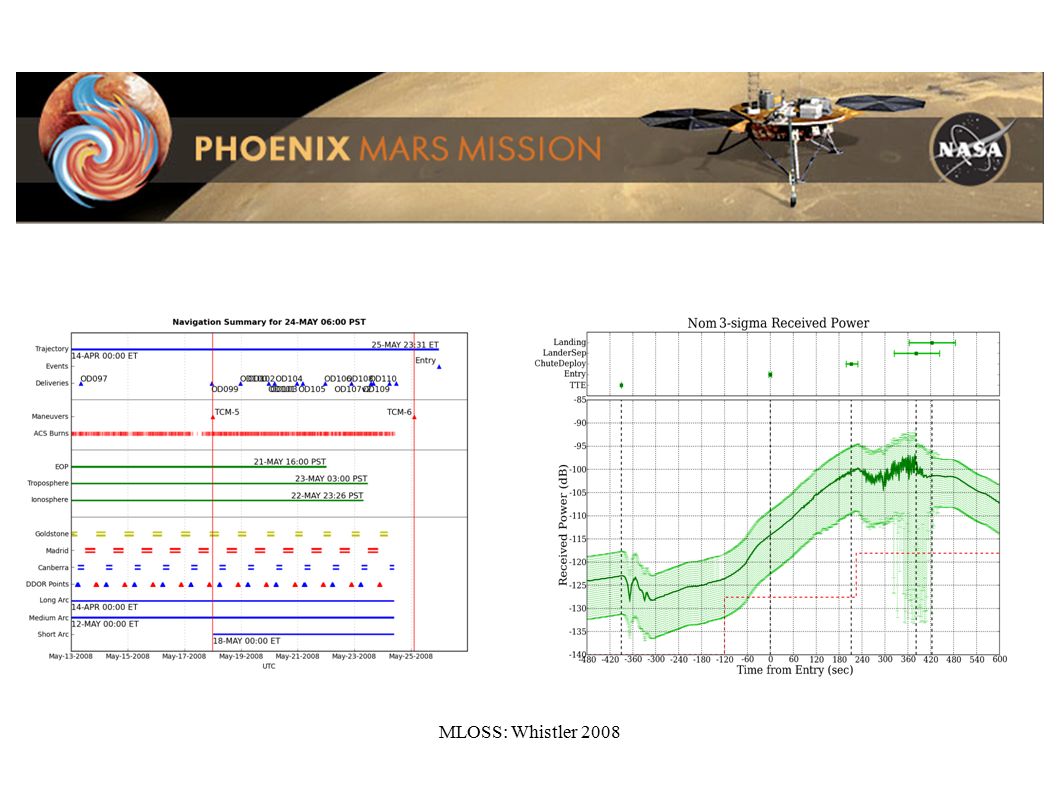
MLOSS: Whistler 2008

6
Copy the great architectures E Tufte

7
MLOSS: Whistler 2008 pylab interface Plotting should just work Easy plots should be easy GUI / interactive complexity should be managed ipython to the rescue IPython 0.6.12_cvs -- An enhanced Interactive Python. ? -> Introduction to IPython's features. %magic -> Information about IPython's 'magic' % functions. help -> Python's own help system. object? -> Details about 'object'. ?object also works, ?? prints more. Welcome to pylab, a matplotlib-based Python environment help(matplotlib) -> generic matplotlib information help(pylab) -> matlab-compatible commands from matplotlib help(plotting) -> plotting commands In [1]: plot([1,2,3])
 -> generic matplotlib information help(pylab) -> matlab-compatible commands from matplotlib help(plotting) -> plotting commands In [1]: plot([1,2,3]).")
8
MLOSS: Whistler 2008 Fits your brain: “hello world” in 4 languages

9
MLOSS: Whistler 2008 scalable, versatile scales from interactive scripts to full blown apps doesn't force one programming paradigm on you plays very well with other languages

10
MLOSS: Whistler 2008 Third party libraries

11
MLOSS: Whistler 2008 Fits your brain (part II): But I think this is the python
: But I think this is the python")
12
MLOSS: Whistler 2008 interactive interlude the interactive shell, rich data structures, numpy arrays, pylab mode rich text support, what you see is what you get, mathtext event handling, GUI embedding website - sphinx

13
MLOSS: Whistler 2008 bar demo

14
MLOSS: Whistler 2008 stacked bar

15
MLOSS: Whistler 2008 pie demo

16
MLOSS: Whistler 2008 subplot demo

17
MLOSS: Whistler 2008 axes demo

18
MLOSS: Whistler 2008

19
scatter demo

20
MLOSS: Whistler 2008 legend demo

21
MLOSS: Whistler 2008 histogram demo

22
MLOSS: Whistler 2008 log demo

23
MLOSS: Whistler 2008 polar demo

24
MLOSS: Whistler 2008 text alignment

25
MLOSS: Whistler 2008

26
matplotlib screenshot TeX support

27
MLOSS: Whistler 2008 layer image

28
MLOSS: Whistler 2008 basemap toolkit (courtesy of NOAA)
")
29
MLOSS: Whistler 2008 cylindrical equidistant, mercator, lambert conformal conic, lambert azimuthal equal area, albers equal area conic and stereographic. basemap toolkit

30
MLOSS: Whistler 2008 finance demo

31
MLOSS: Whistler 2008

32
Michelle Sanner Scripps

33
MLOSS: Whistler 2008 Hubble Space Telescope (courtesy of STScI)
")
34
MLOSS: Whistler 2008

36
The matplotlib API from matplotlib.backends.backend_agg import FigureCanvasAgg as FigureCanvas from matplotlib.figure import Figure fig = Figure() canvas = FigureCanvas(fig) ax = fig.add_subplot(111) ax.plot([1,2,3]) a ax.set_title('hi mom') ax.grid(True) ax.set_xlabel('time') ax.set_ylabel('volts') fig.savefig('test')
![The matplotlib API from matplotlib.backends.backend_agg import FigureCanvasAgg as FigureCanvas from matplotlib.figure import Figure fig = Figure() canvas = FigureCanvas(fig) ax = fig.add_subplot(111) ax.plot([1,2,3]) a ax.set_title( hi mom ) ax.grid(True) ax.set_xlabel( time ) ax.set_ylabel( volts ) fig.savefig( test )](http://images.slideplayer.com/23/6658338/slides/slide_36.jpg "The matplotlib API from matplotlib.backends.backend_agg import FigureCanvasAgg as FigureCanvas from matplotlib.figure import Figure fig = Figure() canvas = FigureCanvas(fig) ax = fig.add_subplot(111) ax.plot([1,2,3]) a ax.set_title( hi mom ) ax.grid(True) ax.set_xlabel( time ) ax.set_ylabel( volts ) fig.savefig( test )")
37
MLOSS: Whistler 2008

38
backends

Similar presentations