Download presentation
Presentation is loading. Please wait.

2
Living Systems

3
Chapter One: Studying Life 1.1 Measurements 1.2 Thinking Like a Scientist 1.3 Graphs

4
Investigation 1B How do scientists conduct a good experiment? Variables in an Experiment

5
1.3 Graphs A graph is a visual way to organize data. Types of graphs are: 1.Line 2.Bar 3.Pie

6
1.3 Data tables A table is one way to organize data for a graph. Tables have headers with titles and units. Data in tables is arranged in an orderly way.

7
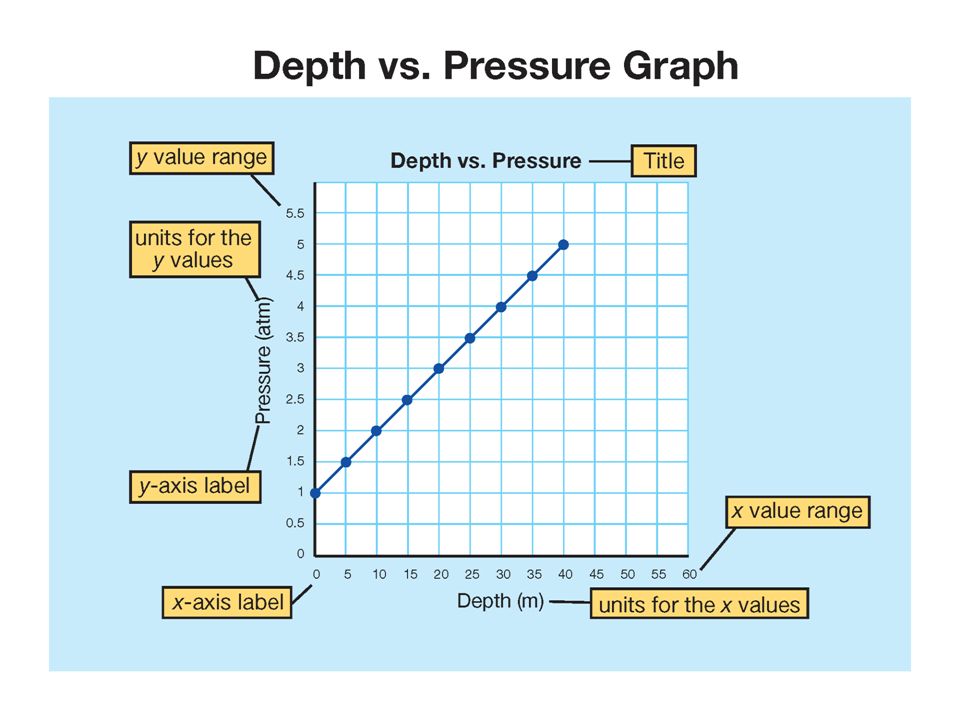
1.3 Making a Line Graph 1.Choose an x and y-axis. 2.Make a scale. 3.Plot your data. 4.Create a title.

9
1.3 Patterns Indicate Relationships In a direct relationship, when one variable increases, so does the other.

10
1.3 Patterns Indicate Relationships In an inverse relationship, when one variable increases, the other variable decreases.

11
1.3 Patterns Indicate Relationships When there is NO pattern, there is no relationship.

12
Technology Connection Dr. Merabet wants to know: What happens to the brain when a person is blind? The Role of a Scientist

13
Activity The human population is growing. Currently there are over 6 billion people on Earth. Population Graphs

Similar presentations

 Represents the passage of time and the numerical value of behavior. The Independent.>")


 The Independent Variable. A change in this variable affects the y variable. >")


? Do Now: Copy the following: Line Graph - A graph that is used to display data that shows how one variable.>")


