Download presentation
Presentation is loading. Please wait.

1
Satellite based mapping of lakes and climatic variations in the Ruizi and Katonga Catchments, Uganda Bernard Barasa December, 2014

2
Content Introduction Problem statement Objectives Methodology Results Recommendation

3
Climatic variations alter freshwater ecosystems but specifically the effects may vary from one region to another and type of waterbody, the effects may manifest through an increase/decrease in nutrient/sediment loading, residence time and water level (Mooij et al., 2005; Herold et al., 2009) The observable and potential impacts of climate change on the fresh water resources include flooding, drought, change in the frequency and distribution of rainfall, drying up of river and receding of water bodies among others (Urama and Ozor, 2010). Introduction

4
This study aimed to assess the mean annual monthly extent of lakes in relation to their sensitivity to climatic variations in both Ruizi and Katonga catchments Introduction

5
Both Ruizi and Katonga catchments are located in the Lake Victoria Management Zone and lie in the southern part of the cattle corridor of Uganda (Dryland) The rivers originate from the hills found in Western Uganda and later discharge their waters into Lake Victoria. The size of Ruizi catchment is 8,554.7sq.km, while Katonga is 13,842.8sq.km. Catchment description

6
Landsat images of year 1986 and 2014 were selected after every three months interval (Jan-March; April-June; July- September; October-December) A mean-shift based segmentation method Sensitivity to climate variability was assessed using climate elasticity of both streamflow and lake water levels. A household survey was conducted in 2014 to examine and validate the occurrence and re-occurrence of climatic variations. The Giovanni Merra Monthly data set was used develop a correlation map between precipitation and total runoff for the period 1986-2014 for both catchments Approach

7
Image classification 2014

8
The period January-March highly reflected the effects of climate variability than May and October period as experienced by both catchments for the last 30 years. Drought is the most climatic variable that caused significant impacts on the water resources. This is followed by hailstorms and floods. The most prevalent periods were 2010-2013, 1998-2001 and 1994-1997 which experienced significant climatic variations Key findings - climate varibility

9
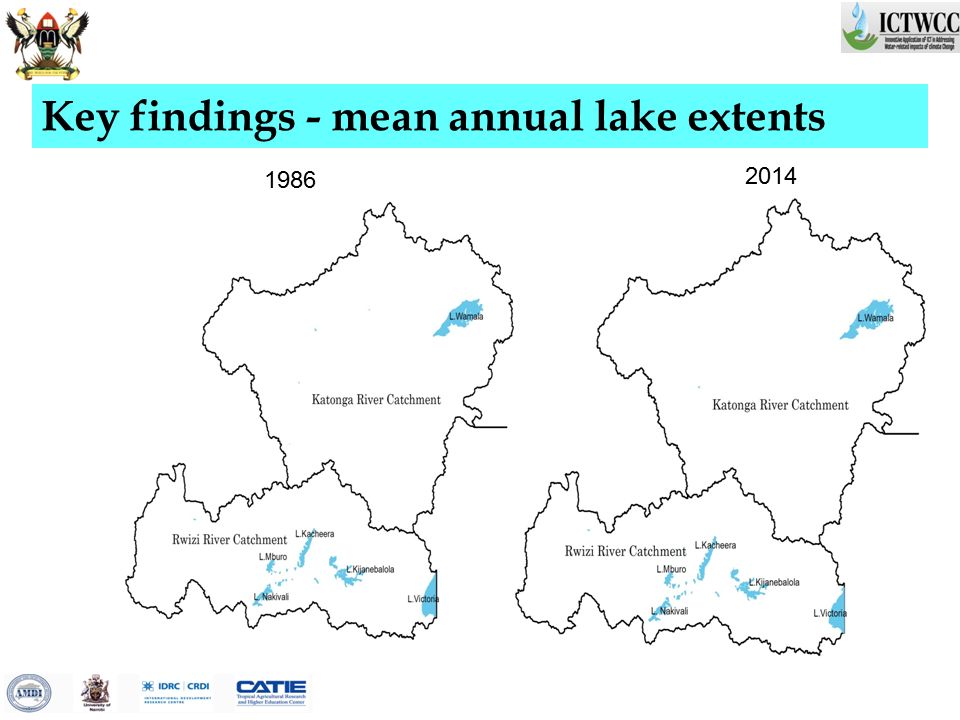
In Ruizi catchment, the highest change/decrease in the lake surface area between 1986-2014 was experienced from Lakes Victoria (22.7%), Nakivali (4.4%) and Kijanebalola (0.7%). Whilst a slight increase was recorded for Lakes Kacheera and Mburo. In Katonga catchment, the surface area of Lake Wamala decreased by 62.3sq.km between 1986 and 2014 Key findings - mean annual lake extents

10
1986 2014
11
The results from the power law model and the linear statistical model estimated that the Katonga catchment was highly sensitive to changes in climatic variations than Ruizi catchment because; The changes in precipitation also reflected the changes in both the streamflow and water level Increases in the spatial variability of runoff reflect both catchment’s complex physiographic characteristics and land use types Key findings - sensitivity climate variability

12
The Katonga river catchment experienced a relatively higher rate of total surface runoff than Ruizi between 1986 and 2014 However, the intensity of total surface runoff was highly experienced in the Ruizi catchment Key findings - Overland runoff vs s-rainfall Rwizi Katonga

13
The frequency of drought events has reduced and is likely to reduce further if there are no holistic watershed conservation measures / strategies adopted to combat the events The reduction in the coverage (size) of lakes was high for the water bodies outside the protected areas. Therefore, lessons need to be learned from the protected areas in terms of monitoring and conserving water resources Land and water conservation measures implemented in both catchments should aim at water retention Decentralisation of climatic data collection - watershed levels Implications and recommendations - Policy

14
Thank you

Similar presentations


![Climate Change Impacts in the United States Third National Climate Assessment [Name] [Date] Water.](/12/3512938/big_thumb.jpg "Climate Change Impacts in the United States Third National Climate Assessment [Name] [Date] Water.>")


