Download presentation
Presentation is loading. Please wait.

1
Profiling E-Business Groups A Cluster Analysis Ilias Vlachos ivlachos@aua.gr Syros, 12-15 July, 2007

2
Research Questions Can we suggest that There are different types of companies (business groups), with consistent e- business behavior? Such as leaders, laggards, etc? If yes, which are their characteristics in terms of demographics (size, sales, etc), budget expenditure on icts, etc What determines consistent behavior? Size, values, expertise?
, budget expenditure on icts, etc What determines consistent behavior. Size, values, expertise .")
3
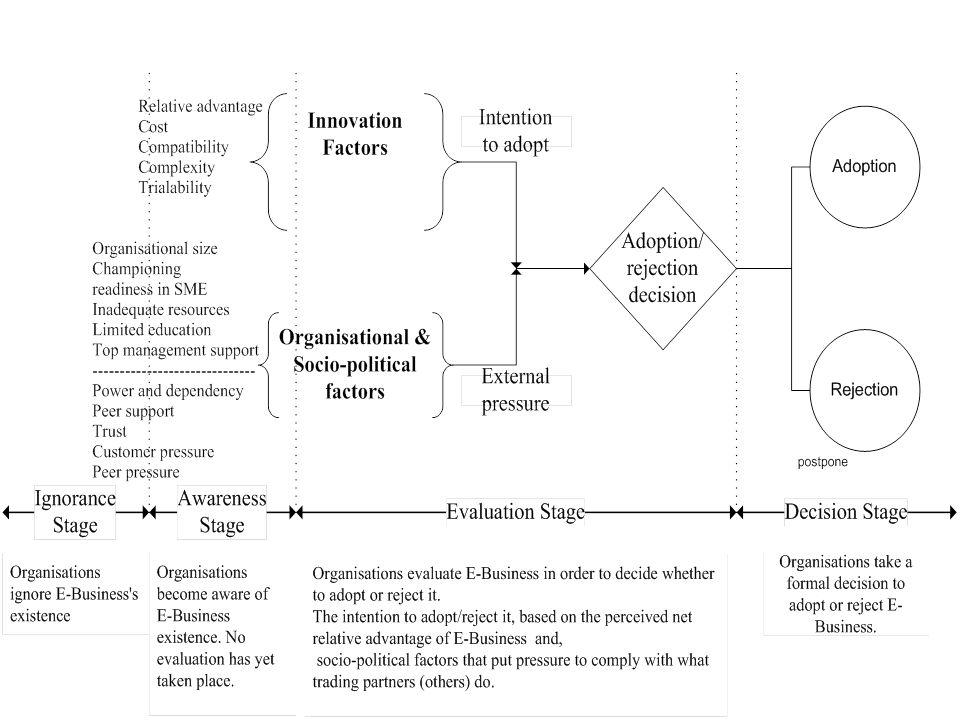
Theoretical Background Innovation Adoption

4
Theoretical Background BENEFITS Efficiency, “which allows users to work faster and often at measurably lower costs” Effectiveness, “which allows users to work better and produce higher quality work”, and Transformations that “change the basic ways that people and departments work and even change the very nature of the business enterprise” (p.21- 23). Gibson, C. F., and Jackson, B. B., The information imperative, D.C. Heath and Co., 1987.

6
Methods Empirical Research E-BusinessWatch Date: 2006, spring (http://www.ebusiness-watch.org/) Sample: 407 Demographics –Sector (Food and beverages 25,1%; Footwear 7,9%; ICT Construction 29,7%; Tourism 29,2%; Telecommunications 4,2%; Hospital activities 3,9%) –Size (1-9: 31,2%;10-49: 43,0%; 50-249: 17,4%; 250+: 6,6%)
 –Size (1-9: 31,2%;10-49: 43,0%; : 17,4%; 250+: 6,6%)")
7
METHODOLOGY The data collection of this study was based on the research project of European e-Business Market Watch 2006 (www.ebusiness-watch.org) in the European Union (EU)www.ebusiness-watch.org Questionnaire Data Description Module A:ICT infrastructure Module B:e-Skills Development Module C:ICT Expenditure and Investment Module D:Online Sourcing and Procurement Module E:Online Marketing and Sales Module F:e-Standards and interoperability issues Module G:ICT Impacts, Drivers and Inhibitors
 Questionnaire Data Description Module A:ICT infrastructure Module B:e-Skills Development Module C:ICT Expenditure and Investment Module D:Online Sourcing and Procurement Module E:Online Marketing and Sales Module F:e-Standards and interoperability issues Module G:ICT Impacts, Drivers and Inhibitors")
8
VARIABLES Demographics Sector Size ICT & E-Business Initiatives: WebSite Intranet ERP (Enterprise Resource Planning System) Knowledge Management Software EDM (Enterprise Document Management System) CRM (support marketing or sales processes by using specific IT solutions) SCM (Supply Chain Management System) E-Orders (how large a share of the total volume of your orders is placed online) E-Invoices (Please estimate the percentage of invoices your company sends) E-Invoices (Please estimate the percentage of invoices your company receives) Internet Access (Which technology does your company use to connect to the internet) ICT Budget (What was the share of your ICT budget, including hardware, software, services and personnel as percentage of your total company costs in 2006?
 Knowledge Management Software EDM (Enterprise Document Management System) CRM (support marketing or sales processes by using specific IT solutions) SCM (Supply Chain Management System) E-Orders (how large a share of the total volume of your orders is placed online) E-Invoices (Please estimate the percentage of invoices your company sends) E-Invoices (Please estimate the percentage of invoices your company receives) Internet Access (Which technology does your company use to connect to the internet) ICT Budget (What was the share of your ICT budget, including hardware, software, services and personnel as percentage of your total company costs in 2006")
9
CLUSTER ANALYSIS CLUSTERSN% 16416,0% 210426,0% 35914,8% 4369,0% 58120,3% 65614,0% BIC CRITERION BETWEEN CLUSTER 1=17413,623 TO CLUSTER 6=30,140

10
Cluster 1 (n=64) Cluster 2 (n=104) Cluster 3 (n=59) Cluster 4 (n=36) Cluster 5 (n=81) Cluster 6 (n=56) Website 97%67%49%97%62%29% Accounting Software 88%86%95%82%70%64% Intranet 86%65%53%11%0%0%0%0% ERP 81%37%27%25%0%0%0%0% CRM 63%7%9%17%5%0% SCM 50%13%31%6%0% EDM 47%47%15%29%29%0%0%0% Knowledge Management 33%9%9%24%3%3%0%
 Cluster 2 (n=104) Cluster 3 (n=59) Cluster 4 (n=36) Cluster 5 (n=81) Cluster 6 (n=56) Website 97%67%49%97%62%29% Accounting Software 88%86%95%82%70%64% Intranet 86%65%53%11%0%0%0%0% ERP 81%37%27%25%0%0%0%0% CRM 63%7%9%17%5%0% SCM 50%13%31%6%0% EDM 47%47%15%29%29%0%0%0% Knowledge Management 33%9%9%24%3%3%0%")
12
Cluster 1 (n=64) Cluster 2 (n=104) Cluster 3 (n=59) Cluster 4 (n=36) Cluster 5 (n=81) Cluster 6 (n=56) 56K (analogue) 0%3%17%22%16%11% ISDN 13%23%31% 33%52% broadband via DSL or Cable 53%64%47%39%46%16% Direct fibre connection & wireless 33%5%0%
 Cluster 2 (n=104) Cluster 3 (n=59) Cluster 4 (n=36) Cluster 5 (n=81) Cluster 6 (n=56) 56K (analogue) 0%3%17%22%16%11% ISDN 13%23%31% 33%52% broadband via DSL or Cable 53%64%47%39%46%16% Direct fibre connection & wireless 33%5%0%")
13
Cluster 1Cluster 2Cluster 3Cluster 4 Cluster 5Cluster 6 Average Personnel 2201041133 464 ICT budget 12%7%7%9%9%8%6%6%6% Size (employees) Distribution across clusters 1-9 2%1%45%9%0%43% 10-49 16%37%1%10%35%1% 50-249 31%38%0%7%24%0% 250+ 44%41%4% 7%0% Sector within cluster Food & beverage 22%24%29%22%23%34% Footwear 0%9%5%14% 7% Construction 17%33%41%6%25%41% Tourism 41%26%19%50%33%18% Telecommunications 17%1%3%8%0% Hospital activities 3%8%3%0%5%0% Sector Distribution across clusters Food & beverage 14%25%17%8%19% Footwear 0%0%28%9%16%34%13% Construction 10%30%21%2%18%20% Tourism 22%23%9%15%23%8% Telecommunications 65%6%12%18%0% Hospital activities 13%50%13%0%25%0%
 Distribution across clusters 1-9 2%1%45%9%0%43% %37%1%10%35%1% %38%0%7%24%0% %41%4% 7%0% Sector within cluster Food & beverage 22%24%29%22%23%34% Footwear 0%9%5%14% 7% Construction 17%33%41%6%25%41% Tourism 41%26%19%50%33%18% Telecommunications 17%1%3%8%0% Hospital activities 3%8%3%0%5%0% Sector Distribution across clusters Food & beverage 14%25%17%8%19% Footwear 0%0%28%9%16%34%13% Construction 10%30%21%2%18%20% Tourism 22%23%9%15%23%8% Telecommunications 65%6%12%18%0% Hospital activities 13%50%13%0%25%0%")
21
Discussion Cluster 1leaders Large Companies (220), Telecommunications, extensive use of e- business Cluster 2effectiveness medium-sized (104), various sectors, CRM 7%, SCM 13%, ERP 37% Cluster 3 efficiency- internal small-size (11), various sectors, 9% budget to ICT, website (49%), SCM (31%), CRM 9% Cluster 4 efficiency- external medium (33), 50% tourism, website 97%, CRM 17% Cluster 5 Laggards- technologic medium (46), various sectors (tourism 33%), website 62%, rest-->0% Cluster 6Laggards-size micro (4%), food (34%), website (29%), accounting (64%)
, Telecommunications, extensive use of e- business Cluster 2effectiveness medium-sized (104), various sectors, CRM 7%, SCM 13%, ERP 37% Cluster 3 efficiency- internal small-size (11), various sectors, 9% budget to ICT, website (49%), SCM (31%), CRM 9% Cluster 4 efficiency- external medium (33), 50% tourism, website 97%, CRM 17% Cluster 5 Laggards- technologic medium (46), various sectors (tourism 33%), website 62%, rest-->0% Cluster 6Laggards-size micro (4%), food (34%), website (29%), accounting (64%)")
22
Questions Remain… Is this solution (6 groups) consistent? Is this solution suggest there are business groups based on their values (long-term characteristics: strategy, vision, innovativeness, etc) Comparison across countries, sectors? Future: Test/compare across-within sectors, countries Test more variables…
 Comparison across countries, sectors. Future: Test/compare across-within sectors, countries Test more variables….")
Similar presentations


 Report : Yu-Juan Chiu Date.>")


