Download presentation
Presentation is loading. Please wait.

1
Exploring the Medical Laboratory Quality ToolBox-A
Michael A Noble MD FRCPC Clinical Microbiology Proficiency Testing program Program Office for Laboratory Quality Management University of British Columbia Vancouver BC

2
Management by the Moment

3
Management by the Moment
You can try to fix them… Management by the Moment

4
Management by the Moment
But they never go away! Management by the Moment 4

5
So the better approach is…
An systemic approach of organization, plan, review, and action gives you the best chance of success.

6
The Quality Toolbox The Quality Toolbox The Quality Toolbox Lean
Surveys Six Sigma RISK FMEA Metrics Statistics The Quality Toolbox The Quality Toolbox

7
What are quality tools? LEAN Six Sigma ISO 9001: 2000 A quality tool is a supplement or component part of a quality program that usually will not stand alone but can enhance the total quality system January 2009

8
Tools in the Toolbox Mega-Tools Tools/Techniques Lean
Six Sigma Priority Matrices and Risk Assessment Tools/Techniques Balanced Scorecards Brainstorming Control Charting Flow Charting Quality Indicators Surveys

9
Quality Indicators are Metrics (measured process information)
Determine quality of services. Highlight potential quality concerns, Identify areas that need further study and investigation, and Track changes over time.

10
A really good, inexpensive reference book
Amazon.com $30.00 A really good, inexpensive reference book

11
Keeping Score Using the Right Metrics to Drive World Class Performance 1996
Many organizations spend thousands of hours collecting and interpreting data. However many of these hours are nothing more than wasted time because they analyze the wrong measurements, leading to inaccurate decision making. Mark Graham Brown.

12
Characteristics of Good Metrics

13
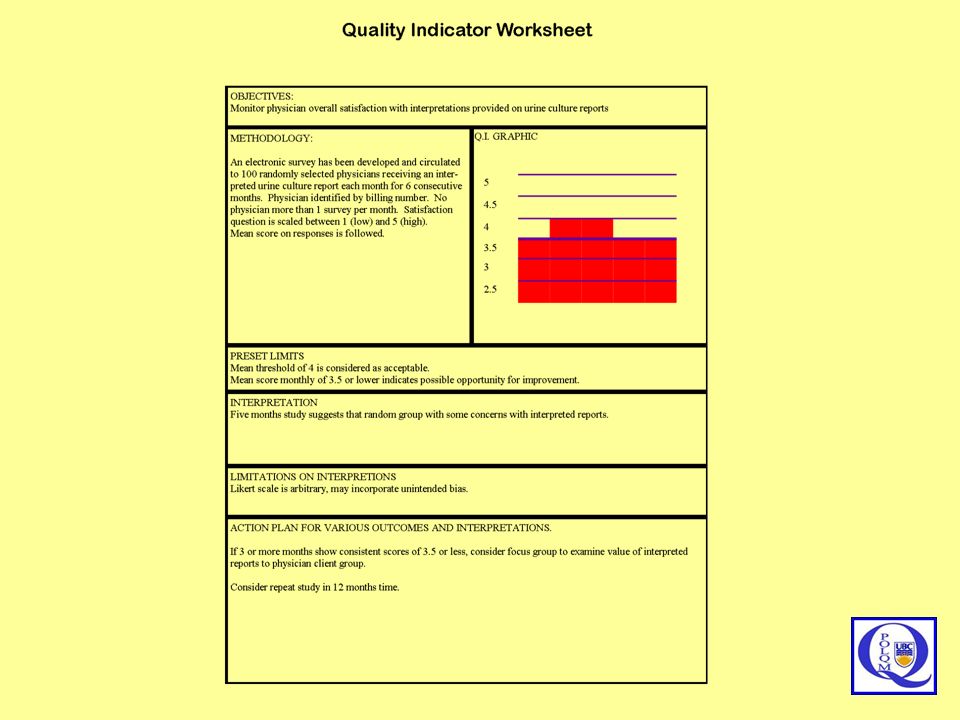
Objective Methodology Limits Interpretation Limitations Presentation
Seven Steps to Successful Indicators Do not start data collection until these are addressed Objective Methodology Limits Interpretation Limitations Presentation Action plan

15
Developing Indicators
Objective What are you trying to measure? Why am I collecting this information? Be specific Methodology How to capture the data What data needs to be captured Who (or what) to capture the data How often to capture the data Is it achievable (time, resources, revenue)? Limits Can I preset levels for: Acceptable, Concern, Unacceptable, Critical Presentation Graphic or Text Interpretation What does it mean? Does it reflect on YOUR quality? Can I compare it? Can I trend it? Limitations Unintended variables What does it not mean? Action Plan What will I do if it indicates acceptable performance? What will I do if it does not?
 to capture the data. How often to capture the data. Is it achievable (time, resources, revenue) Limits. Can I preset levels for: Acceptable, Concern, Unacceptable, Critical. Presentation. Graphic or Text. Interpretation. What does it mean Does it reflect on YOUR quality Can I compare it Can I trend it Limitations. Unintended variables. What does it not mean Action Plan. What will I do if it indicates acceptable performance What will I do if it does not")
16
Developing Indicators
Objective What are you trying to measure. Why am I collecting this information? Be specific Methodology How to capture the data What data needs to be captured Who (or what) to capture the data How often to capture the data Is it achievable (time, resources, revenue)? Limits Can I preset levels for: Acceptable, Concern, Unacceptable, Critical Presentation Graphic or Text Interpretation What does it mean? Does it reflect on YOUR quality? Can I compare it? Can I trend it? Limitations Unintended variables What does it not mean? Action Plan What will I do if it indicates acceptable performance? What will I do if it does not?
 to capture the data. How often to capture the data. Is it achievable (time, resources, revenue) Limits. Can I preset levels for: Acceptable, Concern, Unacceptable, Critical. Presentation. Graphic or Text. Interpretation. What does it mean Does it reflect on YOUR quality Can I compare it Can I trend it Limitations. Unintended variables. What does it not mean Action Plan. What will I do if it indicates acceptable performance What will I do if it does not")
17
Setting Relevant Limits and Ranges
Set Objectively Validate by Study Clinical Relevancy Customer Expectation Matched Benchmarks Regulation 60 minutes Relevant or Easy?

18
Assessing Quality Indicators
Importance Potential for Improvement Scientific Acceptability Reliability and Validity Feasibility Implementation and cost Usefulness Comprehensive Having Quality Quality Indicators

19
IQLM Indicator List Diabetes monitoring (system)
Hyperlipidemia screening (system) Test Order Accuracy and Appropriateness (pre-analytic) Patient Identification (pre-analytic) Adequacy and Accuracy of Specimen Information (pre-analytic) Blood Culture Contamination (pre-analytic) Accuracy of point-of-care testing (analytic) Cervical cytology/biopsy correlation (analytic) Critical Values Reporting (post-analytic) Turnaround time (post-analytic) Clinician satisfaction (post-analytic) Clinician follow-up (post-analytic)
 Test Order Accuracy and Appropriateness (pre-analytic) Patient Identification (pre-analytic) Adequacy and Accuracy of Specimen Information (pre-analytic) Blood Culture Contamination (pre-analytic) Accuracy of point-of-care testing (analytic) Cervical cytology/biopsy correlation (analytic) Critical Values Reporting (post-analytic) Turnaround time (post-analytic) Clinician satisfaction (post-analytic) Clinician follow-up (post-analytic)")
20
CLMA Survey Pre-examination Phase Indicator List
Ordered test is appropriate for patient care Patient consent appropriately collected Test utilization by clinician for best patient care Physician written order with every specimen Cost/benefit assessment for laboratory test menu Patient identification and its accuracy Preparation of patient for specimen collection Appropriate specimen container Timing of specimen collection Phlebotomy success Specimen integrity Specimen quantity Specimen transportation Accuracy of specimen identification Condition for specimen storage

21
CLMA Survey Examination Phase Indicator List
Quality Control EQA-external quality assessment Time to first result availability Specimen contamination Laboratory injuries or accidents Competency of testing personnel Vacancy of technical staff

22
CLMA Survey Post-examination Phase Indicator List
Result reporting accuracy Adequacy of information for interpretation of laboratory tests Report delivery turnaround time Consistency of critical values reporting Result interpretation by physician Patient’s satisfaction with laboratory services Patient’s satisfaction specifically with phlebotomy services Physician’s satisfaction with laboratory services

24
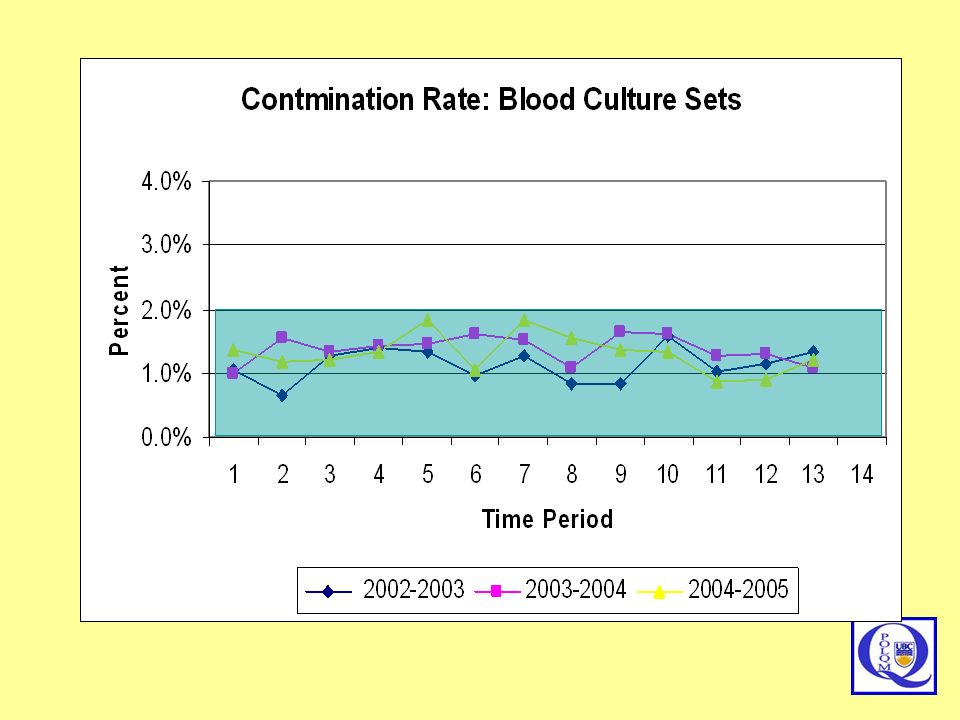
Objective: to ensure that blood culture results reflect sepsis.
Methodology: Count single bottle positives of common skin flora/ total sets Limits: Below 2% Interpretation: Meeting accepted limits all the time Limitations Definition may include some true infections and may miss others Presentation: Linear time graph Action plan: Identify and educate blood collector group. If stable for 2 years, then consider dropping from routine

25
Quality Indicators and Timing
Use an indicator only as long as it provides you with useful information. Don’t get tied to your indicators

27
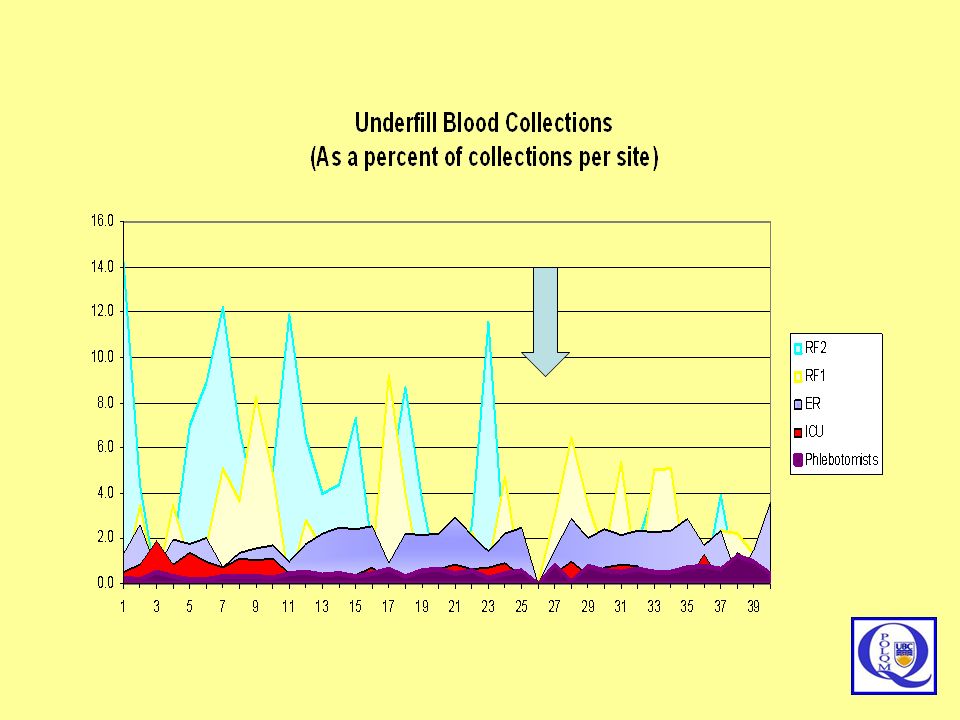
Objective: to ensure that blood culture are properly filled.
Methodology: Count underfilled bottles / total bottles collected Limits: Below 2% (?) Interpretation: Wards with inexperienced collectors have problems Limitations Some frail and elder people have very weak veins and may be impossible to collect Presentation: Linear time graph Action plan: Identify and educate blood collector group.
 Interpretation: Wards with inexperienced collectors have problems. Limitations Some frail and elder people have very weak veins and may be impossible to collect. Presentation: Linear time graph. Action plan: Identify and educate blood collector group.")
28
Caution about patient outcome indicators
Theoretically, outcomes best assess quality, but they are the most difficult to measure too many confusing variables Age, underlying conditions, therapy, circumstance require high volumes of detailed data need long collection periods David Hsia Medicare Quality Improvement Bad Apples or Bad Systems? JAMA. 2003;289:

29
Quality Indicators, Done Well, Will Consume More Time Than You Have
FACT: Quality Indicators, Done Well, Will Consume More Time Than You Have Don’t be an Indicators Glutton Set Priority Set Limits Drop Non-Productive Activity Target: 10-12

30
Computer Nonsense Metrics
[urine culture] * [glucose] * [INR] [NUPA hr] * [Telephone minutes] X100 Just because a computer can calculate a value, doesn’t mean that it should.

31
The BIG SECRET for Quality Indicator Team
Engage the folks who do the work, because they know what they do!

32
Risk Management helps define PRIORITIES
Risk management is activity directed towards assessing, mitigating (to an acceptable level) and monitoring of risks to an enterprise. Risk Management helps define PRIORITIES and helps PREVENT ERROR
 and monitoring of risks to an enterprise. Risk Management helps define PRIORITIES. and helps PREVENT ERROR.")
33
Tough Decisions 1 A group of 10 laboratories over 300 square miles considers centralizing all tests to a single facility. Improved cost efficiencies Simplified process control Closer oversight Improved utilization management Improved Patient Care Reduced clinical-lab interface Extended pre-examination phase Test delays Impeded Patient care

34
Tough Decision 2 A laboratory considers laboratory redesign based on LEAN analysis. Improved workflow Improved time efficiencies Solve ergonomic challenges Improved cost efficiencies Improved Patient Care Expensive renovations Construction interruptions Staff retraining Equipment specificity Test menu specificity Impeded Patient care

35
Tough Decision 3 Laboratory considers implementing a quality management team. Better information for better decisions Better process control Continual Improvement Process Improved Patient Care Staff Reallocation Increased immediate costs Quality Commitment Impeded Patient care

36
Tough Decision 4 A laboratory proposes the need for an on-site level 3 (increased biosafety level) microbiology laboratory. Improved biosafety Reduced laboratory infections Faster diagnosis Improved Patient Care Construction costs Operating costs Potential Bioterror target Impeded Patient care

37
Risk and Priority and Prevention are Relative Terms
Risk tolerance Risk transfer Risk reduction Risk prevention Risk avoidance Risk aversion COMFORT ACTION PRIORITY

38
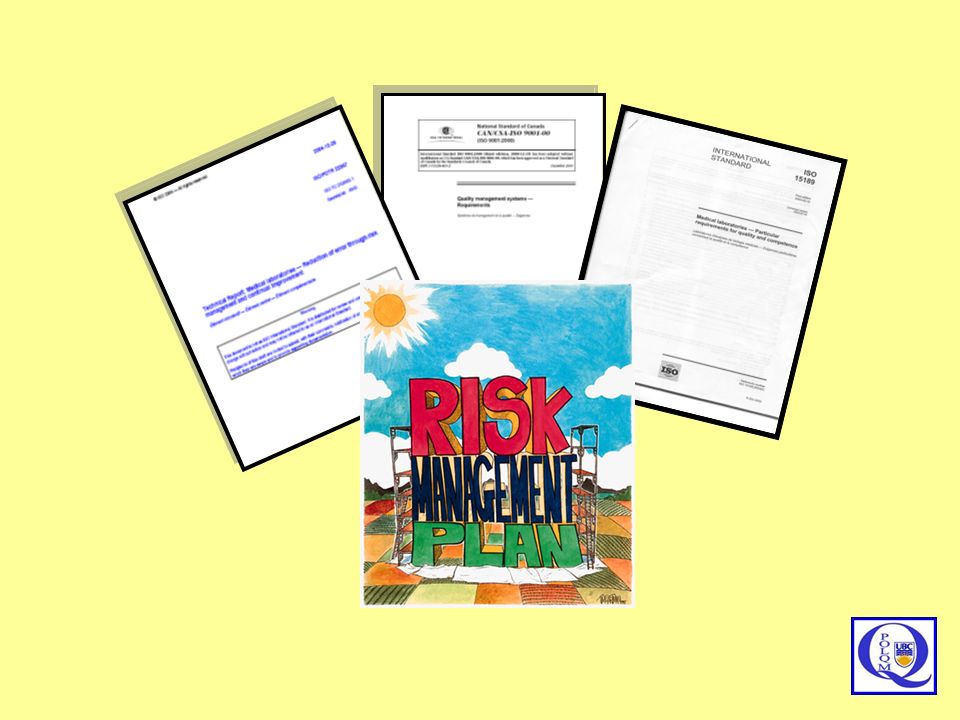
Risk Management Documents for the Medical Laboratory
ISO 14971:2007 Medical devices -- Application of risk management to medical devices ISO 20993:2006 Biological evaluation of medical devices -- Guidance on a risk-management process ISO WD TS22367:2007 Medical laboratories -- Reduction of error through risk management and continual improvement

39
Linking Quality and Risk Managements

40
Introduction to ISO TS 22367 “Risk management framework has been described as being of steps, planning for risk, identifying risk and its impacts, developing risk-handling strategies, and monitoring for risk control. These steps are consistent with management requirements as described in ISO 15189:2003 including identification and control of non-conformities, establishment of preventive and corrective actions, performance of internal audit and management review and continual improvement. It is the objective of this technical report to link these in the context of the medical laboratory.”

41
Linking Prevention and Risk ISO TS 22367
Assessment of risk of deviations from standard The quality manager should establish and maintain a process for identifying incidents associated with deviations from standards requirements, estimating and evaluating the associated risks to patient care, and controlling these risks and monitoring effectiveness of the control. The process should include a prospective risk assessment method for processes considered as high risk. Assessment of potentially high risk processes may be based upon previous audit, survey, experience, or evidence-based literature on procedures where a failure may lead to significant safety risk to patients.

42
Linking Prevention and Risk ISO TS 22367 (Continued)
The quality manager should identify a team of people to study the selected process. Note 1: The team should have personal knowledge of the process. Note 2: The team should be comprised of people with different levels and types of knowledge. The team should organize a thorough investigation of the process to include: a) each step of the process b) how each step of the process may fail c) how each failure at each step of the process may affect patient safety d) the rank of severity of each failure mode effect e) the most critical failure mode effects f) potential root causes of the most critical failure mode effects g) procedures to address the potential root causes. The analysis of this Failure Mode Effects Analysis should form the basis of a Prevention Action Plan.
 each step of the process b) how each step of the process may fail c) how each failure at each step of the process may affect patient safety d) the rank of severity of each failure mode effect e) the most critical failure mode effects f) potential root causes of the most critical failure mode effects g) procedures to address the potential root causes. The analysis of this Failure Mode Effects Analysis should form the basis of a Prevention Action Plan.")
43
Occurrence – Severity Grid (Qualitative)
Remote Rare Common Frequent Insignificant Mild Moderate Severe ACCEPTABLE RISK ACCEPTABLE RISK ACCEPTABLE RISK DEBATABLE RISK ACCEPTABLE RISK ACCEPTABLE RISK DEBATABLE RISK UNACCEPTABLE RISK ACCEPTABLE RISK DEBATABLE RISK DEBATABLE RISK UNACCEPTABLE RISK This is an occurrence-severity grid which essentially says the same as slide 23. If one can quantify the occurrence (remote – rare – common – frequent) or the severity of a potential error (insignificant – mild – moderate – severe) then it is possible to create a grid that indicates the differences between UNACCEPTABLE risk (which must be fixed) versus ACCEPTABLE risk which may be able to wait for a better time or a better solution. In this example errors with insignificant outcomes can wait to be fixed, unless that are happening almost all the time. On the other hand, any event with a severe outcome, even if it is remote in occurrence needs a strategy to be fixed. An example of a severe outcome situation would be one where an HIV detection assay has false negative or false positive results. In either situation, the outcome is intolerable, and a solution needs to be in place. An example for a minor error is where the lab printer jams. You can live with this annoyance up to a limit, but at some point, it is so annoying that even though the outcome does not affect patient care, at some point enough is enough and you need to consider getting a new printer. DEBATABLE RISK UNACCEPTABLE RISK UNACCEPTABLE RISK UNACCEPTABLE RISK
 or the severity of a potential error (insignificant – mild – moderate – severe) then it is possible to create a grid that indicates the differences between UNACCEPTABLE risk (which must be fixed) versus ACCEPTABLE risk which may be able to wait for a better time or a better solution. In this example errors with insignificant outcomes can wait to be fixed, unless that are happening almost all the time. On the other hand, any event with a severe outcome, even if it is remote in occurrence needs a strategy to be fixed. An example of a severe outcome situation would be one where an HIV detection assay has false negative or false positive results. In either situation, the outcome is intolerable, and a solution needs to be in place. An example for a minor error is where the lab printer jams. You can live with this annoyance up to a limit, but at some point, it is so annoying that even though the outcome does not affect patient care, at some point enough is enough and you need to consider getting a new printer. DEBATABLE. RISK. UNACCEPTABLE. RISK. UNACCEPTABLE. RISK. UNACCEPTABLE. RISK.")
44
Occurrence – Severity Grid (Semi-Qualitative)
Remote (0.2) Rare (0.4) Common (0.8) Frequent (0.9) Insignificant (0.1) Mild (0.2) Moderate (0.8) Severe (0.9) ACCEPTABLE RISK ACCEPTABLE RISK ACCEPTABLE RISK DEBATABLE RISK ACCEPTABLE RISK ACCEPTABLE RISK DEBATABLE RISK UNACCEPTABLE RISK This is an occurrence-severity grid which essentially says the same as slide 23. If one can quantify the occurrence (remote – rare – common – frequent) or the severity of a potential error (insignificant – mild – moderate – severe) then it is possible to create a grid that indicates the differences between UNACCEPTABLE risk (which must be fixed) versus ACCEPTABLE risk which may be able to wait for a better time or a better solution. In this example errors with insignificant outcomes can wait to be fixed, unless that are happening almost all the time. On the other hand, any event with a severe outcome, even if it is remote in occurrence needs a strategy to be fixed. An example of a severe outcome situation would be one where an HIV detection assay has false negative or false positive results. In either situation, the outcome is intolerable, and a solution needs to be in place. An example for a minor error is where the lab printer jams. You can live with this annoyance up to a limit, but at some point, it is so annoying that even though the outcome does not affect patient care, at some point enough is enough and you need to consider getting a new printer. ACCEPTABLE RISK DEBATABLE RISK DEBATABLE RISK UNACCEPTABLE RISK DEBATABLE RISK UNACCEPTABLE RISK UNACCEPTABLE RISK UNACCEPTABLE RISK
 Rare (0.4) Common (0.8) Frequent (0.9) Insignificant (0.1) Mild (0.2) Moderate (0.8) Severe (0.9) ACCEPTABLE RISK. ACCEPTABLE RISK. ACCEPTABLE RISK. DEBATABLE. RISK. ACCEPTABLE RISK. ACCEPTABLE RISK. DEBATABLE. RISK. UNACCEPTABLE. RISK. This is an occurrence-severity grid which essentially says the same as slide 23. If one can quantify the occurrence (remote – rare – common – frequent) or the severity of a potential error (insignificant – mild – moderate – severe) then it is possible to create a grid that indicates the differences between UNACCEPTABLE risk (which must be fixed) versus ACCEPTABLE risk which may be able to wait for a better time or a better solution. In this example errors with insignificant outcomes can wait to be fixed, unless that are happening almost all the time. On the other hand, any event with a severe outcome, even if it is remote in occurrence needs a strategy to be fixed. An example of a severe outcome situation would be one where an HIV detection assay has false negative or false positive results. In either situation, the outcome is intolerable, and a solution needs to be in place. An example for a minor error is where the lab printer jams. You can live with this annoyance up to a limit, but at some point, it is so annoying that even though the outcome does not affect patient care, at some point enough is enough and you need to consider getting a new printer. ACCEPTABLE RISK. DEBATABLE. RISK. DEBATABLE. RISK. UNACCEPTABLE. RISK. DEBATABLE. RISK. UNACCEPTABLE. RISK. UNACCEPTABLE. RISK. UNACCEPTABLE. RISK.")
45
Severity – Occurrence Grid
Numerical Values Literature Benchmarks Consensus Experience Regardless of source, values should be both verified, and validated to fit the FMEA being performed.

46
HIV Testing Risk Evaluation Canadian versus American Risk Analysis
Remote (0.2) Rare (0.4) Common (0.8) Frequent (0.9) Insignificant (0.1) Mild (0.2) Moderate (0.8) Severe (0.9) ACCEPTABLE RISK ACCEPTABLE RISK ACCEPTABLE RISK DEBATABLE RISK ACCEPTABLE RISK ACCEPTABLE RISK DEBATABLE RISK UNACCEPTABLE RISK This is an occurrence-severity grid which essentially says the same as slide 23. If one can quantify the occurrence (remote – rare – common – frequent) or the severity of a potential error (insignificant – mild – moderate – severe) then it is possible to create a grid that indicates the differences between UNACCEPTABLE risk (which must be fixed) versus ACCEPTABLE risk which may be able to wait for a better time or a better solution. In this example errors with insignificant outcomes can wait to be fixed, unless that are happening almost all the time. On the other hand, any event with a severe outcome, even if it is remote in occurrence needs a strategy to be fixed. An example of a severe outcome situation would be one where an HIV detection assay has false negative or false positive results. In either situation, the outcome is intolerable, and a solution needs to be in place. An example for a minor error is where the lab printer jams. You can live with this annoyance up to a limit, but at some point, it is so annoying that even though the outcome does not affect patient care, at some point enough is enough and you need to consider getting a new printer. ACCEPTABLE RISK DEBATABLE RISK DEBATABLE RISK UNACCEPTABLE RISK ? UNACCEPTABLE RISK UNACCEPTABLE RISK UNACCEPTABLE RISK
 Rare (0.4) Common (0.8) Frequent (0.9) Insignificant (0.1) Mild (0.2) Moderate (0.8) Severe (0.9) ACCEPTABLE RISK. ACCEPTABLE RISK. ACCEPTABLE RISK. DEBATABLE. RISK. ACCEPTABLE RISK. ACCEPTABLE RISK. DEBATABLE. RISK. UNACCEPTABLE. RISK. This is an occurrence-severity grid which essentially says the same as slide 23. If one can quantify the occurrence (remote – rare – common – frequent) or the severity of a potential error (insignificant – mild – moderate – severe) then it is possible to create a grid that indicates the differences between UNACCEPTABLE risk (which must be fixed) versus ACCEPTABLE risk which may be able to wait for a better time or a better solution. In this example errors with insignificant outcomes can wait to be fixed, unless that are happening almost all the time. On the other hand, any event with a severe outcome, even if it is remote in occurrence needs a strategy to be fixed. An example of a severe outcome situation would be one where an HIV detection assay has false negative or false positive results. In either situation, the outcome is intolerable, and a solution needs to be in place. An example for a minor error is where the lab printer jams. You can live with this annoyance up to a limit, but at some point, it is so annoying that even though the outcome does not affect patient care, at some point enough is enough and you need to consider getting a new printer. ACCEPTABLE RISK. DEBATABLE. RISK. DEBATABLE. RISK. UNACCEPTABLE. RISK. UNACCEPTABLE. RISK. UNACCEPTABLE. RISK. UNACCEPTABLE. RISK.")
47
Quality Approaches Look Alike
Strategy Event Steps Corrective Action Plan PLAN MONITOR EXAMINE REMEDIATE AND CORRECT CONTROL Preventive Action Plan IDENTIFY DEVELOP STRATEGY Risk Management Six Sigma DEFINE MEASURE ANALYZE IMPROVE

48
Failure Mode Effects Analysis
FMEA is a systematic method of studying failure. 1940s US Armed Forces 1960s Aerospace (Apollo Space program) 1970s Ford Motor Company (post-Pinto) 1990s semiconductors, food service, plastics, software, and diagnostics equipment. Documented FMEA is a REQUIREMENT in the automotive, in-vitro diagnostics, and pharmaceutical industries. October 1, 2008
 1970s Ford Motor Company (post-Pinto) 1990s semiconductors, food service, plastics, software, and diagnostics equipment. Documented FMEA is a REQUIREMENT in the automotive, in-vitro diagnostics, and pharmaceutical industries. October 1,")
49
FMEA: Failure Mode Effects Analysis
In a process: where are points that the process is likely to break down? what is the probable occurrence of the different possible break-downs? what are the likely severity and consequences of the different possible break-downs? What is the priority list for addressing the different possible break-downs?

50
FMEA: Failure Mode Effects Analysis
FMECA Failure Modes Effects and Criticality Analysis FTA Fault Tree Analysis HACCP Hazards Analysis and Critical Control Points PDPC Process Design Program Chart

51
A Medical Laboratory FMEA
Sample Collection Physician Requisition Sample Transport Sample Set-up Sample Analysis

52
A Medical Laboratory FMEA
Site Identification Expertise Proper Container Equipment and stains working properly Workload Labelling Good Sample Sample Transport Time issues Sample Collection Physician Requisition Sample Set-up Sample Analysis Courier competent and available Proper Packaging

53
A Medical Laboratory FMEA
Site Identification Expertise Proper Container 0.6 0.4 0.3 0.5 0.2 Equipment and stains working properly Workload 0.5 Sample Transport 0.5 Labelling Good Sample Time issues 0.9 0.8 0.5 Sample Set-up 1.9 Sample Collection 1.5 Sample Analysis 1.3 Physician Requisition 0.5 Courier competent and available 0.2 Proper Packaging SEVERITY 0.3

54
A Medical Laboratory FMEA
Site Identification Expertise Proper Container 0.1 0.05 0.05 0.05 0.3 Equipment and stains working properly Workload 0.5 Sample Transport 0.8 Labelling Good Sample Time issues 0.1 0.1 0.5 Sample Set-up 0.25 Sample Collection 0.45 Sample Analysis 1.05 Physician Requisition 0.5 Courier competent and available 0.4 Proper Packaging OCCURENCE 0.4 54

55
Pre-Examination Grid Remote 0.2 Rare 0.5 Common 0.8 Frequent >1
Insignificant (0.2) Mild (0.5) Requisition Transport Moderate (0.8) Severe (>1) Set-up Collection Analysis October 1, 2008
 Mild (0.5) Requisition. Transport. Moderate (0.8) Severe (>1) Set-up. Collection. Analysis. October 1,")
56
FMEAs should ALWAYS be:
A warning about FMEA If done as a structured “top-down” exercise, many critical break points will be missed. If done as an unstructured “bottom-up” exercise, the team will get bogged down in minutiae FMEAs should ALWAYS be: Directed Team Efforts Planned Structured

57
The BIG SECRET for The FMEA Team
Engage the folks who do the work, because they know what they do!

58
Sten Westgard MS www.westgard.com August 2005
Even trying to implement just one of these programs requires more than tepid enthusiasm. And attempting to graft ISO or Lean or Six Sigma on top of current management practices is only a recipe for failure. None of these are “add on” programs – half-hearted or part-time implementations will produce only limited, temporary gains, at best. To enjoy enduring success, the organization must be willing modify its core DNA. So if your chief officers aren't willing to stake their careers (and their salaries) on the success of the program, then ISO/Lean/Six Sigma will be the equivalent of a one night stand: brief, exciting, but ultimately disappointing.
 on the success of the program, then ISO/Lean/Six Sigma will be the equivalent of a one night stand: brief, exciting, but ultimately disappointing.")
Similar presentations


>")

>")
 are.>")

 come from? Developed by the Aerospace industry in the1960s Spread to the Automotive industry >")
. You can freely download, adapt, and distribute this.>")

 HAZARD ANALYSIS AND CRITICAL CONTROL POINT (HACCP) SYSTEM Munira Mohamed Nazari School.>")


