Download presentation
Presentation is loading. Please wait.

1
UNESCO Desire – Net project Wind Energy Luciano Pirazzi Enea – Renewable Sources and Innovative Energy Cycles pirazzi@casaccia.enea.it

3
Operational experience Nowadays wind turbines are very reliable and perform with few operational difficulties. The average availability is generally over 98%. The availability of a wind turbine describes the amount of the time that it is actually functional, not out of order or being serviced. The capacity factor, which is an index mainly dependent on the site characteristics, is ranging from 0.20 to 0.35, with higher values in Ireland and New Zealand, where capacity factors over 0.35, and in some areas exceeding 0.40, are quite frequent. The capacity factor is expressed by ratio between the net electricity generated, for the time considered, and the amount of energy that could have been generated at continuous full-power operation during the same period.

4
Operational experience Wind turbines are designed with a life of 20 years or more. Danish studies have found that consumables such as gearbox oil and brake pads are often replaced at intervals of one to three years. Parts of the yaw system may be replaced every five years, and vital components exposed to fatigue loading, such as main bearings might be replaced once in the design light.

10
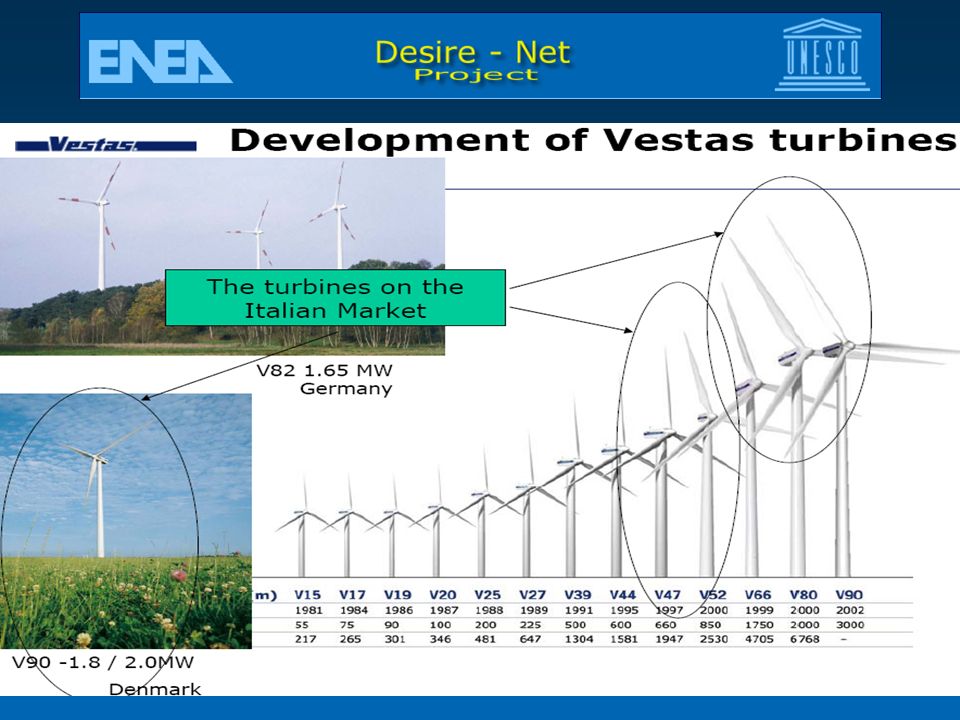
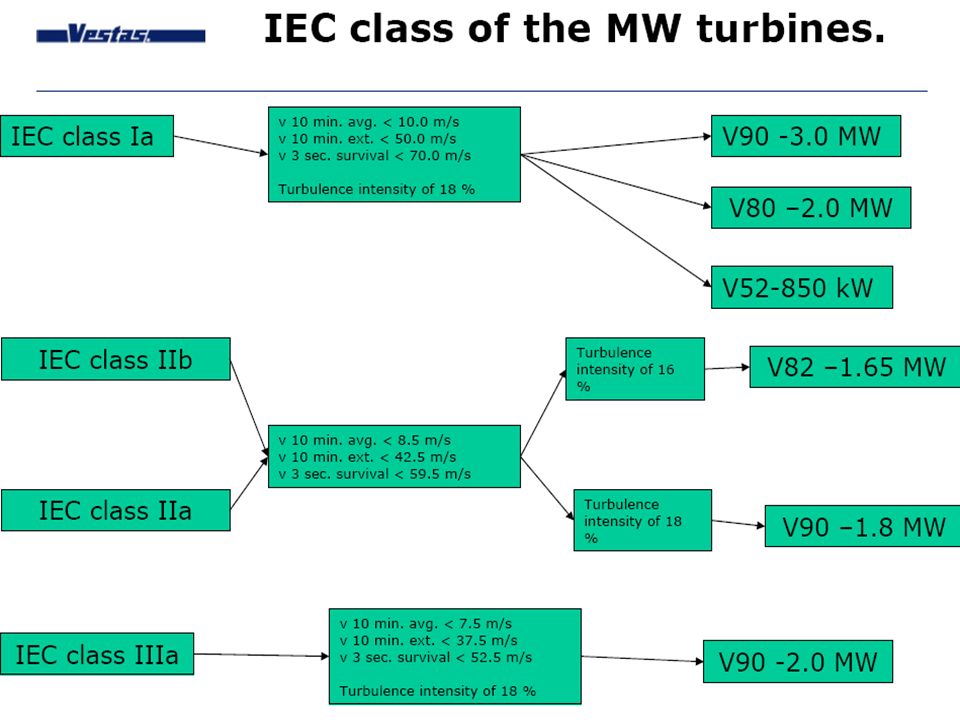
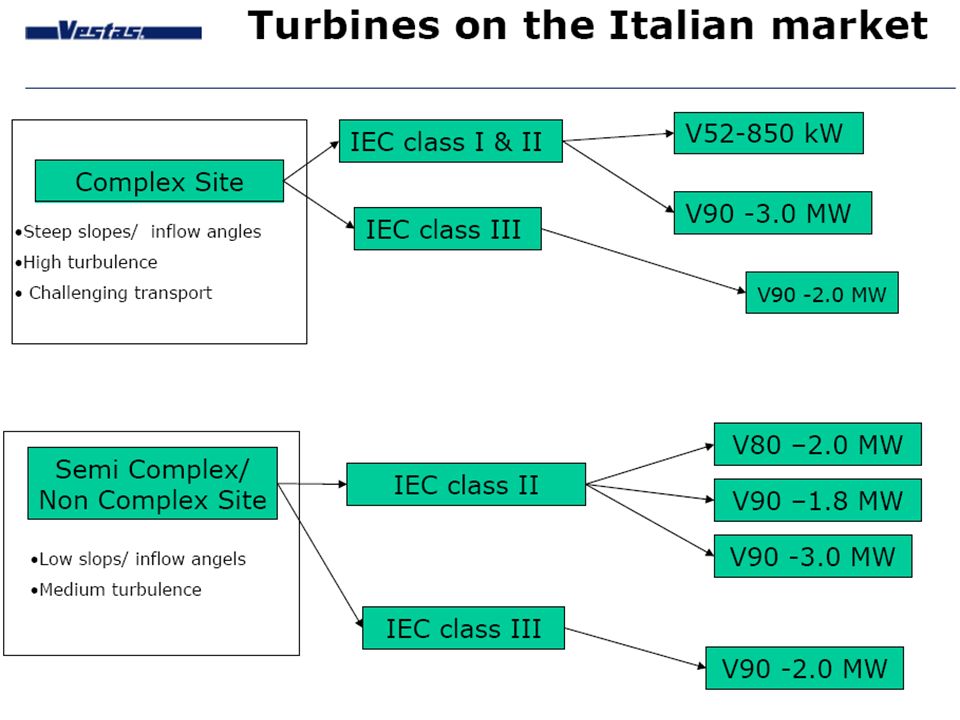
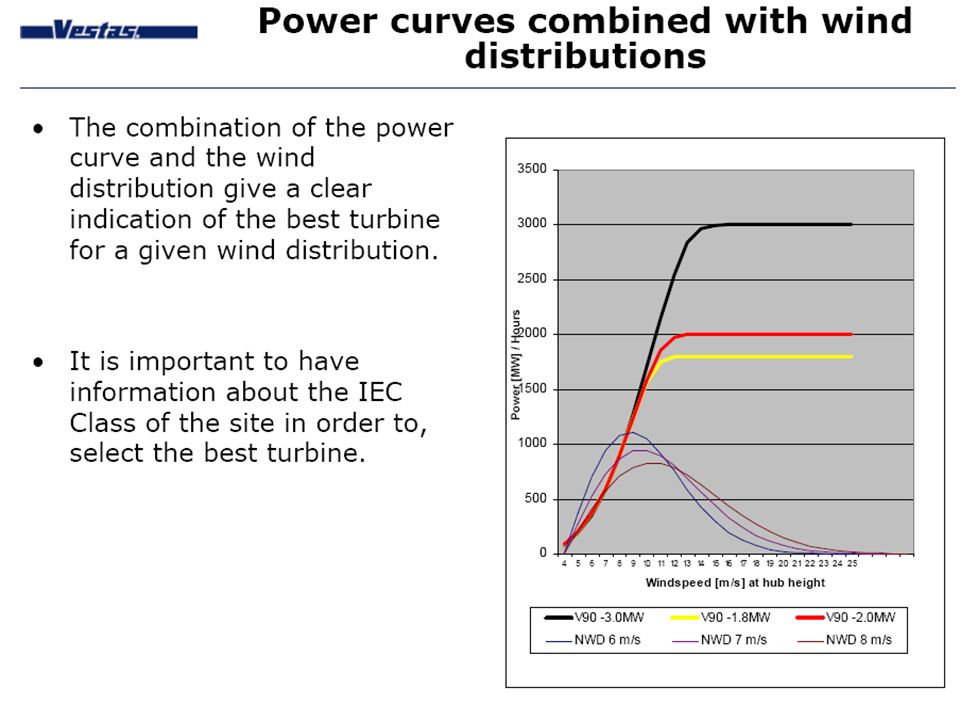
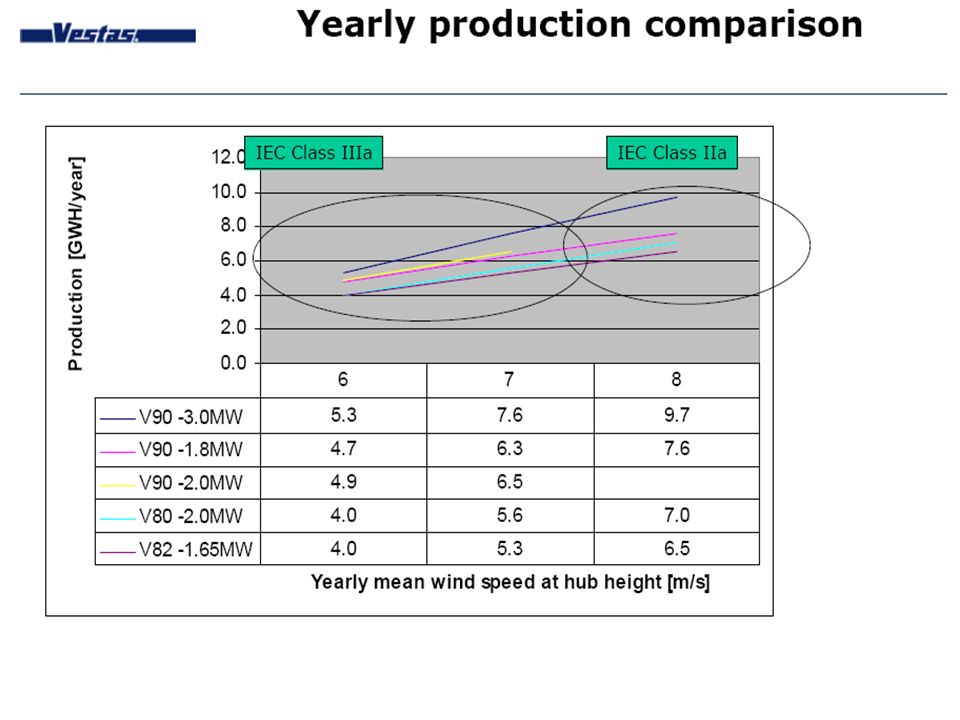
Selecting the right turbine In order to select the right turbine the following factors should be taken into consideration: IEC Class of the site Turbulence and spacing of turbines Site area. How big is the site Installed MW Hub height and visual impact Sound restrictions

20
Real time data collection OPC client server Met Mast monitoring Historical Data Subsystem > SQL > Report Engine Supervisory Control And Data Acquisition (SCADA)
")
21
Economics Wind energy prices: Wind energy prices are decreasing continuously. They fell by a factor of four from 1981 to 1996 Items included in energy price: Planning cost – capital cost of plant - construction costs – interest during construction – land costs – operating costs (O & M), including labour, materials, rents, taxes and insurance) - decommisioning Value of the global energy market in 2003 and 2004: 8 billion Euros each year in 2005 > 11 billion euros Job creation: about 200,000
, including labour, materials, rents, taxes and insurance) - decommisioning Value of the global energy market in 2003 and 2004: 8 billion Euros each year in 2005 > 11 billion euros Job creation: about 200,000.")
22
Current plant costs Key factors Installed costs Turbine prices Balance of plant costs: foundation costs, electrical interconnection costs, access track Installed costs and wind speeds Operational costs Size of wind farm Wind energy price Influence of wind speed National wind energy prices

23
External costs Hidden costs borne by governments Costs of damage caused to health Cost of global warming due to CO2 emissions Future price trends Trend towards larger wind turbines Falling infrastructure costs Reduction costs of raw materials?

24
Wind plant costs have been falling steadily and this trend is likely to continue No single figure can be assigned to price of wind energy On best sites, current wind prices are competitive with nuclear and gas plants External costs of thermal plants need to be taken into account Additional value of wind energy Offshore wind energy prices are moving down too but not so rapidly

25
Costs of wind energy and other energy sources Source: EWEA, 2003

26
Calculated Costs per kWh Wind Power as a Function of a Wind Regime at a Chosen Site (Number of full Load Hours)
")
27
Technolo gy CoalOilGasNuclea r Biomas s YdroPVWind c€/kWh 2 153 1113130,2 0,70,08 30,03 1 0,6 0,05 0,2 5 External costs of electricity production in the EU countries

28
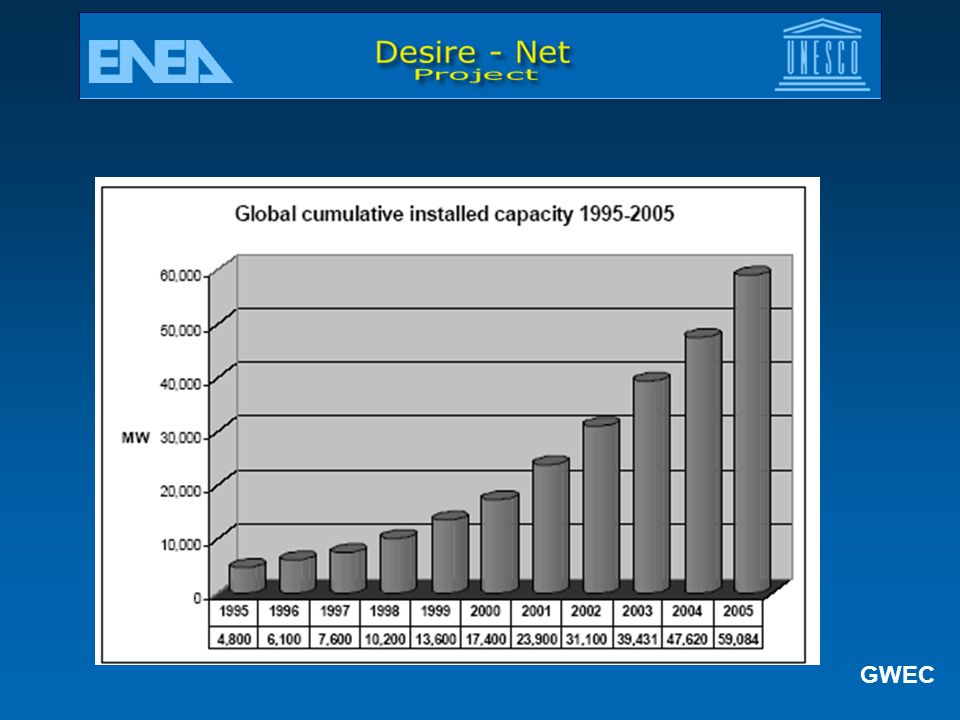
Market Cumulative wind installed capacity at end 2005

29
WIND FORCE 12 SUMMARY RESULTS IN 2020 Total MW installed 1,254,030 Annual MW installed 158,728 TWh generated to meet 12% global demand 3,054 Co2 reduction (annual million tonnes) 1,832 Co2 reduction (cumulative million tonnes) 10,771 Total investment per annum €80 billion Total job years 2.3 million Installation costs in 2020 €512/kW Electricity generation costs in 2020 €2.45cents/kWh
 1,832 Co2 reduction (cumulative million tonnes) 10,771 Total investment per annum €80 billion Total job years 2.3 million Installation costs in 2020 €512/kW Electricity generation costs in 2020 €2.45cents/kWh")
30
GWEC

36
Wind Energy and the Environment The large-scale use of renewable energy sources is essential if the necessary reductions in CO2 and other emissions from electricity generation are to be met and if sustainable development and sustainable growth are to be achieved.

37
Carbon dioxide savings and market development 2003-2020 (Wind Force 12 scenario)
")
38
Environmental benefits Environmental pollution and the emission of CO2 (carbon dioxide) from the use of fossil fuels constitute a threat to health, the environment and sustainable economic growth. Other major pollutants from conventional electricity, which are avoided through wind power, include SO2,NOx and PM10.

39
External costs The environmental benefits associated with the generation of electricity from renewable energy, including wind power, can be quantified in economic terms. These benefits are not fully reflected in the market prices paid for wind generated electricity. Examples of external costs include effects on human health, damage to the environment, loss of amenity as well as economic effects such as payment of subsidies and employment benefits.

40
External costs The most detailed analysis of external costs to date has been carried out through the European Commission’s ExternE project. The ExternE report estimates that the cost of producing electricity from coal or oil would double and the cost of electricity production from gas would increase by 30 %, if external costs, in the form of damage to the environment and health, were taken into account.

41
Environmental impacts of wind energy Visual impact: Wind turbines are a relatively new feature in the European countryside, and have an impact on amenity. Attitudes towards them will depend on aesthetic judgements on beauty and diversity, which are subjective and with general reactions towards the technology. Consultation with, and acceptance by, local communities is essential, especially in rural areas where a particularly high value is placed on landscape amenity.

42
Sound emissions Modern wind turbine designs have improved to the point where mechanical noise is insignificant, so the issue is now aerodynamic noise from the turning blades. At a distance of 300 metres from a 1 MW wind turbine, the expected sound level would be 45 decibels (dBA).
..")
43
Noise level around a wind turbine distance 500 m 300 m 250 m 200 m 660 kW turbine:37.4 dBA42.7 dBA 44.4 dBA 46.5 dBA 1650 kW turbine:37.9 dBA43.2 dBA 44.9 dBA 47.0 dBA

44
Birds Collisions with turbines have been an issue at some older wind farm sites form the 1980s, especially the Altamont Pass in California – a result of poor siting, out-moded turbines and tower technology. Subsequent experiences in Germany and Denmark show that such effects can be avoided by responsible planning practice. Proper siting of turbines is important if adverse impacts are to be avoided. Wind-related avian collision fatalities represent 0.01 - 0.02% of annual avian fatalities in the US.

45
Construction The construction process usually takes no more than a few weeks depending on the size of the project. Once complete, apart from access roads, agricultural activity can resume right up to the turbine bases of an operational wind farm. Between 1-3% of a wind farm area is utilized by turbines, so up to 99% of the land is available for other uses.

46
Energy balance A 1997 study of a typical turbine by the Danish Wind Industry Association shows that a modern wind turbine recovers all the energy inputs involved in its manufacture and operating life within three to four months – i.e. that over its 20 year lifetime, an average turbine will provide 63-78 times more energy than used to construct, operate and eventually dismantle the turbine.

47
Public acceptance An analysis of public opinion surveys carried out in a number of EU countries, including Spain, the UK, Denmark, Germany and Sweden shows substantial majorities in favour of developing wind energy, especially when compared with other fuel sources. The surveys also show that local approval rises once a wind farm starts operating. In some countries, direct involvement of the general public in wind energy projects has helped to encourage acceptance.

48
Market stimulation Policy 1.legislative measures and targets 2.capital cost and feed-in price incentives Environmental benefits Domestic and free resource Job creation

49
DIRECTIVE 2001/77/EC OF THE EUROPEAN PARLIAMENT AND OF THE COUNCIL of 27 September 2001 on the promotion of electricity produced from renewable energy sources in the internal electricity market National indicative targets Support schemes Guarantee of origin of electricity produced from renewable energy sources Administrative procedures Grid system issues Summary report

50
The Commission shall assess to what extent: — Member States have made progress towards achieving their national indicative targets, — the national indicative targets are consistent with the global indicative target of 12 % of gross national energy consumption by 2010 and in particular with the 22,1 % indicative share of electricity produced from renewable energy sources in total Community electricity consumption by 2010.

51
Wind power is now a mainstream option for electricity generation. “I recognize the importance of wind power,” said President George Bush on February 20, 2006. “It’s possible we could generate up to 20% of our electricity needs through wind.” Twenty percent is the share that nuclear power provides today. Wind energy development creates jobs, and will inject $4 billion worth of investment into the U.S. economy in 2006. In rural communities where wind projects are installed, farmers earn $2,000 to $4,000 or more per year per turbine installed on their land, while continuing to grow crops up to the foot of the turbines.

52
Legislative measures in the US supporting renewables Federal Production Tax Credit In 1992 the Energy Policy Act was signed into law and included enactment of a Production Tax Credit (PTC) under Section 45 of the Internal Revenue Code of 1986. This credit was available to corporate entities building new renewable energy production facilities such as solar, biomass, wood chip, geothermal, and wind electric power production plants. The tax credit at inception of the law was $0.015 per kilowatt hour (kWh) produced by the facility, increased each year by the official rate of inflation from the previous year, for the first ten years of operation of the equipment. The current PTC rate is approximately $0.019 per kWh.
 produced by the facility, increased each year by the official rate of inflation from the previous year, for the first ten years of operation of the equipment. The current PTC rate is approximately $0.019 per kWh..")
53
The Renewables Portfolio Standard The Renewables Portfolio Standard (RPS) is a flexible, market- driven policy that can ensure that the public benefits of wind, solar, biomass, and geothermal energy continue to be recognized as electricity markets become more competitive. The policy ensures that a minimum amount of renewable energy is included in the portfolio of electricity resources serving a state or country, and -- by increasing the required amount over time -- the RPS can put the electricity industry on a path toward increasing sustainability. Because it is a market standard, the RPS relies almost entirely on the private market for its implementation. Market implementation will result in competition, efficiency and innovation that will deliver renewable energy at the lowest possible cost.

Similar presentations


: Diversifying the U.S. Electricity Portfolio Marc Santos 2008 ASME WISE Intern University of Massachusetts.>")


>")


