Download presentation
Presentation is loading. Please wait.

1
1 Welcome to the CLU-IN Internet Seminar Incremental-Composite Sampling Designs for Surface Soil Analyses, Module 1 of 4 Delivered: February 16, 2012, 2:00 PM - 4:00 PM, EST (19:00-21:00 GMT) Presenters: Deana Crumbling, EPA Superfund (crumbling.deana@epa.gov) Robert Johnson, Argonne National Laboratory (rljohnson@anl.gov) Moderator: Jean Balent, U.S. EPA, Technology Innovation and Field Services Division (balent.jean@epa.gov) Visit the Clean Up Information Network online at www.cluin.orgwww.cluin.org

2
2 Housekeeping Please mute your phone lines, Do NOT put this call on hold –press *6 to mute #6 to unmute your lines at anytime Q&A Turn off any pop-up blockers Move through slides using # links on left or buttons This event is being recorded Archives accessed for free http://cluin.org/live/archive/http://cluin.org/live/archive/ Go to slide 1 Move back 1 slide Download slides as PPT or PDF Move forward 1 slide Go to seminar homepage Submit comment or question Report technical problems Go to last slide

3
Incremental-Composite Sampling Designs for Surface Soil Analyses Introduction to 1 st Day Module 1.1 3

4
2/16/2012Clu-In Incremental-Composite Webinar Module 1.14 Overall Webinar Agenda 4-part series of 2-hr Clu-In webinars (Feb 20, 21, 24 & 27) Soil sampling fundamentals (Day 1) Terminology and existing sources of information (Day 1) Incremental and composite sampling designs (Day 2) –Incremental: Estimating average concentrations for a decision unit –Composites: Looking for contamination “hot spots” –More representative discrete samples Calculations and using Visual Sample Plan (VSP) (Day 3) Several case studies (Days 3 & 4) Interspersed periods for Q & A
 Soil sampling fundamentals (Day 1) Terminology and existing sources of information (Day 1) Incremental and composite sampling designs (Day 2) –Incremental: Estimating average concentrations for a decision unit –Composites: Looking for contamination hot spots –More representative discrete samples Calculations and using Visual Sample Plan (VSP) (Day 3) Several case studies (Days 3 & 4) Interspersed periods for Q & A")
5
2/16/2012Clu-In Incremental-Composite Webinar Module 1.15 Today’s Agenda Webinar purpose and goals Instructor introduction Soil sampling fundamentals –10-min Q & A Terminology and existing guidance/information –10-min Q & A

6
2/16/2012Clu-In Incremental-Composite Webinar Module 1.16 Webinar Purpose and Goal Multi-increment / Incremental / Composite soil sampling designs are generating interest EPA guidance clear that such designs are useful; but more implementation detail needed Other information sources are now filling that gap When done correctly these soil sampling strategies provide significant benefits to soil characterization programs Goal is foster understanding incremental and composite sampling strategies, and how to apply them

7
2/16/2012Clu-In Incremental-Composite Webinar Module 1.17 Instructors for the Webinar Series Deana Crumbling, crumbling.deana@epa.govcrumbling.deana@epa.gov Office of Superfund Remediation &Technology Innovation U.S. Environmental Protection Agency Washington, D.C. (703) 603-0643 Robert Johnson, rlj@anl.govrlj@anl.gov Environmental Science Division Argonne National Laboratory Argonne, Illinois (630) 252-7004
 Robert Johnson, Environmental Science Division Argonne National Laboratory Argonne, Illinois (630)")
8
2/16/2012Clu-In Incremental-Composite Webinar Module 1.18 Instructors (cont’d) Michael Stroh, Micheal.Stroh@dnr.mo.govMicheal.Stroh@dnr.mo.gov Hazardous Waste Program Missouri Department of Natural Resources (573) 522-9902
 Michael Stroh, Hazardous Waste Program Missouri Department of Natural Resources (573)")
9
2/16/2012Clu-In Incremental-Composite Webinar Module 1.19 Software Resources and Disclaimer Disclaimer: “References to product or service providers are for information purposes only and do not constitute endorsement” Several documents and 2 software programs referenced For more information on the software programs: –Visual Sample Plan (VSP) (http://vsp.pnl.gov/)http://vsp.pnl.gov/ –ProUCL (http://www.epa.gov/esd/tsc/software.htm)http://www.epa.gov/esd/tsc/software.htm
 ( –ProUCL (")
10
2/16/2012Clu-In Incremental-Composite Webinar Module 1.110 A Free (DOE & EPA Funded) Statistical Calculator & Visualization Tool to Aid Planning http://vsp.pnnl.gov/
 Statistical Calculator & Visualization Tool to Aid Planning")
11
2/16/2012Clu-In Incremental-Composite Webinar Module 1.111 A Free (EPA Funded) Data Exploration & Analysis Tool http://www.epa.gov/esd/tsc/software.htm
 Data Exploration & Analysis Tool")
12
Incremental vs. Composite Sampling Basic Differences Goal of incremental sampling is to find an average concentration over some defined area (a DU). –Uses 3 or more independent replicates to obtain a UCL Goal of composite sampling is to gain information about the spatial distribution of contaminants. –Accurate estimate of the concentration mean within the given area not required –Typically not use replicates over the composite area –Suppresses short-scale heterogeneity for a “single” sample & improves representativeness Composite uses fewer increments per sample than incremental sampling 12
. –Uses 3 or more independent replicates to obtain a UCL Goal of composite sampling is to gain information about the spatial distribution of contaminants. –Accurate estimate of the concentration mean within the given area not required –Typically not use replicates over the composite area –Suppresses short-scale heterogeneity for a single sample & improves representativeness Composite uses fewer increments per sample than incremental sampling 12.")
13
2/16/2012Clu-In Incremental-Composite Webinar Module 1.113 Key Take Away Points… Incremental and composite sampling designs provide significant advantages for soil characterization There are reasons for the different labels Strategies used need to match project goals (i.e., DQOs) Systematic planning and conceptual site models (CSMs) are critical to “getting it right” CAN find “hot spots” via an incremental-composite sampling strategy, BUT “hot spot” must be defined! Sample processing and correct subsampling prior to analysis is vital to data quality

14
Incremental-Composite Sampling Designs for Surface Soil Analyses Fundamental Concepts Module 1.2 14

15
2/16/2012Clu-In Incremental-Composite Webinar Module 1.215 Soil Sampling Fundamentals Soil sampling goals –What’s the question? The challenges of sampling soil Basic statistical concepts

16
2/16/2012Clu-In Incremental-Composite Webinar Module 1.216 Typical Soil Characterization Goals Looking for the presence of contamination above some threshold –Comparison to background –Comparison to not-to-exceed cleanup criteria –Looking for hot spots Calculating the average concentrations over an area of interest –Determining exposure point concentrations (EPC) for risk assessment (using UCL on the mean) –Comparison to area-averaged cleanup requirements
 for risk assessment (using UCL on the mean) –Comparison to area-averaged cleanup requirements")
17
2/16/2012Clu-In Incremental-Composite Webinar Module 1.217 Basic Concepts Sample: A portion of a population collected to characterize a population parameter of interest –Beware: Physical “sample” (1 jar or bag) vs. a statistical “sample” (a set of physical samples) Sample Support: The physical dimensions and characteristics of a physical sample –Critical concept for dealing w/ soil contamination –Sample support determines concentration result!!
 Sample Support: The physical dimensions and characteristics of a physical sample –Critical concept for dealing w/ soil contamination –Sample support determines concentration result!!.")
18
2/16/2012Clu-In Incremental-Composite Webinar Module 1.218 Surface layer potentially impacted by atmospheric deposition Illustration of Sample Support vertical soil profile This cartoon is ONLY to illustrate a concept: don’t make it overly complex! Assume the conc of this subsurface layer is already known to be “background” Has the surface soil layer been impacted by atmospheric deposition? Soil Cross-Section

19
2/16/2012Clu-In Incremental-Composite Webinar Module 1.219 Surface layer is the layer of interest Which of these sample supports is most representative of the soils of interest? Answer: Support #1. Why?: This sample contains only soil from the layer of interest. BUT… How could sample support #1 be modified to better represent the layer of interest? support #1 support #3 support #2 All soil within the sample support outline (white area) is considered to be a single sample. The sample is thoroughly homogenized before analysis.
 is considered to be a single sample. The sample is thoroughly homogenized before analysis..")
20
2/16/2012Clu-In Incremental-Composite Webinar Module 1.220 Having a “representative sample” implies the decision maker can confidently extrapolate concentration results from the tiny analytical subsample mass back to the much larger soil mass from whence it came The degree to which sample reflects the original population in one or more key characteristics of interest as defined by the context of the decision RCRA (40 CFR 260.10): “Representative sample means a sample of a universe or whole (e.g., waste pile, lagoon, ground water) which can be expected to exhibit the average properties of the universe or the whole.” Representativeness
: Representative sample means a sample of a universe or whole (e.g., waste pile, lagoon, ground water) which can be expected to exhibit the average properties of the universe or the whole. Representativeness")
21
1985 PCB guidance URL: http://www.epa.gov/epawaste/ hazard/tsd/pcbs/pubs/subpartmopr.pdf TSCA’s Area of Inference 2/16/201221Clu-In Incremental-Composite Webinar Module 1.2

22
2/16/201222 The “area of inference” is easy to determine for gridded designs; much harder for random designs Needs a Thiessen Diagram Clu-In Incremental-Composite Webinar Module 1.2 22

23
Sampling Unit (SU) Sampling Unit = the volume of soil represented by a single sample and data result; the “area of inference” for a sample If 10 individual samples for analysis are taken from Area A, then there are 10 SUs in Area A –If 1 of those 10 samples gets a collocated QC sample, and another gets a field duplicate QC sample, there are still 10 SUs If a single sample for analysis is taken for Area A, then there is 1 SU for Area A (Area A = the SU) 2/16/2012Clu-In Incremental-Composite Webinar Module 1.223
 Sampling Unit = the volume of soil represented by a single sample and data result; the area of inference for a sample If 10 individual samples for analysis are taken from Area A, then there are 10 SUs in Area A –If 1 of those 10 samples gets a collocated QC sample, and another gets a field duplicate QC sample, there are still 10 SUs If a single sample for analysis is taken for Area A, then there is 1 SU for Area A (Area A = the SU) 2/16/2012Clu-In Incremental-Composite Webinar Module 1.223")
24
A1A1 A3A3 A2A2 A4A4 Sampling Unit (SU) (cont’d) If 30 increments from Area A are combined into a single composite sample for analysis, Area A has 1 SU (1 data result generated from entire Area A) –If 3 replicate 30 increment composites are taken from Area A, there is still only 1 SU If Area A is divided into 4 adjacent, non- overlapping areas which are sampled separately (by a discrete sample or by a composite), there are 4 SUs in Area A 2/16/2012Clu-In Incremental-Composite Webinar Module 1.224
 (cont’d) If 30 increments from Area A are combined into a single composite sample for analysis, Area A has 1 SU (1 data result generated from entire Area A) –If 3 replicate 30 increment composites are taken from Area A, there is still only 1 SU If Area A is divided into 4 adjacent, non- overlapping areas which are sampled separately (by a discrete sample or by a composite), there are 4 SUs in Area A 2/16/2012Clu-In Incremental-Composite Webinar Module 1.224")
25
Sampling Units 2/16/2012 25 Discrete sampling: How many SUs? (12) Compositing: How many SUs? (9) increment composite Clu-In Incremental-Composite Webinar Module 1.2
 Compositing: How many SUs. (9) increment composite Clu-In Incremental-Composite Webinar Module 1.2.")
26
Spatial Scales of Data Variability Data Variability: variations in the measured magnitude of a population characteristic 2/16/201226 Micro-scale, within sample jar: measured by lab duplicates (2 analytical subsamples taken from same sample jar) Lab dup examples from actual site data. Population characteristic being measured = Pb conc Clu-In Incremental-Composite Webinar Module 1.2

27
Next Higher Spatial Scale “Co-located” samples Collocated samples are located close to each other (inches to a few feet) and considered equivalent 2/16/201227 Soil TNT Example “Equivalent” means that 1 sample is as likely to be collected as another from the “same” sampling location. Chance governs where the field technician bends down to dig. Clu-In Incremental-Composite Webinar Module 1.2

28
2/16/2012Clu-In Incremental-Composite Webinar Module 1.228 Short-Scale Heterogeneity Arsenic in Samples from 3 Residential Yards (Note: micro-scale effects were controlled) Evenly spread over 7 ft As 17 41 367 351 268 Same yard, 15 ft away from group to left & spread over 4 ft As 29 24 79 120 As 129 221 61 39 14 1 ft apart over 4 ft Transect points 2 ft apart As 37 290 625 94 Same yard, 8 ft away from group to left; 2 ft apart As 27 29 45 34 Yard #1 Yard #2 Yard #3 From actual site
 Evenly spread over 7 ft As Same yard, 15 ft away from group to left & spread over 4 ft As As ft apart over 4 ft Transect points 2 ft apart As Same yard, 8 ft away from group to left; 2 ft apart As Yard #1 Yard #2 Yard #3 From actual site")
29
Short-scale Data Variability for U 2/16/2012Clu-In Incremental-Composite Webinar Module 1.229 Uranium investigation collocated sample group. “Collocated” means that any one of these sampling locations could be selected as a sampling point for the “same” discrete sample. Simple chance can lead to very different conclusions!

30
Variability at Highest Spatial Scale Large-scale variability: differences in concentration at the scale of typical sampling design spacing; the kind of conc. variability traditional sampling designs are trying to find 2/16/201230Clu-In Incremental-Composite Webinar Module 1.2 **** **** **** **** **** **** Contamination present

31
1 2 7 6 3 4 5 Heterogeneity Causes Data Variability Heterogeneity: Variations in matrix properties –Within-sample micro-scale heterogeneity –Short-scale, between-sample heterogeneity (affects agreement between collocated samples) –Large-scale, between-sample heterogeneity (on scale of conventional distances between samples) 2/16/201231Clu-In Incremental-Composite Webinar Module 1.2 **** **** **** **** **** ****
 –Large-scale, between-sample heterogeneity (on scale of conventional distances between samples) 2/16/201231Clu-In Incremental-Composite Webinar Module 1.2 **** **** **** **** **** ****")
32
The Properties of Soil Matrices Create Heterogeneity 2/16/2012Clu-In Incremental-Composite Webinar Module 1.232

33
Soil with low organic content, showing mineral grains with sizes spanning orders of magnitude (10X mag.) 332/16/2012Clu-In Incremental-Composite Webinar Module 1.2
 332/16/2012Clu-In Incremental-Composite Webinar Module 1.2")
34
2/16/2012Clu-In Incremental-Composite Webinar Module 1.234 (SEM = scanning electron microscopy) but arsenic mass is only 5 ng The Nugget Affect The iron in a cubic yard of soil can adsorb 0.5 to 5 pounds of metals & organics (Vance, 1994)
 but arsenic mass is only 5 ng The Nugget Affect The iron in a cubic yard of soil can adsorb 0.5 to 5 pounds of metals & organics (Vance, 1994)")
35
Clays Have a Layered Structure and a Very Small Particle Size 2/16/2012Clu-In Incremental-Composite Webinar Module 1.235 Clay particles showing plates. Uncopywrited photograph from http://en.wikipedia.org/wiki/Clay Small size & layers make for very large surface area to sorb contaminants. Also, layers are lined with negative charges, so are especially attractive to positively charged metals. Creates nugget effect.

36
Organic Contaminants Can Get Stuck between Clay Plates 2/16/2012Clu-In Incremental-Composite Webinar Module 1.236 Clay plates with embedded positively charged metallic ion (e.g., Ca++). Plates increase surface area and attractive forces available to bind contaminant molecules (DD = dibenzo-p-dioxin) Source: SRP Research Brief 183, 3/3/10, page 2
 Source: SRP Research Brief 183, 3/3/10, page 2.")
37
Organic Matter Also Binds Contaminants 2/16/2012Clu-In Incremental-Composite Webinar Module 1.237 Soil with high organic content. Mineral particles are embedded in the organic soil structure created by microbial activity breaking down vegetable matter. (40X magnification)
.")
38
Composition & Particle Size Create Within- Sample (Micro-Scale) Heterogeneity Firing Range Soil Grain Size (Std Sieve Mesh Size) Pb Concentration in fraction by AA (mg/kg) Greater than 3/8” (0.375”)10 Between 3/8” and 4-mesh50 Between 4- and 10-mesh108 Between 10- and 50-mesh165 Between 50- and 200-mesh836 Less than 200-mesh1,970 Bulk Total 927 (wt-averaged) 2/16/201238 Adapted from ITRC (2003) Clu-In Incremental-Composite Webinar Module 1.2
 Heterogeneity Firing Range Soil Grain Size (Std Sieve Mesh Size) Pb Concentration in fraction by AA (mg/kg) Greater than 3/8 (0.375 )10 Between 3/8 and 4-mesh50 Between 4- and 10-mesh108 Between 10- and 50-mesh165 Between 50- and 200-mesh836 Less than 200-mesh1,970 Bulk Total 927 (wt-averaged) 2/16/ Adapted from ITRC (2003) Clu-In Incremental-Composite Webinar Module 1.2")
39
Representativeness & Particles A representative subsample of a particulate solid is one that has the same ratio of particle sizes as the targeted parent material “Targeted” means that the particle size(s) of interest to the decision are defined during up- front planning and are isolated before analytical subsampling –E.g., risk assessment could be interested in dust sizes –Disposal might be interested in the bulk material 2/16/2012Clu-In Incremental-Composite Webinar Module 1.239
 of interest to the decision are defined during up- front planning and are isolated before analytical subsampling –E.g., risk assessment could be interested in dust sizes –Disposal might be interested in the bulk material 2/16/2012Clu-In Incremental-Composite Webinar Module 1.239")
40
Representative Sampling for Particulates 2/16/2012Clu-In Incremental-Composite Webinar Module 1.240 The difficulties of taking representative samples from particulate parent material (the large compartment in the center). Smaller samples are less likely to accurately represent the parent material than are larger samples. Particle heavily laden with contaminant (“nuggets) Parent material has med conc med conc ND/low conc high conc
 Parent material has med conc med conc ND/low conc high conc.")
41
... Figure adapted from Jeff Myers, 2001 Flatten a Jar to 2 Dimensions: High or Low Concentration & Sample Support Both Play Roles 4 Scenarios: 1) high conc + small support 2) high conc + larger support 3) low conc + small support 4) low conc + larger support.................................... 41............................................................................................................................................................................................................................................................................................. High Concentration Matrix Low Concentration Matrix 2/16/2012Clu-In Incremental-Composite Webinar Module 1.2
 high conc + small support 2) high conc + larger support 3) low conc + small support 4) low conc + larger support High Concentration Matrix Low Concentration Matrix 2/16/2012Clu-In Incremental-Composite Webinar Module 1.2.")
42
2/16/2012 42 A Good Time to Introduce Common Statistical Data Distributions Normal (Gaussian) distribution: –Can take on any (+ or -) value –Symmetric Lognormal distribution: –No negative values –Skewed to right Clu-In Incremental-Composite Webinar Module 1.2
 distribution: –Can take on any (+ or -) value –Symmetric Lognormal distribution: –No negative values –Skewed to right Clu-In Incremental-Composite Webinar Module 1.2")
43
2/16/2012Clu-In Incremental-Composite Webinar Module 1.243 Histogram graphics created with ProUCL Relationship Among Sample Support, Concentration, the Nugget Effect & Statistical Distributions Spotty contamination & small sample supports contribute to lognormal populations!! 43

44
44 Maximum Result Depends on Sample Support Graphic of actual data from a DOE americium-241 study (Gilbert & Doctor, 1985) Each analytical subsample support (1, 10, or 100 g) has its own distribution of data results. The larger the subsample support, the closer to normal the distribution of data results becomes. The more likely it is that any single result will be close to the true mean. Suppose this is an action level. How many data points exceed it for each subsample support? 2/16/2012Clu-In Incremental-Composite Webinar Module 1.2

45
2/16/2012Clu-In Incremental-Composite Webinar Module 1.245 Composites/incremental samples produce better estimates of the mean because the large sample support normalizes statistical data distributions. Comparison: Discrete samples collected in 1-m x 1-m cells within a 10-m X 10-m grid. 30-increment samples collected randomly throughout entire 10-m X 10-m grid. 2,4-DNT Results: Discrete Multi-increment Number of Samples: 100 10 Minimum: 0.0007 mg/kg 0.60 mg/kg Maximum 6.4 mg/kg 1.35 mg/kg Mean: 1.1 mg/kg 0.94 mg/kg Standard Deviation: 1.2 mg/kg 0.24 mg/kg Median: 0.65 mg/kg 0.92 mg/kg Distribution: Skewed Gaussian Adapted from Jenkins (USACE) presentation How is This Relevant for Compositing?
 presentation How is This Relevant for Compositing .")
46
Subsampling Errors Opportunities to unintentionally discriminate against certain particle sizes –Scoop from top of sample jar Particles segregated during transport or incorrect mixing (smallest particles fall to the bottom) –Shape of the scoop used to subsample the jar –Preferentially tapping in small particles to bring mass close to nominal when weighing out the analytical subsample 2/16/2012Clu-In Incremental-Composite Webinar Module 1.246
 –Shape of the scoop used to subsample the jar –Preferentially tapping in small particles to bring mass close to nominal when weighing out the analytical subsample 2/16/2012Clu-In Incremental-Composite Webinar Module 1.246")
47
2/16/2012Clu-In Incremental-Composite Webinar Module 1.247 Historically, the DQO Focus Has Been on Analytical Quality Emphasis on fixed-base laboratory analyses following well-defined protocols Analytical costs driven to a large degree by QA/QC requirements Result: –Analytical error typically small, on order of 30% or less for replicate analyses on an extract or control sample –Traditional laboratory data treated as “definitive” But definitive (definite) about what?
 about what")
48
2/16/201248 Decision Quality Only as Good as the Weakest Link in the Data Quality Chain SamplingAnalysisInterpretation Sample Support Sampling Design Sample Preservation Sub- Sampling Sample Prep Method Determinative Method Result Reporting Extract Cleanup Method Relationship between Measurement Parameter & Decision Parameter Each link represents a variable contributing toward the quality of the analytical result. All links in the data quality chain must be intact for data to be of decision-making quality! e.g., SW-846 method 8270 clerical checks Clu-In Incremental-Composite Webinar Module 1.2

49
2/16/2012Clu-In Incremental-Composite Webinar Module 1.249 Analytical vs. Sampling Error S ampling Error (SE) A nalytical Error (AE) T otal Error (TE) Uncertainties (errors) add according to (a 2 + b 2 = c 2 ) Examples: AE = 10 ppm, SE = 80 ppm: TE = 81 ppm (baseline) AE = 5 ppm, SE = 80 ppm: TE = 80 ppm (reduce analytical) AE = 10 ppm, SE = 40 ppm: TE = 41 ppm (reduce sampling) AE = 20 ppm, SE = 40 ppm: TE = 45 ppm (inc AE & dec SE)
 A nalytical Error (AE) T otal Error (TE) Uncertainties (errors) add according to (a 2 + b 2 = c 2 ) Examples: AE = 10 ppm, SE = 80 ppm: TE = 81 ppm (baseline) AE = 5 ppm, SE = 80 ppm: TE = 80 ppm (reduce analytical) AE = 10 ppm, SE = 40 ppm: TE = 41 ppm (reduce sampling) AE = 20 ppm, SE = 40 ppm: TE = 45 ppm (inc AE & dec SE).")
50
2/16/2012Clu-In Incremental-Composite Webinar Module 1.250 How is Data Uncertainty Reduced? For big analytical errors: –Modify current analytical method or choose a different analytical technique –Improve QC on existing techniques For subsampling errors: –Improve sample preparation (better homogenization & larger subsamples) For errors due to low sampling density in the field: Collect samples from more locations!
 For errors due to low sampling density in the field: Collect samples from more locations!.")
51
2/16/2012Clu-In Incremental-Composite Webinar Module 1.251 More Fundamentals: Basic Statistical Terms Mean: population average over an area of interest Median: half of the population distribution is below the median, and half above; middle value or 50 th percentile Range: interval defined by the minimum and maximum values Variance: a measure of the “spread” of values (continued)
")
52
2/16/2012Clu-In Incremental-Composite Webinar Module 1.252 More Basic Statistical Terms Standard Deviation: square root of the variance Coefficient of Variation (CV): ratio of standard deviation to mean, a measure of relative variability –also called relative standard deviation (RSD) Skewness: the degree to which one end of a statistical distribution is pulled out to one side Confidence Interval: range of values that estimates the uncertainty around a point estimate, such as a data result or a mean. –the true value is expected to be somewhere within that range some given amount (such as 95%) of the time
 of the time.")
53
Using Confidence Intervals to Communicate Uncertainty Confidence level is usually set at 95% by default, but others can be used The values at each end of the interval are called the confidence limits: lower (LCL) and upper (UCL) 95%LCL Mean 95%UCL Values between the confidence limits make up the confidence interval around the mean Width of confidence interval driven by: the confidence level, variability present in the data, assumptions about underlying data distribution & number of data points (n). 2/16/201253Clu-In Incremental-Composite Webinar Module 1.2

54
2/16/2012Clu-In Incremental-Composite Webinar Module 1.254 The Mismatch Between Statistics and Environmental Sampling In traditional statistics, the population units being sampled are clearly defined: –How many people with blood type O? unit = 1 person Sampling of soil or water has no unique units –Any amount can be collected. What is correct volume? Trouble is: volume determines the concentration!! No spatial considerations in traditional statistics –But, spatial relationships are paramount in environmental sampling

55
2/16/2012Clu-In Incremental-Composite Webinar Module 1.255 More Terms Decision Unit (DU): the volume of soil or set of objects treated as single unit for decision-making –Such as ¼-acre area to 2-inch depth, a bin of soil, a set of drums –Examples: exposure units, survey units, remediation units… Population: Set of objects or material volumes sharing a common characteristic –Can be same object set as DU, but doesn’t need to be
: the volume of soil or set of objects treated as single unit for decision-making –Such as ¼-acre area to 2-inch depth, a bin of soil, a set of drums –Examples: exposure units, survey units, remediation units… Population: Set of objects or material volumes sharing a common characteristic –Can be same object set as DU, but doesn’t need to be")
56
2/16/2012Clu-In Incremental-Composite Webinar Module 1.256 Future residential lots, DUs sized as exposure areas (EUs) Pesticide mixing area, DUs sized to assist remediation Example of Setting Decision Units (DUs)
 Pesticide mixing area, DUs sized to assist remediation Example of Setting Decision Units (DUs)")
57
2/16/2012Clu-In Incremental-Composite Webinar Module 1.257 We Can Pretend Heterogeneity Doesn’t Exist, But Data Quality Suffers

58
Incremental-Composite Sampling Designs for Surface Soil Analyses Terminology and Existing Guidance Module 1.3 58

59
What’s in a Name? Clu-In Incremental-Composite Webinar Module 1.3592/16/2012

60
Clu-In Incremental-Composite Webinar Module 1.3 “Composite” or “Multi-Increment” or “Incremental” Sampling Composite sampling - term used since 1985 in USEPA guidance to convey idea of “pooling” for several purposes Multi-Increment Sampling ® – term coined by Chuck Ramsey which he has trademarked as “MIS” Incremental sampling methodology (ISM) – term used by ITRC due to copyright infringement concern over “MIS”; goal is to obtain average concentration over DU Incremental-composite sampling – USEPA term to combine ITRC’s ISM with features from USEPA’s existing compositing guidance; goals include more than the average 60
 – term used by ITRC due to copyright infringement concern over MIS ; goal is to obtain average concentration over DU Incremental-composite sampling – USEPA term to combine ITRC’s ISM with features from USEPA’s existing compositing guidance; goals include more than the average 60")
61
2/16/2012Clu-In Incremental-Composite Webinar Module 1.3 All Share Common Characteristics All refer to collecting soil samples: –From physically separate locations (“increments”) –Then pooling to form one homogenized sample (termed a “composite sample” or “incremental sample”) Primary difference lies in their purpose; e.g., finding an average (incremental) vs searching for hot spots (a compositing technique) MIS ® involves a specific incremental sampling protocol that has been optimized for explosives residues, but can be generalized to other analytes 61
 –Then pooling to form one homogenized sample (termed a composite sample or incremental sample ) Primary difference lies in their purpose; e.g., finding an average (incremental) vs searching for hot spots (a compositing technique) MIS ® involves a specific incremental sampling protocol that has been optimized for explosives residues, but can be generalized to other analytes 61")
62
2/16/2012Clu-In Incremental-Composite Webinar Module 1.3 All Soil Samples Are “Composites” – Difference is Spatial Scale at Which it Occurs The source of the jar contents (the core) is a composite of particles The contents of the jar is a composite A heap of soil taken from a jar is a composite Even the pinch of soil extracted or digested for analysis is a composite 62
 is a composite of particles The contents of the jar is a composite A heap of soil taken from a jar is a composite Even the pinch of soil extracted or digested for analysis is a composite 62")
63
Incremental vs. Composite Sampling Basic Differences (1) Goal of incremental sampling: estimate the average concentration over some defined area/volume of soil This defined soil area/volume is the subject of a decision of e.g., risk/no risk or exceedance/no exceedance –Therefore, the defined area/volume is called a decision unit (DU) –Having 3 or more independent replicates allows calculation of an upper confidence limit (UCL) on the mean (i.e., a conservative estimate of the mean concentration) 2/16/2012Clu-In Incremental-Composite Webinar Module 1.363
 Goal of incremental sampling: estimate the average concentration over some defined area/volume of soil This defined soil area/volume is the subject of a decision of e.g., risk/no risk or exceedance/no exceedance –Therefore, the defined area/volume is called a decision unit (DU) –Having 3 or more independent replicates allows calculation of an upper confidence limit (UCL) on the mean (i.e., a conservative estimate of the mean concentration) 2/16/2012Clu-In Incremental-Composite Webinar Module")
64
DU-IS Single DU with 30 increments (having plug-shaped sample support) going into a single incremental sample (IS) Starting pt chosen at random along edge of DU 2/16/2012Clu-In Incremental-Composite Webinar Module 1.3 Incremental Sampling Taking a single incremental sample over a decision unit (DU) DU 64
 going into a single incremental sample (IS) Starting pt chosen at random along edge of DU 2/16/2012Clu-In Incremental-Composite Webinar Module 1.3 Incremental Sampling Taking a single incremental sample over a decision unit (DU) DU 64")
65
2/16/2012Clu-In Incremental-Composite Webinar Module 1.365 Replicate Incremental Samples

66
Incremental vs. Composite Sampling Basic Differences (2) Common goal of composite sampling: gain information about contaminants’ spatial distribution –Accurate or conservative estimate of the concentration mean within the given area not required –The “given area” is called a sampling unit (SU); typically smaller than the DU –Composite replicates not typically used –Improves representativeness of “single” sample representing a small area by suppressing short-scale heterogeneity Composite uses fewer increments per sample than incremental sampling 2/16/2012Clu-In Incremental-Composite Webinar Module 1.366
 Common goal of composite sampling: gain information about contaminants’ spatial distribution –Accurate or conservative estimate of the concentration mean within the given area not required –The given area is called a sampling unit (SU); typically smaller than the DU –Composite replicates not typically used –Improves representativeness of single sample representing a small area by suppressing short-scale heterogeneity Composite uses fewer increments per sample than incremental sampling 2/16/2012Clu-In Incremental-Composite Webinar Module")
67
2/16/2012Clu-In Incremental-Composite Webinar Module 1.367 One Way SU Composites Might be Used If DU needs cleanup, archived SU samples can be analyzed NOT replicates

68
MIS ®, ISM and ICS Requirements Upfront systematic planning!!! QAPP must discuss –Rationale for DU & increment number –Detailed procedures for field sample collection –Detailed instructions to lab for sample processing Sample mass reduction/spkitting? Sieving? Grinding? Target particle size? Incremental subsampling? Mass of analytical subsample? –Decision-making based on IS result (DU average) or UCL? –QC for the ISM/ICS process (Replicate ISs? Replicate subsamples?) Corrective actions? Clu-In Incremental-Composite Webinar Module 1.3682/16/2012
 or UCL. –QC for the ISM/ICS process (Replicate ISs. Replicate subsamples ) Corrective actions. Clu-In Incremental-Composite Webinar Module /16/2012.")
69
Clu-In Incremental-Composite Webinar Module 1.3 A Long History of EPA Composite Sampling Guidance 6 documents since 1985 go into some depth –1985 PCB Technical Guidance –1995 EPA Observational Economy Series –1996 Soil Screening Guidance, Part 4 –2002 EPA RCRA Sampling Technical Guidance –2002 EPA QA/G-5S –2006 EPA SW-846 Method 8330B (App. A) They do not cover all potential issues or details, but do provide a framework 69
 They do not cover all potential issues or details, but do provide a framework 69.")
70
2/16/2012Clu-In Incremental-Composite Webinar Module 1.3 1985 PCB Guidance on www.EPA.gov http://www.epa.gov/epawaste/hazard/tsd/pcbs/pubs/subpartmopr.pdf 70

71
2/16/2012Clu-In Incremental-Composite Webinar Module 1.3 Determining contaminant extent around a point source Characterizing an area while controlling short- scale heterogeneity 71

72
2/16/2012Clu-In Incremental-Composite Webinar Module 1.3 1995 Composite Sampling Guidance www.triadcentral.org/ref/ref/documents/composite.pdf August 1995 EPA-230-R-95-005 72

73
2/16/2012Clu-In Incremental-Composite Webinar Module 1.3 In 1995 EPA was Confident Compositing Would Catch On pp 7 & 8 73

74
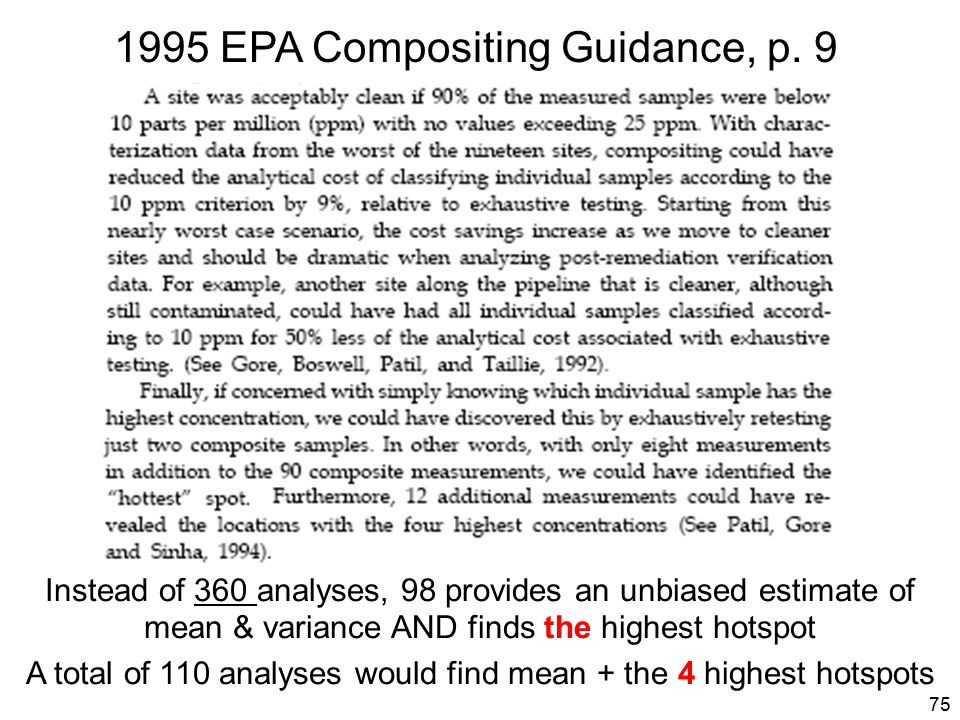
2/16/2012 pp. 8 & 9 Simulations run from actual site data show compositing produces accurate estimates of the mean but with much fewer analyses. 74

75
Instead of 360 analyses, 98 provides an unbiased estimate of mean & variance AND finds the highest hotspot A total of 110 analyses would find mean + the 4 highest hotspots 1995 EPA Compositing Guidance, p. 9 75
76
2/16/2012Clu-In Incremental-Composite Webinar Module 1.3 Put out by the SW-846 team URL: www.epa.gov/epawaste/hazard/testmethods/sw846/samp_guid.htm 76

77
Clu-In Incremental-Composite Webinar Module 1.3 RCRA Waste Sampling Draft Technical Guidance Planning, Implementation, and Assessment 77

78
2/16/2012Clu-In Incremental-Composite Webinar Module 1.3 RCRA Waste Sampling Draft Technical Guidance Planning, Implementation, and Assessment Provides discussion of Gy theory and subsampling issues 78

79
2/16/2012 URL: www.epa.gov/quality/qs-docs/g5s-final.pdf 36 pages of text & appendices on composite sampling 79

80
2/16/2012Clu-In Incremental-Composite Webinar Module 1.3 “INCREMENTAL-AVERAGE” 80

81
2/16/2012Clu-In Incremental-Composite Webinar Module 1.3 “COMPOSITE-SEARCHING” 81

82
2/16/2012 Clu-In Incremental-Composite Webinar Module 1.3 Incremental-Averaging vs Composite-Searching Decision Unit 1 Decision Unit 2 Decision Unit 3 Decision Unit 4 Decision Unit 5 Decision Unit 6 Sample Composite Searching Sampling Goal: determine average concentration over decision unit Form composite sample for analysis Decision Unit 1 Incremental Averaging increments Form composite sample for analysis Sampling Goal: looking for evidence of contamination across units 82

83
2/16/2012Clu-In Incremental-Composite Webinar Module 1.3 2 Tiers of Compositing: Composite-Searching Using 2 Tiers of Composite Sampling Bottom-tier composites must WELL processed before splittig portion for archive & another portion to go into top-tier composite 83

84
2/16/2012 Clu-In Incremental-Composite Webinar Module 1.3 http://www.epa.gov/epawaste/hazard/testmethods/pdfs/8330b.pdf Incremental Sampling Recommended in Energetic Residues Analysis Method 84

85
2/16/2012Clu-In Incremental-Composite Webinar Module 1.3 RAGS Vol 1, Part A 1989 http://epa.gov/oswer/riskassessment/ragsa/index.htm 85

86
2/16/2012Clu-In Incremental-Composite Webinar Module 1.3 What Does RAGS 1989 Say? Page 4-11 Page 4-19 This statement was written before other EPA guidance was issued that explained how to use compositing to find hotspots. 86

87
2/16/2012Clu-In Incremental-Composite Webinar Module 1.3 http://rais.ornl.gov/documents/UCLsEPASupGuidance.pdf 87

88
2/16/2012Clu-In Incremental-Composite Webinar Module 1.3 Calculating the Concentration Term – EPA 1992 Page 3 88

89
2/16/2012Clu-In Incremental-Composite Webinar Module 1.3 Calculating the Concentration Term – EPA 1992 Page 3 89

90
2/16/2012Clu-In Incremental-Composite Webinar Module 1.3 http://epa.gov/oswer/riskassessment/ragsd/index.htm RAGS Vol 1, Part D 2001 Publication 9285.7-47 December 2001 90

91
2/16/2012Clu-In Incremental-Composite Webinar Module 1.3 RAGS 2001 guidance mentions compositing only once, but in a way that implies acceptance Page 2-3 91

92
2/16/2012Clu-In Incremental-Composite Webinar Module 1.3 http://www.epa.gov/oswer/riskassessment/pdf/ucl.pdf 92

93
2/16/2012Clu-In Incremental-Composite Webinar Module 1.3 Calculating UCLs…Dec 2002 page 1 Incremental sampling reduces uncertainty in estimates of the true average 93

94
2/16/2012Clu-In Incremental-Composite Webinar Module 1.3 URL = http://www.epa.gov/superfund/health/conmedia/soil/index.htm Compositing “how to” covered on pages 81-132 94

95
2/16/2012Clu-In Incremental-Composite Webinar Module 1.3 SSG-TBD page 5 SSG-TBD page 89 95

96
2/16/2012Clu-In Incremental-Composite Webinar Module 1.3 SSG-TBD pages 89 & 90 96

97
2/16/2012Clu-In Incremental-Composite Webinar Module 1.397

98
2/16/2012Clu-In Incremental-Composite Webinar Module 1.3 “Incremental Sampling” per ITRC A structured sampling and subsampling protocol for representative & reproducible sampling of a well- defined soil area or volume (a decision unit) to obtain a concentration value representative of the average concentration over the entire decision unit ITRC ISM-1 document at a URL to be announced; or do Internet search for “ITRC ISM” 98
 to obtain a concentration value representative of the average concentration over the entire decision unit ITRC ISM-1 document at a URL to be announced; or do Internet search for ITRC ISM 98")
99
Other Recent Guidance Documents Hawaii state guidance for MIS at http://www.hawaiidoh.org/tgm-pdfs/HTGM%20Section%2004-02.pdf http://www.hawaiidoh.org/tgm-pdfs/HTGM%20Section%2004-02.pdf Alaska state guidance for MIS at http://dec.alaska.gov/spar/csp/guidance/multi_increment.pdf http://dec.alaska.gov/spar/csp/guidance/multi_increment.pdf Army Corps of Engineers http://www.hnd.usace.army.mil/oew/policy/IntGuidRegs/IGD% 209-02v2.pdf http://www.hnd.usace.army.mil/oew/policy/IntGuidRegs/IGD% 209-02v2.pdf 2/16/2012Clu-In Incremental-Composite Webinar Module 1.399

100
2/16/2012Clu-In Incremental-Composite Webinar Module 1.3 Key Components of Any Good Sampling Design –Project Planning & Field Sample Collection Well-formulated & explicitly stated sampling objectives to define the decision unit (DU). Determine whether data goal is only to determine DU average, or also to preserve spatial information. –Sample Processing and Subsampling Sample processing may begin in the field and finish in the lab, or all be done in the lab. Goal: maintain chain of sample representativeness for each step thru subsampling. As important for discrete designs as for ICS! 100

101
Correct Subsample Mass Depends on Largest Particle Size Larger particles require larger subsamples to avoid significant data variability due to sampling error Adapted from ASTM D6323 Sec. A1.1 If true conc = 100, with ±45% RSD = 12 – 188 for 95% uncertainty interval 2/16/2012101 If true = 100, with ±15% RSD = 70 – 130 for 95% uncertainty interval

102
2/16/2012Clu-In Incremental-Composite Webinar Module 1.3 Sample Processing Prior to Subsampling Obviously depends on soil type, moisture, etc.) –Drying: oven or air-drying –Disaggregation: breaking up clods –Sieving: separate out particle size fraction of interest –Grinding: mills & grinders (under some circumstances) Gy theory guides sample handling & subsampling to produce the analytical sample 102
 –Drying: oven or air-drying –Disaggregation: breaking up clods –Sieving: separate out particle size fraction of interest –Grinding: mills & grinders (under some circumstances) Gy theory guides sample handling & subsampling to produce the analytical sample 102")
103
2/16/2012Clu-In Incremental-Composite Webinar Module 1.3 http://www.clu-in.org/download/char/epa_subsampling_guidance.pdf 103

104
Subsampling with the rounded scoop preferentially gathers particles from the top and discriminates against those at the bottom. The correctly shaped tool is shown in the bottom panel. (Adapted from EPA/600/R-03/027) 2/16/2012Clu-In Incremental-Composite Webinar Module 1.3 “Incorrect” vs. “Correct” Subsampling 104 Incorrect tool Correct tool Collects more from the top than from the bottom of the layer Collects equally from both
 2/16/2012Clu-In Incremental-Composite Webinar Module 1.3 Incorrect vs. Correct Subsampling 104 Incorrect tool Correct tool Collects more from the top than from the bottom of the layer Collects equally from both.")
105
Vertical view of a correct sampling tool that gives all particles equal chance of being included in the subsample depending only on where their center of gravity lies with respect to the cutting edge of the tool. (From EPA/600/R-03/027) The 2003 EPA Subsampling Guidance The sampling tool “mouth” should be at least 3 times the size of the largest particle + 10 for particles <3 mm. For 2-mm particles, a “mouth” of 16 mm is recommended. 2/16/2012Clu-In Incremental-Composite Webinar Module 1.3105
 The 2003 EPA Subsampling Guidance The sampling tool mouth should be at least 3 times the size of the largest particle + 10 for particles <3 mm. For 2-mm particles, a mouth of 16 mm is recommended. 2/16/2012Clu-In Incremental-Composite Webinar Module")
106
2/16/2012Clu-In Incremental-Composite Webinar Module 1.3 1-D Slab Cake Sample Mass Reduction 106

107
2/16/2012Clu-In Incremental-Composite Webinar Module 1.3 Field subsampling from core to sample jar Lab subsampling to reduce sample volume for further processing Photo courtesy of Mark Bruce, TestAmerica 107 2-D Slab Cake Sample Mass Reduction See ITRC ISM-1, Section 2.6.6.7

108
2/16/2012Clu-In Incremental-Composite Webinar Module 1.3 From EPA 600/R-03/027 From Table 8. Subsampling methods that are NOT recommended based on experimental evaluation 108

109
2/16/2012Clu-In Incremental-Composite Webinar Module 1.3 Any Questions? 109

110
110 Resources & Feedback To view a complete list of resources for this seminar, please visit the Additional ResourcesAdditional Resources Please complete the Feedback Form to help ensure events like this are offered in the futureFeedback Form Need confirmation of your participation today? Fill out the feedback form and check box for confirmation email.

Similar presentations


 and XRF: Tools for Improved Soil Data Deana Crumbling USEPA Office of Superfund Remediation and Technology Innovation.>")


 Larry Baxter & Stan Harding Brigham Young University.>")


 Part 1 - Introduction to ISM – Jeffrey E. Patterson Jeffrey E. Patterson – TCEQ, Technical Specialist, Superfund.>")
