Download presentation
Presentation is loading. Please wait.

1
ASSESSING PAST USE OF TANNERY WASTE SLUDGE AS FARM FIELD FERTILIZER IN NORTHWEST MISSOURI July 20, 2010 ITRC Meeting Seattle, WA

2
BACKGROUND Sludge applied 1983-2009 56,000 acres affected 100+ locations across 4 counties Concern about risk posed by hexavalent chromium (Cr VI) in sludge.
 in sludge.")
3
CSM JACKPOT: TANNERY KEPT LOTS OF DATA ON SLUDGE APPLICATION

4
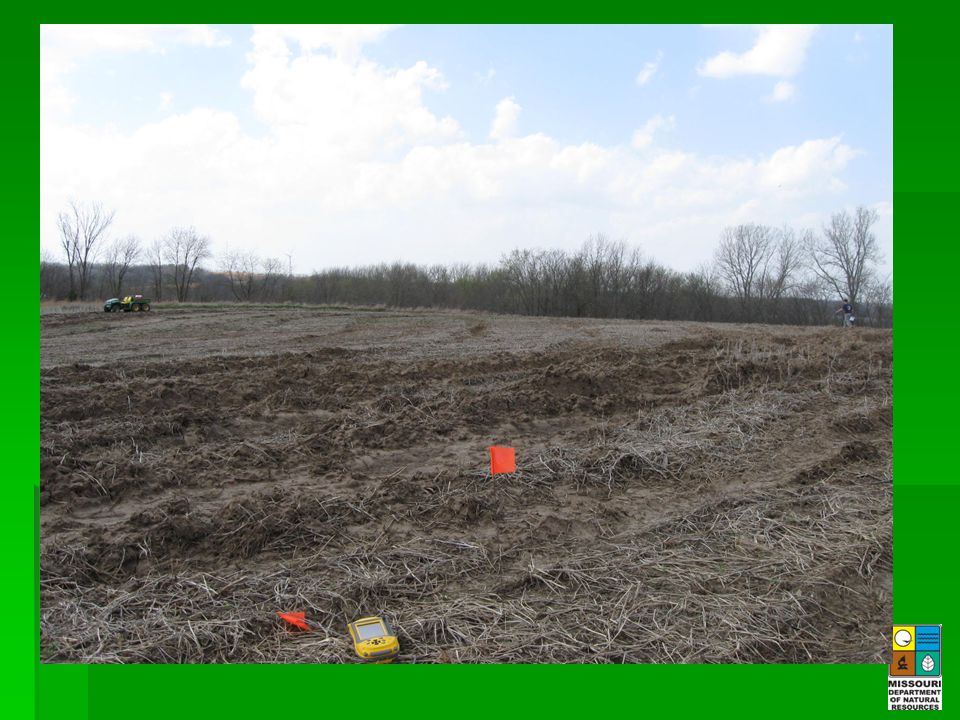
STUDY AREA

5
HERE COMES THE SLUDGE

6
CONCEPTUAL SITE MODEL Applications uniform except near buffers, corners, access gates. Appl. rates frequencies & mechanism known Runoff concentrates sludge in low areas High fOC, low pH, & high redox all act to reduce Cr VI to Cr III.

7
EXPOSURE PATHWAYS Direct exposure (inh/ingest) to soil by farmer & nearby residents. Interested in particle fraction <0.25mm Leaching to groundwater & GW ingestion Surface water, ecological risk (not assessed)
.")
8
CrVI SCREENING LEVELS Represent mean [CrVI] across exposure area that would pose risk to resident child living adjacent. Farm field = 86 ppm. Based on 80-acre field.
![CrVI SCREENING LEVELS Represent mean [CrVI] across exposure area that would pose risk to resident child living adjacent.](http://images.slideplayer.com/15/4730584/slides/slide_8.jpg " Farm field = 86 ppm. Based on 80-acre field..")
9
SAMPLING STRATEGY 56,000 acres affected. Can’t sample it all: Select 15-20 farm field DUs for sampling. DUs = Exposure Area = 80 acres SU = 1 acre squares w/in DU Fields chosen based on CSM (judgemental) – appl. Rate, frequency, time, geography, field type (row crop vs. pasture). SUs also chosen based on CSM – attempt to select SUs with maximum within-SU and between SU heterogeneity (most conservative).
 – appl. Rate, frequency, time, geography, field type (row crop vs. pasture). SUs also chosen based on CSM – attempt to select SUs with maximum within-SU and between SU heterogeneity (most conservative)..")
10
FARM FIELD DU WITH OVERLAY GRID OF SUs

11
DECISION RULE If 95% UCL on [CrVI] (measured using SUIS) in any farm field DU exceeds the screening level, investigation will be expanded; otherwise conclude that sludge applications do not pose risk - NFA.
![DECISION RULE If 95% UCL on [CrVI] (measured using SUIS) in any farm field DU exceeds the screening level, investigation will be expanded; otherwise conclude that sludge applications do not pose risk - NFA.](http://images.slideplayer.com/15/4730584/slides/slide_11.jpg "DECISION RULE If 95% UCL on [CrVI] (measured using SUIS) in any farm field DU exceeds the screening level, investigation will be expanded; otherwise conclude that sludge applications do not pose risk - NFA.")
12
PILOT STUDY 30 Discrete collected in three FF plots XRF for total Cr few $/sample. CrVI analysis $160/sample. Analyzed for total and hex Cr Variograms showed total and hex Cr vary across fields in similar way & var of Cr >CrVI. Used worst case observed ratio of CrVI:Cr (~20%) to convert CrVI SL to Cr SL.
 to convert CrVI SL to Cr SL..")
13
Farm Field Design = Farm Field DU area = 1-acre SU area = SU increment sample location SU 80 SU 4 SU 72 SU 45 SU 28 Start with 3 SUs and 10 discretes (increments) Analyze each increment 4x by XRF -Provides measure of within bag heterogeneity -Use mean, SD, AL in VSP to determine # incr. needed in SU -If >10 increments needed, collect them. REPEAT FOR OTHER 2 SUs

14
VISUAL SAMPLE PLAN ANALYSIS Our decision error tolerance From SU XRF data CrVI AL converted to total Cr AL (using pilot data) Number of samples needed within the SU From discrete sample XRF data
 Number of samples needed within the SU From discrete sample XRF data")
15
XRF ANALYSIS

16
Farm Field Design = Farm Field DU area = 1-acre SU area = SU increment sample location SU 80 SU 4 SU 72 SU 45 SU 28 DUIS Increments combined in oe bag Increments combined in one bag Increments combined in one bag -Split SUIS and combine aliquots to form DUIS (2 nd Tier). XRF that. -Send SU & DU IS samples for CrVI analysis Combine SU increments together to form SUIS & XRF 4x -Use mean, SD, AL of the 3 SUIS in VSP to determine number of SUs needed for the DU. -If >3 SUs needed, collect them

17
INCREMENTS/SU & SUs/DU None of the 60 SUs required more than 10 increments based on VSP analysis (none even >4). None of the 19 DUs required more than 3 SUs to be sampled. SDs were low, but key factor was the distance between our estimates of mean [CrVI] & the screening level.

20
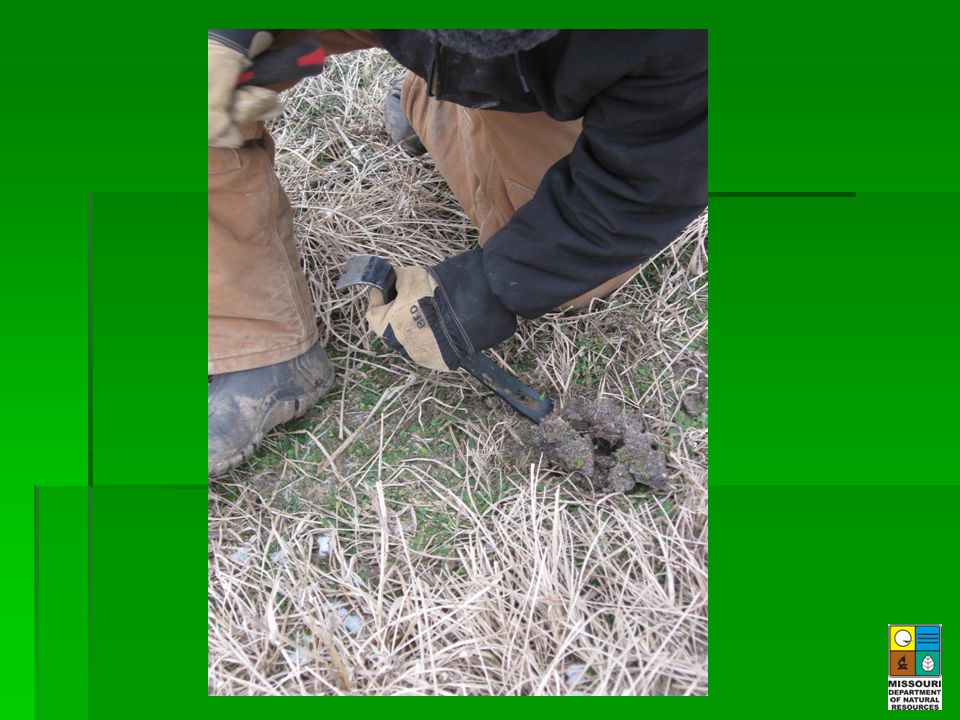
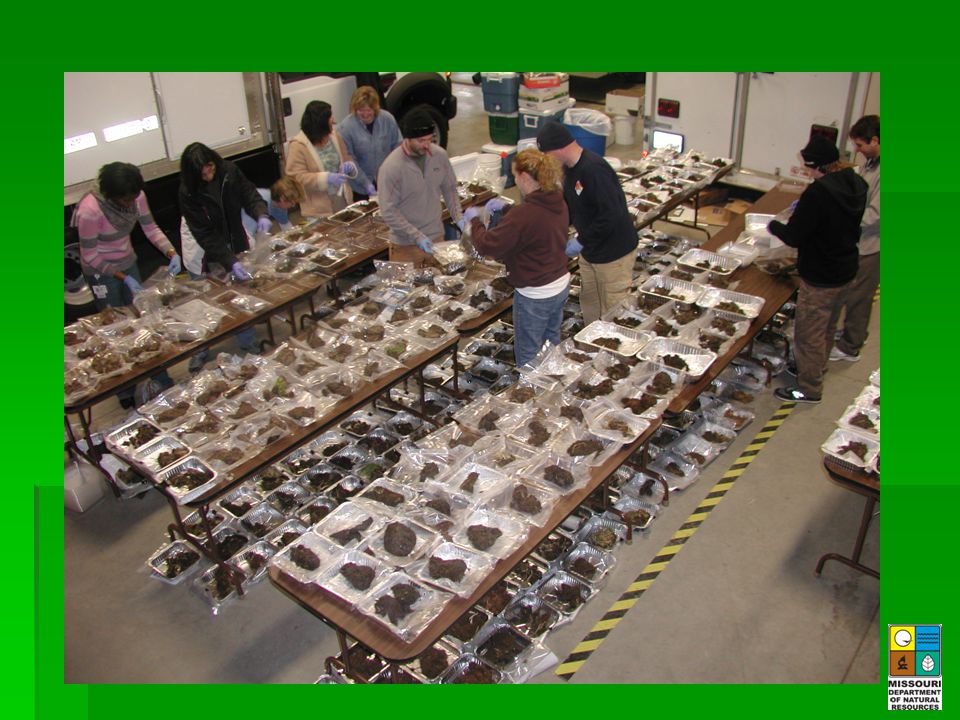
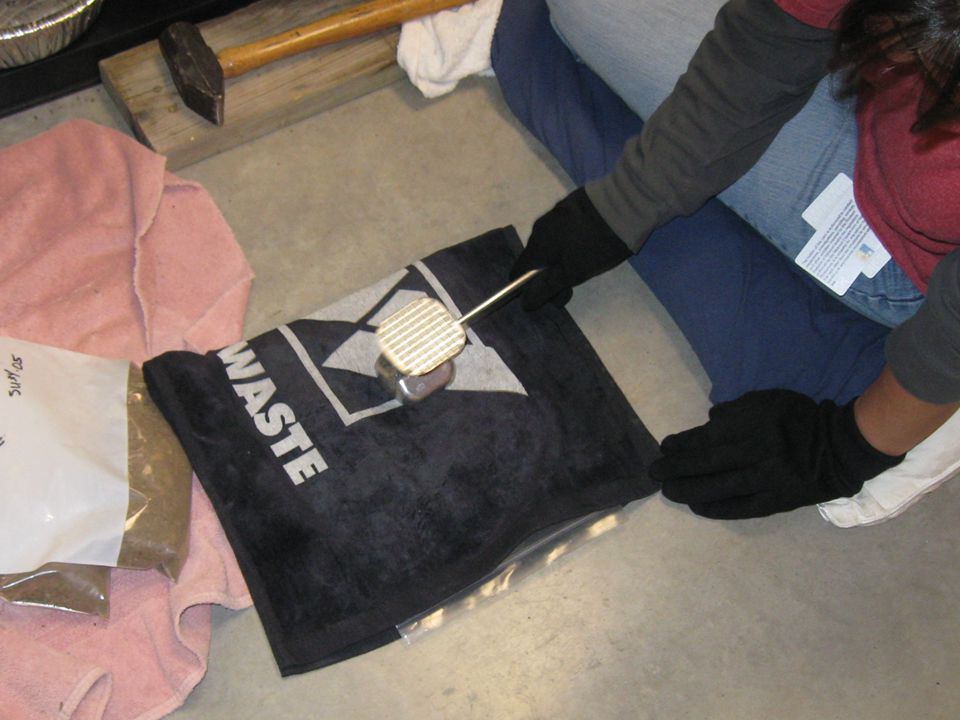
Sample Processing Air dry discretes, disaggregate, sieve 60 mesh Create SUIS from discretes Split SUIS into 3; one to form DUIS, one to lab, one for archive. Split technique was simple mix & pour from bag. All SUIS and half the DUIS submitted for CrVI analysis Lab used 2D Japanese slabcake for subsampling

25
SU IS Replicates SURepl1Repl2Repl3RSD 205-881.020.6520.77922.9 214-371.130.7150.67430.0 221-162 4.073.454.5713.9 *SUIS made up of 10 increments collected in systematic (serpentine) pattern Hexavalent Cr, mg/kg SURepl1Repl2Repl3RSD 205-8810514915920.9 214-372642892675.0 221-162971151058.5 Total Cr, mg/kg
 pattern Hexavalent Cr, mg/kg SURepl1Repl2Repl3RSD Total Cr, mg/kg")
26
Analytical Subsampling DU-SUCrVI Cr VI Lab dupRPD 2010.060.0634.9 209-961.050.94210.8 205-881.1100.93816.8 212-530.6050.75021.4 213-440.8330.7885.6 214-251.6101.6200.6 215-550.0690.08014.8 217-1030.7930.7752.3 221-1624.383.7615.2 2D Japanese Slabcake Method Used

27
Comparison of IS Tiers IDAve of SUISDU-IS Result%RPD DU 2021351313 DU 20368671 DU 2041331265 DU 2051461413 DU 20952487 DU 21061 0 DU 21222725110 DU 2132442544 DU 21428522523 DU 2152632827 DU 2161091167 DU 2172682642 DU 2181972043 DU 21960635 DU 221104968 DU 2221181089 DU 22378803 DU 224443911 DU 225103976 IDAve of SUIS DU-IS Result%RPD DU 2120.750.4942 DU 2131.040.70338 DU 2140.770.3575 DU 2150.621.7395 DU 2171.051.1610 DU 2212.591.6445 DU 2251.381.487 Total Cr, mg/kg (XRF) Hexavalent Cr, mg/kg Micro scale heterogeneity of total Cr in matrix controlled well by sample splitting technique. Less well for CrVI.

28
Analysis of Relative Uncertainties Data Variability Measured by Width of 1 Side of Uncertainty Interval Normalized to the Mean (i.e., interval width/mean) General trends: -Higher variability in CrVI vs. total Cr -Variability incr. with scale from within sample to within SU to between SU. But, -For some DUs, micro-scale variability within sample dominates. *only portion of DU data shown

29
DATA VALIDATES CSM? Selection of DUs based on application data captured worst case fields. – Yes, pos. correlation of application rates/frequency to Cr levels. Our selection of SUs maximized within and between SU variability – Yes, SUs chosen as high variability in field had highest SD, SUs chosen as low variability had lower SD. Soil redox conditions control ratio of Cr6:Cr in fields. – Yes, fOC highly (negatively) correlated with CrVI
 correlated with CrVI.")
30
DECISION Accounting for all sources of variability, and making most conservative assumptions, no 95% UCL was within an order of magnitude of the screening level. No further investigation planned

Similar presentations


 and XRF: Tools for Improved Soil Data Deana Crumbling USEPA Office of Superfund Remediation and Technology Innovation.>")


 Diagrams using the Simulation Editor EXAMPLE Constructing Conceptual Site Model (CSM) Diagrams using the Simulation.>")

 D. Keith Reid Presentation to Soil Test P Stratification Working Group 24 July, 2013.>")


