Download presentation
Presentation is loading. Please wait.

1
GCSE Population By the end of the lesson I will understand about the changes in population

2
What do these images say about death rates?

3
What do these images say about death rates in LEDC’s?

4
What does this picture tell you about how death rates have changed over time ?

5
The Demographic Transition Model

6
Task: Match the statements with the correct stages of the DTM

7
Demographic Transition Model Natural Increase

8
Assess your work! Match the statements to your work.

9
Level 1 All of the statements have been placed in the correct places, evidence from the graph has been used correctly and every reason used to explain has been linked to other aspects of the graph, each is backed up with information added from the work covered on this topic.

10
Level 2 All of the statements have been placed in the correct places, evidence from the graph has been used correctly and every reason used to explain has been linked to other aspects of the graph.

11
Level 3 All of the statements have been placed in the correct places, evidence from the graph has been used correctly and every statement has more than one reason used to explain.

12
GCSE Population By the end of the lesson I will understand about the structure of populations

13
Why are death rates falling in some LEDC’s?

16
Population Pyramids Dependants Low birth rateHigh birth rate High death rateLow death rate

19
Dependants : the number of ‘children’ (under 15) and ‘elderly people’ (over 60) Economically active : the adults (16- 59) who work, pay taxes and support the dependents.
 and ‘elderly people’ (over 60) Economically active : the adults (16- 59) who work, pay taxes and support the dependents.")
22
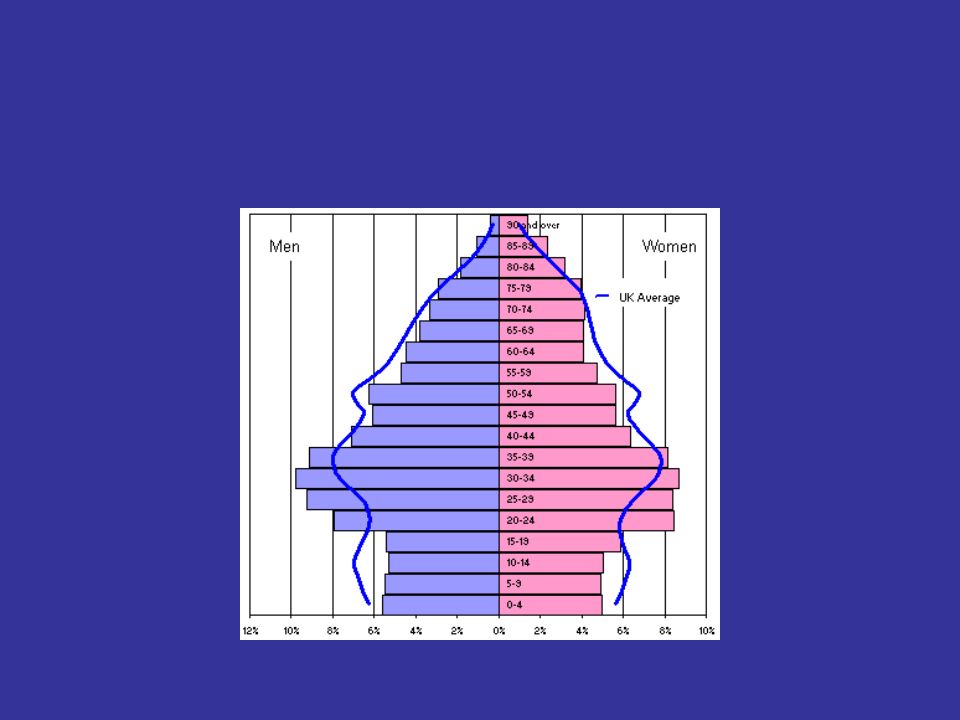
United Kingdom

23
United Kingdom 2050

24
Herefordshire

25
Gloucester

26
Cheltenham

27
Forest of Dean

28
Eastbourne

29
Milton Keynes

30
Brighton and Hove

35
Population Structure We are learning about the effects of elderly and young populations

36
Why is this population pyramid shaped oddly?

37
High number of male workers High number of males. Ratio of 364:100!

38
Eastbourne

39
What are the problems with a high proportion of elderley residents?

40
Milton Keynes

41
What are the problems with a high proportion of young families residents?

43
High number of male workers High number of males. Ratio of 364:100!

44
Population We are learning about the link between population and resources.

45
Describe the glass

46
The glass is half empty- Pessimism The glass is half full - Optimism

47
Pessimist - Thomas Malthus, 1778 We are all going to die! Unless we do something about it. The world is heading towards disaster population will outgrow food/ resources. This will lead to ‘war, famine and disease unless ‘men curbed their sinful lusts’.

48
‘Necessity is the mother of invention’ Increase in population leads to increase in technology. As demand for food increases farming becomes more intensive to meet demand. Optimists - Esther Boserup, 1965

49
Define the following: Underpopulation: Overpopulation: Optimum Population:

50
China’s one child policy We are learning about China’s anti-natalist policy to control population.

51
How is China’s population changing?

52
Little Emperors

53
The People’s Republic of China was formed in 1949. At the time, its population was 550 million. People were encouraged to have children as they believed this gave them power, and the population more than doubled to 1.13 billion by 1990. The problem then was how to feed all these people ! CONTEXT

54
China has a quarter of the world’s population, but only: 7% of the earth’s land surface 8% of the bio-climatic resources 5% of fossil fuels A large part of China is unusable due to mountains, deserts and forests. There was a POPULATION- RESOURCE imbalance.

55
The PRO-NATALIST approach continued until the 1970’s. It was calculated that the OPTIMUM population for China was 700 million. The demographer Liu Zeng suggested this would take 100 years to be achieved. Even with only 2 children per couple, this would still involve many millions of extra births, because of the huge POPULATION BASE, which would lead to 1.4 billion by 2080. There will be problems feeding this number of people. This was a good example of the importance of education. Poorly educated women tended to have an average of 6 children in the 1970’s, educated women had an average of 2.1

56
An effort to slow down the rate of births was started in the 1970’s. The Government used the slogan: WAN XI SHAO: meaning ‘Later, Longer, Fewer’ This meant: later marriages, longer gaps between children and fewer children. People were encouraged to limit themselves to 2 children. By the end of the 70’s, use of contraception had increased and the fertility rate had halved. People had to wait until they were 25 (for men) or 23 (for women) before they could marry, for which they had to apply for permission. Because the country had a Communist leadership this meant that the rights of individuals were sometimes overlooked.
 or 23 (for women) before they could marry, for which they had to apply for permission. Because the country had a Communist leadership this meant that the rights of individuals were sometimes overlooked..")
57
Why do the people obey this law? http://news.bbc.co.uk/media/video/otdvideo/89/06/04/bb/7 653_04-06-89_4x3_bb.ram

58
How has China’s population changing?

59
China’s Communist leaders wanted to stop growth altogether, so that the population was reduced to a sustainable size. In the 70’s there was Overpopulation. The ‘One Child’ Policy was introduced on 1 st January 1979. The policy had a series of ‘carrot’ and ‘stick’ sections: Age limits and certificates reducing marriages Free birth control / family planning advice Cash bonuses, improved housing and free education / medical care if couples limited themselves to 1 child Anyone having more than 1 child would lose all these benefits and also face financial penalties

60
At first the policy looked to be succeeding, but opposition grew, especially in rural areas. It was important to ensure that families had sons: these are more respected in the countryside, and continue the family name. Daughters go to live with their husband’s family, so only sons can look after their parents. Sons can also work better in the fields, and are stronger. (Please note this is not my personal opinion….) The birth of a son is an occasion for celebration, with cakes and fireworks. Baby girls are colloquially called ‘maggots in the rice”.
 The birth of a son is an occasion for celebration, with cakes and fireworks. Baby girls are colloquially called ‘maggots in the rice ..")
61
"It is forbidden to discriminate against, mistreat or abandon baby girls."

62
In the early years, the policy was severely applied. Financial penalties were applied Women pregnant for 2 nd or subsequent time were often coerced into having abortions ‘Granny police’ were recruited in settlements to spy on people in their communities who might be trying to keep a pregnancy secret Contraception and family planning devices were pushed on people The policy had to be modified in rural areas, although traditional preference for sons

63
Was the one child policy successful?

64
By the end of the lesson you will; Explain why the one child policy was introduced. Explain how the one child policy worked. Describe the effects of the policy. Describe how successful it was.

65
Why have the following occurred? Mrs. Chang has an abortion because she already has her 6th child. Mrs. Ho has her sixth child. She is very pleased to serve her country by only having so many healthy children. China’s leading baby store lays off workers because revenue is down. Mr. Fung complains that all of his friends have found girlfriends but there are no girls left for him.

66
Using one or more examples, explain what countries are doing to cope with rapid population increase. (6 marks)
.")
67
The examples can be of places or policies. This can be answered either from the idea of reducing the birth rate or strategies aimed at coping with the high rate of natural increase. Level 1 Basic (1-2 marks) Introduce birth control, build more houses, grow more food. Level 2 Clear (3-4 marks) Introduce a birth control programme like China where families are only allowed to have one child. Built new houses for the increasing population such as the 7th of Ramadan city in Egypt. Build irrigation schemes such as the Aswan Dam, which allows more than one crop to be grown each year.
 Introduce birth control, build more houses, grow more food. Level 2 Clear (3-4 marks) Introduce a birth control programme like China where families are only allowed to have one child. Built new houses for the increasing population such as the 7th of Ramadan city in Egypt. Build irrigation schemes such as the Aswan Dam, which allows more than one crop to be grown each year..")
68
Using one or more examples, explain what countries are doing to cope with rapid population increase. (6 marks) Level 3 Detailed (5-6 marks) The one child policy was introduced into China to try and reduce the population increase. Inducements to only have one child included free education priority housing, pension and family benefits. A second child would mean these benefits were lost and there was a fine of 15% of the family’s income. The legal age for marriage was increased. The Aswan dam in Egypt meant that water was available all year around and so several harvests of rice could be grown each year so allowing a larger population to be fed.
 Level 3 Detailed (5-6 marks) The one child policy was introduced into China to try and reduce the population increase. Inducements to only have one child included free education priority housing, pension and family benefits. A second child would mean these benefits were lost and there was a fine of 15% of the family’s income. The legal age for marriage was increased. The Aswan dam in Egypt meant that water was available all year around and so several harvests of rice could be grown each year so allowing a larger population to be fed..")
69
What is migration? We are learning about what is migration and types of migration

70
What is migration? Migration is the movement of people from one place to another. There are many different types of migration.

71
Types of migration Internal migration is when people migrate within the same country or region - for example, moving from Liverpool to Gloucestershire. International migration is when people migrate from one country to another - for example, moving from Mexico to the USA.

72
Mexican Migrants at a control point on the US border

73
There are two key migration terms that you need to learn: Emigration is when someone leaves a country. Immigration is when someone enters a country.

74
Push factors are the reasons why people leave an area, ie what pushes them away from their home. Push factors include: lack of services, lack of safety, high crime, crop failure, drought, flooding, poverty and war. Pull factors are the reasons why people move to a Particular area, ie what pulls them to a new place. Pull factors include: higher employment, more wealth, better services, good climate, safer, less crime, political stability, more fertile land, lower risk from natural hazards.

75
Push factors are the reasons why people leave an area, ie what pushes them away from their home. Push factors include: lack of services, lack of safety, high crime, crop failure, drought, flooding, poverty and war. Pull factors are the reasons why people move to a Particular area, ie what pulls them to a new place. Pull factors include: higher employment, more wealth, better services, good climate, safer, less crime, political stability, more fertile land, lower risk from natural hazards.

76
People move from one country to another. Using examples, describe the advantages to the to counties involved (6 marks)
.")
77
People move from one country to another. Using examples, describe the advantages to the to counties involved Level 1 Basic (1-2 marks) Simple statements with only reference to one country. Provide labour, take low waged jobs, and introduce greater variety of food. Reduce un(under)employment. Max Level 1 on advantages to the migrants themselves.
 Simple statements with only reference to one country. Provide labour, take low waged jobs, and introduce greater variety of food. Reduce un(under)employment. Max Level 1 on advantages to the migrants themselves..")
78
People move from one country to another. Using examples, describe the advantages to the to counties involved Level 2 Clear (3-4 marks) For the top of Level 2 needs clear reference to the advantages of both countries. There is high unemployment in LEDCs and in MEDCs there is a shortage of people willing to take unskilled jobs with low wages. Migrants bring new types of cooking to the MEDCs and therefore there is a wider variety of food available. The people working in takeaways are able to send money back to their homeland. N.B. The answer need not be restricted to movement from LEDCs to MEDCs. Credit can be given to LEDC to LEDC, MEDC to LEDC or MEDC to MEDC movement.
 For the top of Level 2 needs clear reference to the advantages of both countries. There is high unemployment in LEDCs and in MEDCs there is a shortage of people willing to take unskilled jobs with low wages. Migrants bring new types of cooking to the MEDCs and therefore there is a wider variety of food available. The people working in takeaways are able to send money back to their homeland. N.B. The answer need not be restricted to movement from LEDCs to MEDCs. Credit can be given to LEDC to LEDC, MEDC to LEDC or MEDC to MEDC movement..")
79
People move from one country to another. Using examples, describe the advantages to the to counties involved Level 3 Detailed (5-6 marks) There has to be specific case study exemplification of the advantages to both countries. In Mexico there is a high rate of unemployment because there is not enough work for everybody in the rural areas where the main occupation is farming. Mexicans therefore migrate to the USA where they can earn money to send back to Mexico. The American farmers get plenty of people willing to pick fruit in California and will work for lower wages than the local Americans, so the industry is more profitable.
 There has to be specific case study exemplification of the advantages to both countries. In Mexico there is a high rate of unemployment because there is not enough work for everybody in the rural areas where the main occupation is farming. Mexicans therefore migrate to the USA where they can earn money to send back to Mexico. The American farmers get plenty of people willing to pick fruit in California and will work for lower wages than the local Americans, so the industry is more profitable..")
Similar presentations