Download presentation
Presentation is loading. Please wait.

1
Oregon Department of Fish and Wildlife Introducing the Oregon Conservation trategy Oregon Wildlife Movement Data Oregon Chapter Wildlife Society Meeting February 19, 2009

2
Land use changes Invasive species Changes in fire, flood regimes Water quality and quantity Institutional barriers to voluntary conservation Barriers to fish and wildlife movement Six Key Conservation Issues

3
Oregon Wildlife Movement Strategy Provide a framework for cooperation Promote wildlife movement and habitat permeability Reduce the social, economic and environmental impacts of transportation and wildlife conflicts

4
Oregon Wildlife Movement Strategy ODFW data collection

5
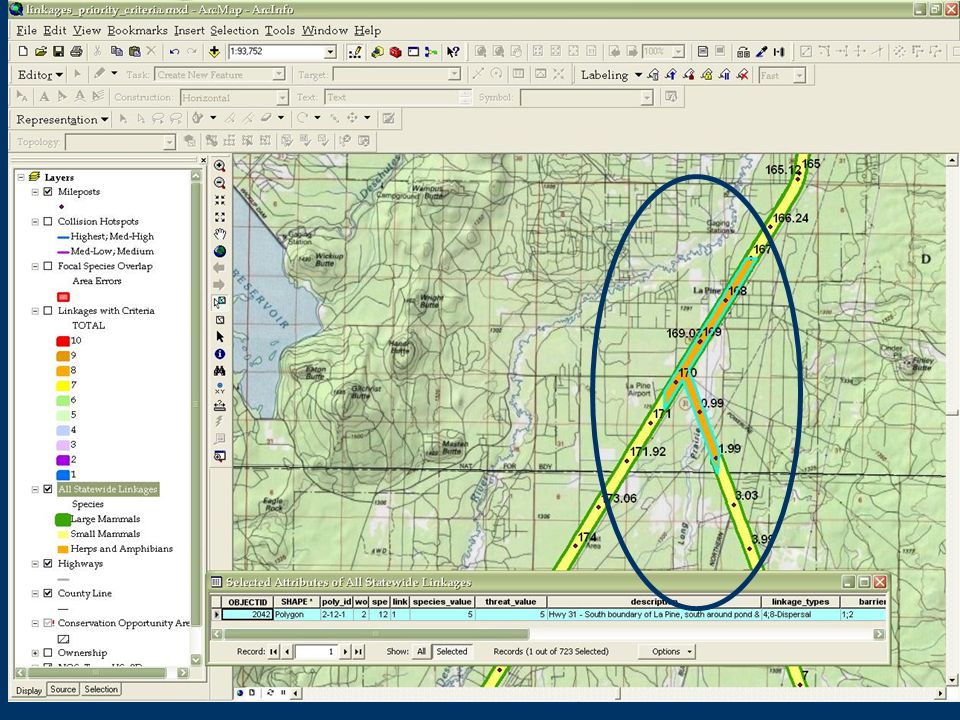
Oregon Wildlife Movement Strategy Wildlife Linkages “Best place to provide for animal movement needs, with an emphasis on areas that cross roads” ODFW convened four workshops in 2007 –Review session at The Wildlife Society –Bend, Roseburg, La Grande & Alsea Linkage areas

6
Oregon Wildlife Movement Strategy ODFW linkage workshops Breakout sessions worked with existing maps and with GISBreakout sessions worked with existing maps and with GIS Product: Identified linkage areas that cross transportation corridors throughout the stateProduct: Identified linkage areas that cross transportation corridors throughout the state

7
Integrate and set priorities Workshop-ranked: –High value for focal species –High Threat value Land Ownership In a Conservation Opportunity Area In an ODOT Roadkill hotspot

8
Result: linkages dataset with current priorities for Oregon

11
Oregon Wildlife Movement Strategy ODOT data collection

12
Oregon's Animal-Vehicle Collisions CRASH RECORDS: Avg. 400 wildlife collisions/yr, 14 yrs About 5,500 records statewide Less than 3% of all crash reports in Oregon DISPATCH CARCASS REPORTS: Avg. 2,600 wildlife collisions/yr, 12 yrs About 32,000 records statewide 6 times more data in similar period

13
ODOT Wildlife Collision Hot Spot Analysis Conducted by Mason, Bruce and Girard, Inc. Existing carcass pick-up records Statewide, analytical approach Mapped high frequency wildlife-vehicle collision zones Pilot Study results presented in 2008 US Hwy

14
Carcass Records Wildlife incident dispatch reports, call = RDKILL Animal Type, Deer & Elk 12 yeas of data (1995-2006), statewide Location, +/- 0.5 mile Link Location to GIS Coordinates CAD_NUMCALLDATELOCATIONUNITS 95309256RDKILL101919955925 WALLACE RDHWY21 95309392RDKILL10201995HELMICK ROAD / 99 SR ;12600 HELMICK RD21AP 95309598RDKILL1020199521.5 228 SR3A20P 95312278RDKILL102319955.9 22 SR3A261 95312329RDKILL10231995SHERWOOD @ 99W SR MP 15.2-15.8/ ; 19025 SW PAC HWY3A52P 95312331RDKILL10231995HWY 212 / FORMORE CT4A30P
, statewide Location, +/- 0.5 mile Link Location to GIS Coordinates CAD_NUMCALLDATELOCATIONUNITS RDKILL WALLACE RDHWY RDKILL HELMICK ROAD / 99 SR ;12600 HELMICK RD21AP RDKILL SR3A20P RDKILL SR3A261 99W SR MP / ; SW PAC HWY3A52P RDKILL HWY 212 / FORMORE CT4A30P")
15
Data Preparation Original # Records 31,595 (100%) Step 1 - Data Processing Narrowing Acceptable Parameters25,216 (80%) –Cut out records older than 1995, duplicate records, non deer/elk, low precision (> 0.5 mi) Tabular Information Problems 21,335 (68%) –Not enough information in recorded data Step 2 - Linkage to GIS GIS Mapping Problems17,824 (56%)* Route ≠ ODOT Highway number * Final number of "good" records used in data analysis
 Step 1 - Data Processing Narrowing Acceptable Parameters25,216 (80%) –Cut out records older than 1995, duplicate records, non deer/elk, low precision (> 0.5 mi) Tabular Information Problems 21,335 (68%) –Not enough information in recorded data Step 2 - Linkage to GIS GIS Mapping Problems17,824 (56%)* Route ≠ ODOT Highway number * Final number of good records used in data analysis")
16
Data Analysis Nearest Neighbor Analysis Z-statistic to determine statistical significance of dispersion. Monte Carlo simulations (100 random data sets). Modified for linear nature of data (highway system)Z-statistic to determine statistical significance of dispersion. Monte Carlo simulations (100 random data sets). Modified for linear nature of data (highway system) Results: NNI = 0.xx (< 1.0 indicates clustering) Neither test identifies where the clusters occur Ripley’s K-Statistic K-statistic (Levine, 2000), modified for linear dataK-statistic (Levine, 2000), modified for linear data Gives indication of the scales at which the clusters occurGives indication of the scales at which the clusters occur Results: Highly significant at all scalesResults: Highly significant at all scales
. Modified for linear nature of data (highway system)Z-statistic to determine statistical significance of dispersion. Monte Carlo simulations (100 random data sets). Modified for linear nature of data (highway system) Results: NNI = 0.xx (< 1.0 indicates clustering) Neither test identifies where the clusters occur Ripley’s K-Statistic K-statistic (Levine, 2000), modified for linear dataK-statistic (Levine, 2000), modified for linear data Gives indication of the scales at which the clusters occurGives indication of the scales at which the clusters occur Results: Highly significant at all scalesResults: Highly significant at all scales.")
17
Kernel Density Evaluation Produces an estimate of risk for each point –Relative density of points –Relative proximity of points Shows where clusters occur Subjective classification –Method of categorizing –Ranking or # “bins”

18
Wildlife Collision Hot Spots Results * * exaggerated for visual aid

19
Crossing Improvements Hot Spot & Linkage data, precursor to more focused studies –Condition assessment, road kill surveys, wildlife monitoring, etc. Typically not regulated Competitive funding: –FHWA Enhancement program (Category 11) –Oregon Transportation Plan (Goal 4.1.1) –Safety Funding: SAFETEA-LU Section 148 Must take into account long-term maintenance, monitoring Partnerships very important
 –Oregon Transportation Plan (Goal 4.1.1) –Safety Funding: SAFETEA-LU Section 148 Must take into account long-term maintenance, monitoring Partnerships very important.")
20
Next Steps

21
For More Information on the Oregon Wildlife Movement Strategy Audrey Hatch, 541 – 757 – 4263 x 242; Audrey.C.Hatch@state.or.us Audrey.C.Hatch@state.or.us Mindy Trask, (503) 986-3504 Melinda.Trask@odot.state.or.us www.dfw.state.or.us/conservationstrategy /...www.dfw.state.or.us/conservationstrategy Add link to datasets
 /... Add link to datasets")
22
Thanks to our photographers Stephen Anderson Jason Blazar Bruce Campbell Claire Fiegener Lori Hennings Bob Hooten Brome McCreary Michael Murphy Bruce Newhouse Bruce Taylor Jennifer Thompson USFWS

Similar presentations