Download presentation
Presentation is loading. Please wait.

1
Kaseya Essentials Bootcamp Developed by Kaseya University Powered by IT Scholars Kaseya Version 6.2 Last updated on Jan. 9, 2012 DAY TWO MORNING

2
Roadmap! 1.Monday, Day One Morning – Overview – System Architecture – Agents 2.Monday, Day One Afternoon – LAB Review – Agent Template and Policy Management Concepts – Audit – Patch Management 3.Tuesday, Day Two Morning – LAB Review – Monitor – Ticketing 4.Tuesday, Day Two Afternoon – LAB Review – Agent Procedures – Remote Control – Live Connect 5.Friday, Day Three Morning – LAB Review – Agent Template vs. Policy Management – System – Info Center 1.Monday, Day One Morning – Overview – System Architecture – Agents 2.Monday, Day One Afternoon – LAB Review – Agent Template and Policy Management Concepts – Audit – Patch Management 3.Tuesday, Day Two Morning – LAB Review – Monitor – Ticketing

3
LAB REVIEW

4
Audit Lab

5
Agent Templates Screenshot taken after Part 1

6
Please Skip Part 2 to 4 Baseline Audit and System Info should be executed only once. Baseline Audit, System Info, and Latest Audit are done by default when an AGENT is installed on a machine. You can safely skip Part 2, 3, and 4 of the Audit Lab.

7
Inventory Report Screenshot taken after Part 5

8
Patch Management Lab

9
Patch Scan Screenshot taken after Part 1

10
Patch Policies and Membership Screenshot taken after Part 2

11
Windows 2003 Patch Policy Screenshot taken after Part 2

12
Windows XP Patch Policy Screenshot taken after Part 2

13
Patch File Source Screenshot taken after Part 3

14
Set Credentials Screenshot taken after Part 3

15
Patch File Source Screenshot taken after Part 3

16
Patch Reboot Action Screenshot taken after Part 4

17
Patch Automatic Update Screenshot taken after Part 5

18
Patch Copy Settings Screenshot taken after Part 6

19
Patch Scan Screenshot taken after Part 6

20
Patch Status Screenshot taken after Part 6

21
Verify the File Source Settings Screenshot taken after Part 6

22
Patch Windows Auto Update Screenshot taken after Part 7

23
Patch KB Override Screenshot taken after Part 7

24
Patch Report Screenshot taken after Part 8

25
MONITOR

26
Motivation Knowing that disk space utilization on a computer has reached a predefined threshold can trigger a few simple automated steps to prevent disastrous situations. Proactive and preventive system maintenance is only possible with accurate and easily accessible information regarding the key aspects of the states of all the computers and peripherals within the network.

27
Background How? – The required information must be collected – Categorized as to the severity of the issues – Be presented to the user Warning! – Too much info. is equivalent to no information. – Be very selective on what data to collect. What is available? – Commodity operating systems support facilities to collect the needed data on an ongoing basis.

28
What is an Alarm? An alarm is a warning of an existing or approaching danger We refer such situation by indicating that an alarm condition exists. For example, an alarm condition exists when a machine's performance succeeds or fails to meet pre-defined criteria. To check whether an alarm condition exist we need to monitor the environment.

29
How to Monitor? 1.Event-based – Alerts: Monitors events on agent-installed machines. – System Check: Monitors events on non-agent- installed machines. – Log Monitoring: Monitors events in log files. 2.State-based – Monitor Sets: Monitors the performance state on agent-installed machines. – SNMP Sets: Monitors the performance state on non-agent-installed devices.

30
How to monitor state? Using Monitor Sets or SNMP Sets, i.e., sets of counter objects, counters, counter instances, services and processes used to monitor the performance of machines. Basically we collect sample values of some counters associated with some performance object instances at a predefined interval. For example, to monitor the percentage of processor time, we collect sample values of the “% Processor Time” counter.

31
Performance Object A logical collection of counters that is associated with a resource or service that can be monitored. For example, processors, memory, and physical disks each have their own sets of predefined counters.

32
Performance Object Instance A term used to distinguish between multiple performance objects of the same type on a computer. For example, multiple processors or multiple physical disks. The VSA lets you skip this field if there is only one instance of an object.

33
Performance Counter A data item that is associated with a performance object, or if more than one instance of the object exists, the data associated with each instance of the object. Each selected counter presents a value corresponding to a particular aspect of the performance that is defined for the performance object and instance.

34
Windows Performance Monitor

35
Monitor Set Update Lists by Scan – Counters, Services, and Event Log Types Monitor Perfmon Object Counters Monitor Windows Services Monitor Windows Processes

36
LAB Assumptions – You have not put in place a way to monitor hardware and software performance on all computers simultaneously. – This prevents your IT technician from having an accurate way of knowing if all computers are at optimal performance. Tasks – Use the Kaseya Monitor module facilitates to develop a proactive maintenance solution.

37
LAB Tasks – Create a monitor set for servers Monitor the DNS service Total CPU usage Available main memory Page file usage Free storage memory on C & D drives with trending – Create a monitor set for desktops Monitor TermService service Percentage of available storage memory space Available main memory – Assign the monitor sets

38
Monitor Set for Servers 1.Open the Monitor module. Go to Edit > Monitor Sets. 2.Select the folder “myMonitorSets - ”. 3.Click on the New MonitorSet button.

39
Monitor Set for Servers 4.Type in “Server Set - ” in Monitor Set Name. 5.Select System Check in the Group Alarm Column. 6.Click on Save.

40
Monitor Set for Servers 7.Click on the Services Check button. 8.Click on Add.

41
Monitor Set for Servers 9.Select DNS in the Services dropdown box. 10.Type in 5 in the Re-start attempts textbox and leave the other options with their default values. 11.Click on Save.

42
Monitor Set for Servers 12.Click on the Counter Thresholds button. 13.Click on Add.

43
Monitor Set for Servers 14.Select Processor Performance in the Object dropdown box. 15.Select % of Maximum Frequency in the Counter dropdown box. 16.Select Next.

44
Monitor Set for Servers 17.Select Over in the Collection Operator dropdown box, enter 10 in the Collection Threshold field, set Sample Intervals to 1 Minute, select Over in the Alarm Operator dropdown box, enter 50 in the Alarm Threshold filed, set the Duration to 5 Minutes, and select Next.

45
Monitor Set for Servers 18.Select Save.

46
Note When setting the collection threshold, you need to make sure that the collected data range includes the alarm threshold. For example, in this exercise, as the collection operator is selected as Over, the Collection Threshold must be smaller than 50, which is set for the Alarm Threshold.

47
Note When setting the sample interval, you need to make sure that there is enough number of samples within the duration that you will be used to collect the data from the agent. For example, in this exercise, we set the Sample Intervals to 1 Minute so that there are 5 samples within each Duration of 5 Minutes. WHAT IS THE OPTIMAL SAMPLING INTERVAL?

48
Monitor Set for Servers 19.Click on Add.

49
Monitor Set for Servers 20.Select Memory in the Object dropdown box. 21.Select Available MBytes in the Counter dropdown box. 22.Select Next. 20.Select Memory in the Object dropdown box. 21.Select Available MBytes in the Counter dropdown box. 22.Select Next.

50
Monitor Set for Servers 23.Set Sample Intervals to 1 Minute, set the Duration to 5 Minutes, leave everything else as its default value, and select Next.

51
Monitor Set for Servers 24.Select Save.

52
Monitor Set for Servers 25.Click on Add.

53
Monitor Set for Servers 26.Select Paging File in the Object dropdown box. 27.Select % Usage in the Counter dropdown box. 28.Select Next. 26.Select Paging File in the Object dropdown box. 27.Select % Usage in the Counter dropdown box. 28.Select Next.

54
Monitor Set for Servers 29.Set Sample Intervals to 1 Minute, set the Duration to 5 Minutes, leave everything else as its default value, and select Next..

55
Monitor Set for Servers 30.Select Save.

56
Monitor Set for Servers 31.Click on Add.

57
Monitor Set for Servers 32.Select LogicalDisk in the Object dropdown box. 33.Select % Free Space in the Counter dropdown box. 34.Select C: in the Instance dropdown box. 35.Select Next. 32.Select LogicalDisk in the Object dropdown box. 33.Select % Free Space in the Counter dropdown box. 34.Select C: in the Instance dropdown box. 35.Select Next.

58
Monitor Set for Servers 36.Set Sample Intervals to 30 Minutes, set the Duration to 6 Hours, leave everything else as its default value, and select Next.

59
Monitor Set for Servers 39.Repeat steps 31-38 for percentage of free storage memory on D drive. Note: Remember that object dropdown names are as follows: CPU = Processor Performance, main memory = Memory, page file = Paging File, storage memory = LogicalDisk. Note: You need to create separate Counter Thresholds for each of the logical hard drives.

60
Monitor Set Collection Threshold sets the value limit for the Kaseya Agent to collect and store the value into the Database. Alarm Threshold sets the value limit for the Kaseya Server to create an alert. The duration is referencing the duration held by PerfMon. It does not refer to the Collection Threshold sampling interval.

61
Trending Alarm If Trending Alarm is activated. The monitor set will predict that an alarm will occur in the future determine by Trending Window. In order for a Trending Alarm to be successful, you must have historical counters that have hit the alarm threshold values.

62
Monitor Set for Desktops HOMEWORK Create a Monitor Set that will be established in the desktop templates. – Monitor the TermService service If the TermService services fails, immediately restart it. NOTE: Microsoft Windows TermService services usually are not installed on Desktop workstation, unless RDP is enabled. If the Windows Service does not exist an alert will be triggered. – Monitor the total percentage of storage memory space. – Monitor the available main memory.

63
Monitor Set for Desktops 40.Open the Monitor module. Go to Edit > Monitor Sets. 41.Select the folder “myMonitorSets - ”. 42.Click on the New MonitorSet button.

64
Monitor Set for Desktops 43.Type in “Desktop Set - ” in the Monitor Set Name textbox. 44.Select System Check in the Group Alarm Column.

65
Monitor Set for Desktops 45.Click on the Services Check button. 25.Click on Add.

66
Monitor Set for Desktops 47.Select TermService in the Services dropdown box. 48.Type in 3 in the Re-start attempts textbox. 49.Click on Save.

67
Monitor Set for Desktops 50.Click on the Counter Thresholds button. 51.Click on Add.

68
Monitor Set for Desktops 52.Select LogicalDisk in the Object dropdown box. 53.Select % Free Space in the Counter dropdown box. 54.Select _Total in the Instance dropdown box. 55.Select Next. 52.Select LogicalDisk in the Object dropdown box. 53.Select % Free Space in the Counter dropdown box. 54.Select _Total in the Instance dropdown box. 55.Select Next.

69
Monitor Set for Desktops 56.Set Sample Intervals to 30 Minutes, set the Duration to 6 Hours, leave everything else as its default value, and select Next.

70
Monitor Set for Desktops 57.Select Save.

71
Monitor Set for Desktops 58.Click on Add.

72
Monitor Set for Desktops 59.Select Memory in the Object dropdown box. 60.Select Available MBytes in the Counter dropdown box. 61.Select Next. 59.Select Memory in the Object dropdown box. 60.Select Available MBytes in the Counter dropdown box. 61.Select Next.

73
Monitor Set for Desktops 62.Set Sample Intervals to 1 Minute, set the Duration to 5 Minutes, leave everything else as its default value, and select Next.

74
Monitor Set for Desktops 63.Select Save.

75
Monitor Set for Desktops Assign monitor sets to templates. 64.Go to Monitor module > Agent Monitoring > Assign Monitoring. 65.Select “Server Set - ” in the dropdown box. 66.Select the “Server” template. 67.Click on Apply. 68.Repeat steps 64-67 for the Instructional and Guest templates. Assign monitor sets to templates. 64.Go to Monitor module > Agent Monitoring > Assign Monitoring. 65.Select “Server Set - ” in the dropdown box. 66.Select the “Server” template. 67.Click on Apply. 68.Repeat steps 64-67 for the Instructional and Guest templates.

76
Monitor Set for Desktops Assign monitor sets to templates. 64.Go to Monitor module > Agent Monitoring > Assign Monitoring. 65.Select “Server Set - ” in the dropdown box. 66.Select the “Server” template. 67.Click on Apply. 68.Repeat steps 64-67 for the Instructional and Guest templates. Assign monitor sets to templates. 64.Go to Monitor module > Agent Monitoring > Assign Monitoring. 65.Select “Server Set - ” in the dropdown box. 66.Select the “Server” template. 67.Click on Apply. 68.Repeat steps 64-67 for the Instructional and Guest templates.

77
Assign Monitor Sets After defining monitor sets, you need to assign these monitor sets to machines. You can only assign monitor sets that you have edit rights to. Review the email alerts – Format Email button – Review the content help for variables used within the email

78
IT Service Delivery Kit Monitor Set Import IT Service Delivery Kit Monitor Set – Under System – Import Center, import the IT Service Delivery Kit Monitor Set.

79
Why Alerts? Setting alerts is one good approach to staying informed when a certain event of interest is triggered. You can set the alert to generate an alarm, which will in turn be added to the Alarm Logs in Kaseya VSA, or you can set it up so that it sends an email to you if your quick attention is needed.

80
Why Alerts? Generating an alarm can be used mainly for logging and documenting an alarm condition, while alerting via email can be used if the issue is more important. Alerts can also create tickets, which will be discussed later; this feature is useful in cases that addressing an alarm condition would need creation of a service request that can be tracked.

81
Agent Alerts Agent Status – Alerts when Agent is offline Application Changes – Alerts when an application is installed or removed Get Files – Alerts when an agent procedure executes a Get File command and receive a different copy than previous Get File command. Hardware Changes – Alerts when a hardware configuration changes Low Disk – Alerts when free disk space falls below a specified percentage LAN Watch – Alerts when an AGENT-LAN Watch function detects new machines

82
Agent Alerts Agent Procedure Failure – Alerts when an agent procedure failed to executes Protection Violation – Alerts when an access violations is detected New Agent Installed – Alerts when a new agent reports in for the first time Patch Alert – Alerts when a threshold is triggered for patch management events System – Alerts when selected system event occurred on the Kaseya Server

83
Creating Alerts For all server machines – Alert when an agent is not checked in for at least 5 minutes – Alert for all error events from both System and Application Log For all desktop machines – Alert when an agent has not checked in for at least 30 days – Alert for any hardware or software changes exclude VMware and Windows update changes.

84
Creating Alerts for Servers 76.Open the Monitor module. Go to Agent Monitoring > Alerts. 77.Select Agent Status in the Select Alert Function dropdown box. 78.Click on the “server.templates.fiu- ” template checkbox. 79.Make sure that the Create Alarm checkbox and Email Recipients checkboxes are selected. Type in your email address in the textbox below the Email Recipients. 80.Click on Agent has not check in for and set the time for 5 minutes. Rearm alert after 10 days. 81.Make sure that Create Ticket and Run Script. checkboxes are not selected. 82.Click on Apply.

85
Alert for Servers

86
Creating Alerts for Servers 84.Select Agent Monitoring > Event Log Alerts. 85.Select Application in the Select Event log type drop-down list. 86.Select the “server.templates.fiu- ” template checkbox.

87
Creating Alerts for Servers 88.Click on Set Alert Actions tab. 89.Check Create Alarm, Create ticket and Email recipients; enter your email address here if it isn’t already present. 90.Click on Apply. Repeat Steps 84 - 90 for System event log type instead of Application event log type.

88
IT Service Delivery Kit Event Set Import IT Service Delivery Kit Event Set – Under System – Import Center, import the IT Service Delivery Kit Event Set

89
Note To be able to monitor the Event Logs, it is necessary to set VSA to collect the required event logs. For this, you need to go to the Agent module and select the Machine Status > Event Log Settings page. Using this page, you can select the logs required for this exercise to be collected.

90
Note If you have not set the Event Log Settings correctly, you see "Note: Red letters indicate logging disabled." in the Monitor > Event Log Alerts page. Specifically, those event logs that are disabled and need your attention are shown in red under the EWISFCV column. For example, if you have set a monitoring alert on Error and Warning, and the corresponding event logs for Error are not enabled, you see EW-----.

91
Capturing Event Logs Under Agent > Event Log Settings – Select the Event Log Types and the Event Categories to capture.

92
Windows Event Log Source - The application that produced the event log Event ID Details - The description of the event Event Log Sets define the Agent Alert to create an alarm for specific events.

93
Creating Alerts for Desktops Create alerts on the Instructional and Guest templates. – Set an alert that creates an alert and notifies the admin via email when an agent is not checked in for at least 30 days. – Set an alert that creates an alert that is triggered when there are any software changes. For software alerts, exclude VMware and Windows changes.

94
Creating Alerts for Desktops 91.Open the Monitor module. Go to Agent Monitoring > Alerts. 92.Select Agent Status in the Select Alert Function dropdown box. 93.Click on the “instructional.templates.fiu- ” and “guest.templates.fiu- ” template checkboxes. 94.Make sure that Create Alarm and Email Recipients checkboxes are selected. 95.Make sure that Create Ticket and Run Script are not selected. Type in your email address in the textbox below. 96.Click on Agent has not check in for and set the time for 30 days. Rearm alert after 1 hour. 97.Click on Apply

95
Creating Alerts for Desktops

96
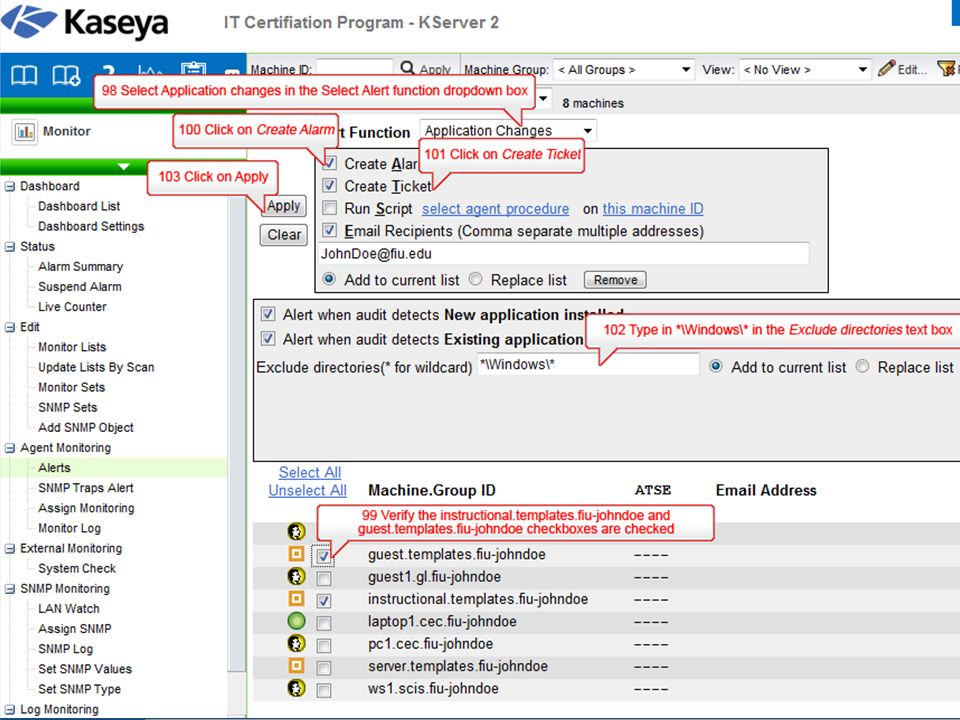
98.Select Application Changes in the Select Alert Function dropdown box. 99.Select the “instructional.templates.fiu- ” and “guest.templates.fiu- ” template checkboxes. 100.Make sure that the Create Alarm is checked. 101.Make sure that the Create Ticket is checked and the Email Recipients is not checked. 102.Type in “*\Windows\*” in the Exclude directories text box. 103.Click on Apply.

98
Creating Alerts for Desktops 104.Type in “*\VMware\*” in the Exclude directories text box. 105.Click on Apply. Repeat steps 98-103, exclude step 102, for the Hardware Changes.

99
Note Using (*) is considered a wildcard. To include using all subdirectories within the folder, use (\*) following the folder name.
 following the folder name..")
100
LAB Assumptions – All the three agent templates contain all the alert settings. Tasks – Push the settings captured in the templates to all the currently deployed agents with the similar roles.

101
Copy Settings to Assign Monitor Sets 112.Select all the computers in the MR building and click on the Copy button. 113.Repeat steps 108-112 for the Instructional and Guest templates.

102
Note Monitoring alerts can be assigned to the agents directly. We ask you to add them to the templates, however, this is not a requirement in a real world environment where you may have a limited number of machines with similar monitor sets.

103
Alarm Remediation Creating Alerts allows you to use the Alarm Summary and the Dashboards. The Alarm Summary page displays alarms for all machine IDs that match the current machine ID / group ID filter. You can include additional filtering for listed alarms using fields in the Alarm Filters panel. You can also close alarms or re-open them and add notes to alarms. Tickets can be created from an alarm with all the alarm notes and messages.

104
Alarm Remediation Using the Filters to find the issues

105
Dashboard List The Dashboard is a visual tool that filters out the alerts generated from your assigned monitoring – You can set up Group Alarm Columns to further define the types of issues. – The monitor set is assigned to the specific group alarm column so that when the condition is met the filter is applied.

106
Dashboard List

107
Monitor Dashboard Status view of OPEN Alerts in Alarm Summary

108
TICKETING

109
Background Story While deployed agents provide extremely useful information regarding the state of all managed machine, facilitating regular automated system maintenance tasks, your team must still perform sporadic maintenance tasks, based on random user requests and daily server problems reported by agents.

110
Background Story In addition, all such tasks must be performed in a manner that minimizes overall disruptions in the work environment. However, the large number of managed machines and users, and different levels of severity associated with reported problems has forced you to adopt an ad-hoc respond approach, which has proven not to be efficient when it comes to providing adequate and timely user support.

111
Background Story Without an automated system to organize and prioritize user support requests, the user support task becomes tedious and unmanageable. In addition, relying on email as the only communication medium between the user and maintenance technicians creates an unorganized environment where the number of service requests greatly exceeds the technicians’ capacity to handle the requests.

112
Background Story Therefore, you decided to use the Kaseya’s ticketing system and pair it up with your already in-place email system to keep requests organized and prioritized, and to document the progress towards the completion of each request. Kaseya’s Ticketing module enables you to manage service requests. It also allows you to create, distribute, edit, or resolve ticket submissions.

113
LAB Management wants a ticketing system implemented to facilitate user support requests. The ticketing system must be customized to adequately fit into the rest of your support environment. The individual tickets must have two status fields: “Awaiting Customer Feedback” and “Awaiting Customer Approval”.

114
LAB In addition, priority or urgency of tickets must be set to medium by default and the ticket creation process must allow the submitter to select the priority of the ticket. The submitter should also be allowed to view the SLA (Service Level Agreement) type to select whether the issue is server or workstation related. You need to be notified when new tickets are created.
 type to select whether the issue is server or workstation related. You need to be notified when new tickets are created..")
115
LAB The submitter must be notified when a note has been added to their ticket. Support-request emails must be directed to the corresponding support group. If a ticket is created, or if a new note was added to a previous ticket, the submitter should automatically receive an email. Due dates should be automatically set to expedite tickets, especially server tickets due to their importance.

116
LAB If any ticket is overdue, Kaseya should automatically send an email to you, as the head technician. To test the ticketing system you are to create five tickets reporting different issues on different machines. Creating the tickets will make sure the settings are working and will give you a general understanding of how the ticketing module works.

117
LAB Tasks – Add two status fields into the ticketing system “ -Awaiting Customer Feedback” “ -Awaiting Customer Approval” – The default value of Priority must be “Medium”. – Allow ticket submitters to select the priority level themselves to choose the SLA type – Configure Kaseya to send you an email when a new ticket is created to inform the submitter when a note is added

118
Note As the new fields added into the ticketing system by any technician will have a global impact (all the other technicians and end users will see that too), to make sure that you were able to finish this exercise, we are asking you to include your username (indicated as ) to the beginning of the fields that you add. Of course, in a production environment, only one technician would need to configure the ticketing system.

119
New Fields in the Ticket Form Allow tickets to contain the status fields, “ -Awaiting Customer Feedback” and “ -Awaiting Customer Approval”. 1.Open the Ticketing module. Go to Configure Ticketing > Edit Fields. 2.Type “ -Awaiting Customer Feedback” in an empty Field Label textbox. 3.Select “List” in the adjacent dropdown box. 4.Select “ ” in the adjacent dropdown box.

120
New Fields in the Ticket Form

121
5.Click on “Add New” three times to create three separate textboxes. 6.Type in “More Information Needed”, “Yes”, and “None” in textboxes. 7.Click on “Apply”. 8.Click on “Done”. 9.Repeat steps 2-8 for “ -Awaiting Customer Approval”

122
Default Values Set the default value of the Priority field to “Medium”. Allow the ticket submitter to select the priority themselves and allow them to view the SLA type. 10.Select “Medium” in the dropdown next to Priority.

123
Access to Ticket Fields 11.Open the Ticketing module. Go to Configure Ticketing >Access Policy. 12.Select “Full Access” in the Priority dropdown box. 13.Select “View Only” in the SLA Type dropdown box. 11.Open the Ticketing module. Go to Configure Ticketing >Access Policy. 12.Select “Full Access” in the Priority dropdown box. 13.Select “View Only” in the SLA Type dropdown box.

124
Email Notification Policy Define the email notification policy for all groups within the fiu organization. Also be sure to notify the ticket submitter when a note was added. 14.Open the Ticketing module. Go to Configure Ticketing > Notify Policy. 15.Select all groups within the “fiu- ” organization. 16.Select the Ticket Creation checkbox. 17.Select the Notify Ticket Submitter when note added checkbox. 18.Verify everything else is unchecked. 19.Type in your personal email in the Email List textbox. 20.Click on Update.

125
Email Notification Policy

126
LAB / Homework Create five tickets: 1.A closed ticket with one hour spent on server maintenance, which is assigned to you. The purpose of the ticket is to report a network problem. 2.A ticket awaiting customer feedback with two hours spent and assigned to you with a high priority on laptop1. The purpose of the ticket is an application problem. 3.A not resolved ticket with four hours spent and assigned to you on laptop1. The purpose of the ticket is workstation configuration.

127
LAB / Homework Create five tickets: 4.A not resolved ticket with four hours spent and assigned to you on pc1. The purpose of the ticket is workstation configuration. 5.An open ticket on guest1. The purpose of the ticket is printing problems.

128
Note When creating tickets, the Summary and Note textboxes are required before creating the ticket, feel free to choose on your own what should be included in the textboxes. Also, feel free to add in other information not required for this exercise.

129
Creating the First Ticket Create a closed ticket. Set the Hours Worked to one hour, assign the Assignee to you, assign the ticket to the dc machine, and assign the Category to “Network Problem”. 21.Open the Ticketing module. Go to Manage Tickets > Create/View. 22.Click on Select association.

130
Creating the First Ticket 23.Select “machine” in the dropdown box. 24.Select the “dc.mr.fiu- ” radio button.

131
Creating the First Ticket 25.Type in the ticket summary in the Summary textbox. 26.Select “ ” in the Assignee dropdown box. 27.Select “Network Problem” in the Category dropdown box. 28.Type “1” in the Hours Worked textbox. 29.Type in the ticket notes in the Enter new note textbox. 30.Click on Submit. 31.Select “Closed” in the Status dropdown box.

132
Creating the First Ticket

133
LAB Creating automated tasks within the Ticketing module will greatly help in creating and organizing tickets. Kaseya provides a way to retrieve email from an account and organize the email requests into tickets. By creating a company email and asking ticket submitters to direct their requests to the designated email address, Kaseya can automatically create and store tickets in their group.

134
LAB To help in expediting tickets, due dates are required based on priority: – For servers, high priority requires completion within two hours, normal priority requires completion within four hours, and low priority requires completion within eight hours. – For workstations, high priority requires completion within four hours, normal priority requires completion within one day, and low priority requires completion within three days. If a ticket becomes overdue, a notification will be sent to your email.

135
Due Date Policy Create a due date policy for all tickets. – For servers, high priority requires completion within two hours, medium priority requires completion within four hours, and low priority requires completion within eight hours. – For workstations, high priority requires completion within four hours, medium priority requires completion within one day, and low priority requires completion within three days.

136
Due Date Policy 85.Go to Ticketing > Configure Ticketing > Due Date Policy. 86.Type “ -server-high” in the Policy Name textbox. 87.Select “2 hours” in the Resolve Time dropdown. 88.Select “High” in the Priority dropdown. 89.Select “Servers” in the SLA Type. 90.Click on Create.

137
Due Date Policy 91.Repeat steps 86-90 for “medium” and “low” priorities.

138
Due Date Policy 92.Type “ -workstations-high” in the Policy Name textbox. 93.Select “4 hours” in the Resolve Time dropdown. 94.Select “High” in the Priority dropdown. 95.Select “Workstations” in the Priority dropdown box. 96.Click on Create.

139
Due Date Policy 97.Repeat steps 92-96 for “medium” and “low” priorities.

140
Notify Policy Edit the email notification policy for the scis, mr, gl, and cec groups within the fiu organization. 98.Open the Ticketing module. Go to Configure Ticketing > Notify Policy. 99.Select the scis, mr, gl, and cec groups within the “fiu- ” organization. 100.Select the Overdue Ticket checkbox. 101.Type in your personal email in the Email List textbox. 102.Click on Update.

141
Notify Policy

142
Email Reader Examine the settings and the options available for Email Reader. 72.Open the Ticketing module. View the contents of Configure Ticketing > Email Reader. Note what settings can be set.

143
Creating a New Machine Group Under the organization name “FIU- ”, create machine group “support”. 73.Open the System module. Go to Orgs / Groups / Depts > Manage. 74.Verify if the Organization “FIU- ” is checked. 75.Click on Machine Group on the right hand side of the module. 76.Click on New in this section.

144
Creating a New Machine Group

145
77.Create a group by typing its name “support” under Machine Group Name. Click Save.

146
Email Mapping Map emails to the “support” group if they come from your email address. 78.Go to Ticketing > Configure Ticketing > Email Mapping. 79.Click on Select association.

147
Email Mapping 80.Select group in the dropdown box. 81.Click on the “fiu-.support” group.

148
Email Mapping 82.Type in your personal email in the Email Address or Domain textbox. 83.Select in the Assignee dropdown box. 84.Click on Create.

149
Note For this exercise, your own personal email should be used. However, in a production environment application, a ticket submitter’s email would be used.

150
Creating the Second Ticket Create a ticket awaiting customer feedback. Set the Hours Worked to two hours, assign the Assignee to you, assign the ticket to the laptop1 machine, assign the Priority to “High”, and assign the Category to “Application Problem”. 32.Open the Ticketing module. Go to Manage Tickets > Create/View. 33.Click on Select association.

151
Creating the Second Ticket 34.Select “machine” in the dropdown box. 35.Select the “laptop1.cec.fiu- ” radio button.

152
Creating the Second Ticket 36.Type in the ticket summary in the Summary textbox. 37.Select “ ” in the Assignee dropdown box. 38.Select “Application Problem” in the Category dropdown box. 39.Select “High” in the Priority dropdown box. 40.Type “2” in the Hours Worked textbox. 41.Select “Yes” in the -Awaiting Customer Feedback dropdown box. 42.Type in the ticket notes in the Enter new note textbox. 43.Click on Submit.

153
Creating the Second Ticket

154
Create a ticket waiting to be resolved. Set the Hours Worked to four hours, assign the Assignee to you, assign the ticket to the laptop1 machine, and assign the Category to “Workstation Configuration”. 44.Open the Ticketing module. Go to Manage Tickets > Create/View. 45.Click on Select association.

155
Creating the Second Ticket 46.Select “machine” in the dropdown box. 47.Select the “laptop1.cec.fiu- ” radio button.

156
Creating the Third Ticket 48.Type in the ticket summary in the Summary textbox. 49.Select “ ” in the Assignee dropdown box. 50.Select “Workstation Configuration” in the Category dropdown box. 51.Type “4” in the Hours Worked textbox. 52.Type in the ticket notes in the Enter new note textbox. 53.Click on Submit.

157
Creating the Third Ticket

158
Creating the Fourth Ticket Create a ticket waiting to be resolved. Set the Hours Worked to four hours, assign the Assignee to you, assign the ticket to the pc1 machine, and assign the Category to “Workstation Configuration”. 54.Open the Ticketing module. Go to Manage Tickets > Create/View. 55.Click on Select association.

159
Creating the Fourth Ticket 56.Select “machine” in the dropdown box. 57.Select the “pc1.cec.fiu- ” radio button.

160
Creating the Fourth Ticket 58.Type in the ticket summary in the Summary textbox. 59.Select “ ” in the Assignee dropdown box. 60.Select “Workstation Configuration” in the Category dropdown box. 61.Type “4” in the Hours Worked textbox. 62.Type in the ticket notes in the Enter new note textbox. 63.Click on Submit.

161
Creating the Fourth Ticket

162
Creating the Fifth Ticket Create an open ticket. Assign the ticket to the guest1 machine, and assign the Category to “Printing Problem”. 64.Open the Ticketing module. Go to Manage Tickets > Create/View. 65.Click on Select association.

163
Creating the Fifth Ticket 66.Select “machine” in the dropdown box. 67.Select the “guest1.gl.fiu- ” radio button.

164
Creating the Fifth Ticket 68.Type in the ticket summary in the Summary textbox. 69.Select “Printing Problem” in the Category dropdown box. 70.Type in the ticket notes in the Enter new note textbox. 71.Click on Submit.

165
Creating the Fifth Ticket

166
MONITOR WRAP UP

167
Monitor Wrap Up Monitor Results – Review Monitor Set for Server Logs – Review Alarm Summary – Review Windows Event Logs Sets Monitor Help Manual Work through the LABS

168
Roadmap! 1.Monday, Day One Morning – Overview – System Architecture – Agents 2.Monday, Day One Afternoon – LAB Review – Agent Template and Policy Management Concepts – Audit – Patch Management 3.Tuesday, Day Two Morning – LAB Review – Monitor – Ticketing 4.Tuesday, Day Two Afternoon – LAB Review – Agent Procedures – Remote Control – Live Connect 5.Friday, Day Three Morning – LAB Review – Agent Template vs. Policy Management – System – Info Center 4.Tuesday, Day Two Afternoon – LAB Review – Agent Procedures – Remote Control – Live Connect 5.Friday, Day Three Morning – LAB Review – Agent Template vs. Policy Management – System – Info Center

169
THE END!

Similar presentations


 Chapter 14 Server and Network Monitoring.>")


