Download presentation
Presentation is loading. Please wait.

1
Drawing Velocity Time Graphs from Position Time Graphs
Uniform and Non-Uniform Motion

2
Think about… Sketch a position-time graph of each object listed below. Describe its slope as positive or negative, and as constant, increasing, or decreasing. A) a stone at rest B) a jogger moving steadily to the right C) a bicycle moving to the left and slowing down D) a rocket moving up at an increasing speed E) a stone falling freely with increasing speed F) a parachutist drifting down at a steady speed
 a stone at rest. B) a jogger moving steadily to the right. C) a bicycle moving to the left and slowing down. D) a rocket moving up at an increasing speed. E) a stone falling freely with increasing speed. F) a parachutist drifting down at a steady speed.")
3
Non-Uniform Motion An object does not always move at a constant speed.
You may speed up or slow down. Non-uniform motion, when graphed, appears as a curve not a straight line.

4
Instantaneous Velocity
When you are driving on the highway and you look down at your speedometer, you are traveling at + 55 km/h. At that instant in time, + 55 km/h is your instantaneous velocity. For uniform motion, your instantaneous velocity is the same as you average velocity. For non-uniform motion, your instantaneous velocity changes.

5
Finding Instantaneous Velocity from a Graph (Uniform Motion)
To find instantaneous velocity on a uniform position-time graph, just find the average velocity for the given segment.

6
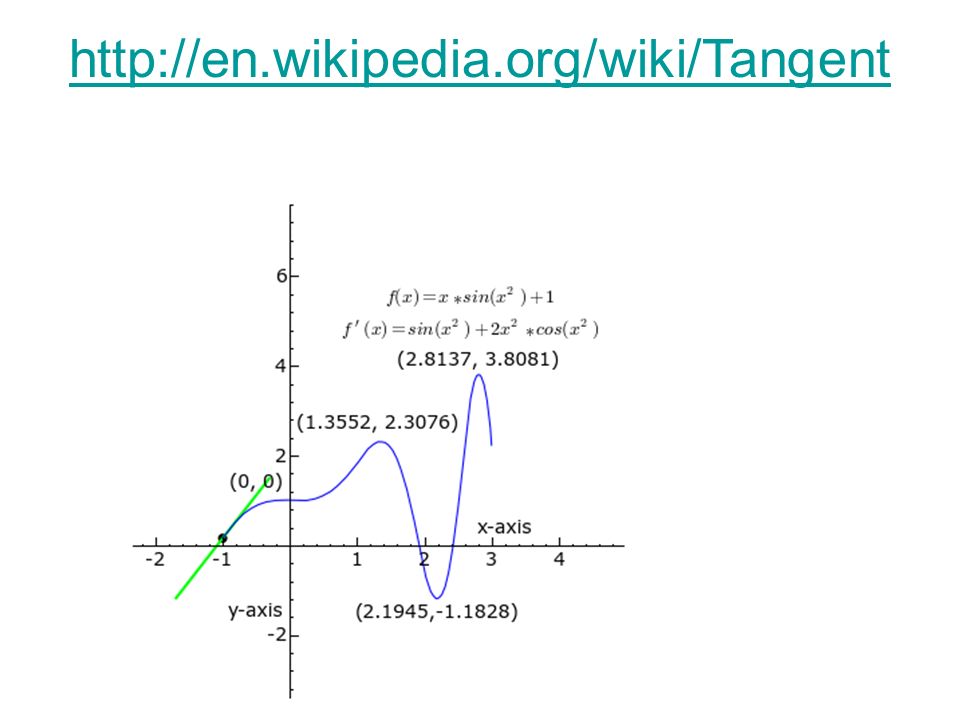
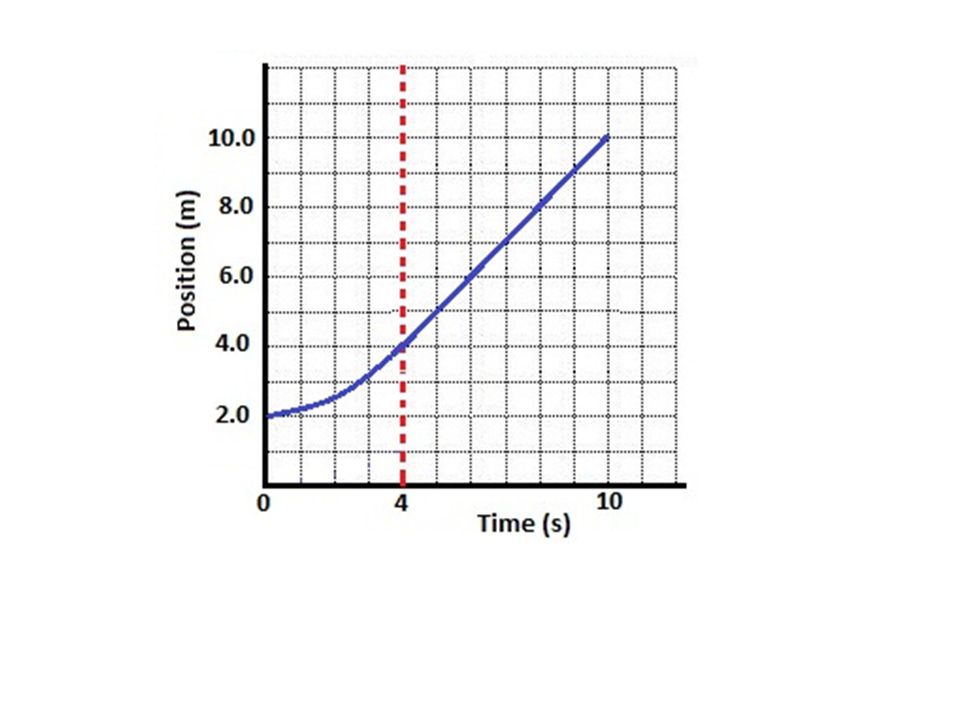
Finding Instantaneous Velocity from a Graph (Non-Uniform Motion)
To find instantaneous velocity on a non-uniform position-time graph, draw a line that is tangent to the curve at that point. The slope is the instantaneous velocity (take the two points on the tangent from each side of the point).
.")
9
Instantaneous Velocity (Non-uniform Motion)
")
10
Worksheet

11
What does a v-t graph look like?
Time is marked on the horizontal axis and velocity is on the vertical. Graphs that represent an object’s velocity versus its time.

12
What can we determine from a velocity time graph?
Velocity and speed Time Acceleration Displacement and distance

13
What can we determine from a velocity time graph?
Velocity - reading directly off the y-axis

14
What can we determine from a velocity time graph?
Time (read off the x-axis)
")
15
What can we determine from a velocity time graph?
Displacement = area under the curve NOTE: Area formulas: Arearectangle = length x width Areatriangle = ½ base x height

16
What can we determine from a velocity time graph?
Acceleration = v/t = slope

17
What can you find from a v-t graph
Acceleration = slope at a point on the graph (you may have to use a tangent) Average acceleration = finding the slope of a segment (use the start and end points)
 Average acceleration = finding the slope of a segment (use the start and end points)")
18
Interpreting v-t graphs
Horizontal lines show uniform motion (constant speed and direction). Inclined lines show change in speed or direction, or both: in other words accelerated motion.
. Inclined lines show change in speed or direction, or both: in other words accelerated motion.")
19
Velocity-Time Graphs

20
Worksheet

21
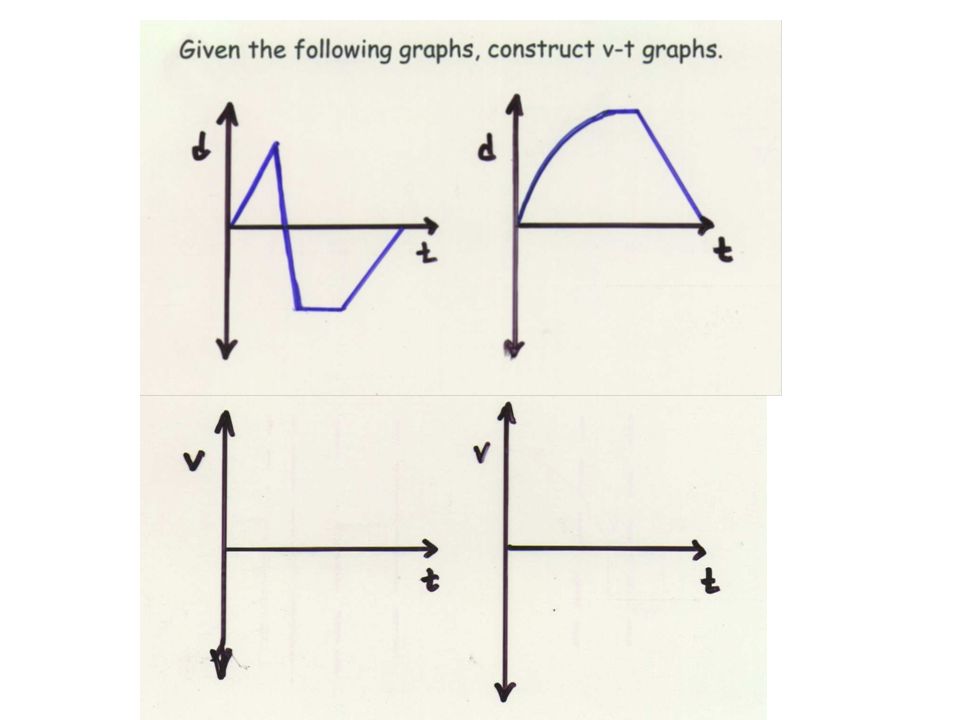
How can we use d-t graphs to determine v-t graphs?
Find the velocity for each section of the graph and plot it (make a list of points).
.")
24
Page 57 Page 57, question 4 Page 58, question 5 Worksheet

Similar presentations


 time(s) Describe the motion of the object represented by this graph This object is at rest 2m.>")


 graph is equal to the: A. acceleration B. distance travelled C. time interval.>")
 Graph Slope of a DT graph gives speed D This is a graph of an object not moving. No slope = No speed T.>")


