Download presentation
Presentation is loading. Please wait.

1
World Consumption Comparison Project By: Emma Lucken

3
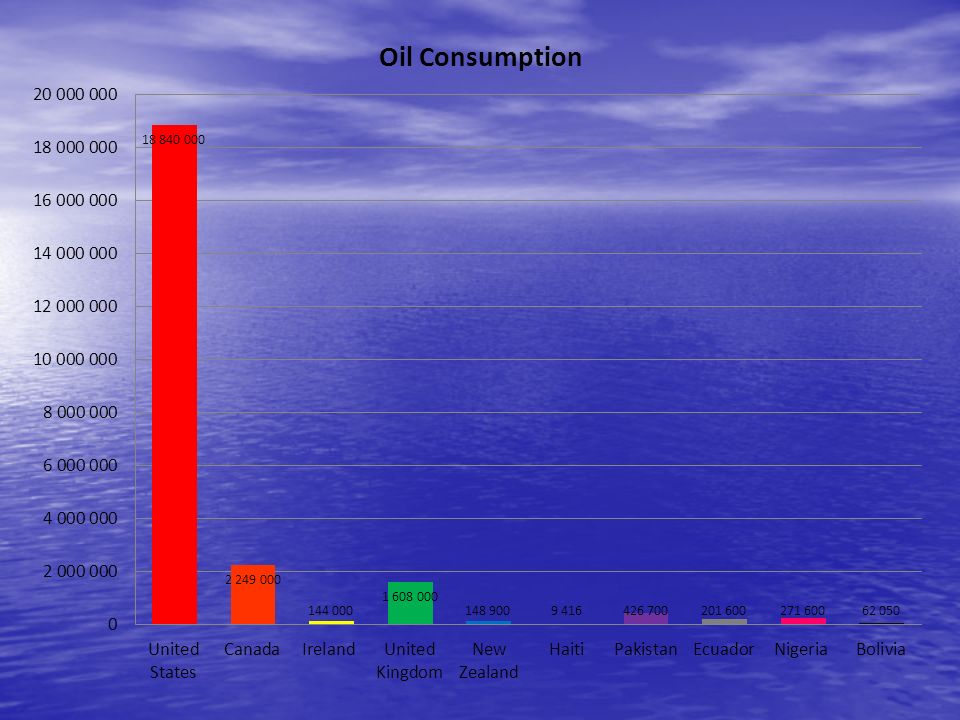
Oil Consumption 1. What country has the largest column? What are the reasons that you think that this country has the highest amount? The country with the largest column is the United States. I think that the reason this is, is because the US is a developed country with lots of money. It also has lots of people that are able to buy products made from oil or gasoline. 2.What country has the smallest/lowest? What reasons would cause this country to have a low amount? The country that has the smallest column is Haiti. The reasons that would cause this country to have a low oil consumption is that it is a developing country. It doesn’t have that much money to spend on objects made of or with oil or to buy gasoline. 3.Look at the 5 th and 6 th ranked countries. Are they developed, developing, or one of each? Why do you think that they are where they are in the rankings? Use data to help you answer the question. Nigeria and Ecuador are the 5 th and 6 th ranked countries; they are both developing countries. I think that they are where they are because they have lots of people even it they are poor. Their populations are very different with Nigeria having a lot more people. Even though their populations are very different their oil consumption is similar. This is because Ecuador is a producer of oil; this makes their oil consumption higher. Nigeria has both a high population and is a big producer of oil so, even if it is poor it has a large amount of oil consumption.

4
Oil Consumption Cont. 4. Look at the 7 th and 8 th ranked countries. Are they developing countries? If so, what do they need to do in order to get to the top half of the rankings? Use data from any information to help you answer the question. The 7 th and 8 th ranked countries are New Zealand and Ireland. This is because they are such tiny countries that they have very few people to consume oil. They also are relatively eco- friendly places and so their oil consumption might be lower than usual. 5. Name another country (other than the US) that stands out to you on the chart. Describe the country and what type of impact it has on world consumption. Canada stands out to me on my chart. Canada is a developed country and since World War II has really had an economy boom. They do not have as many people as the United States but, they are still the second highest column for oil consumption. Their GDP per capita is $40,500 which is a high amount compared to some developing countries.
 that stands out to you on the chart. Describe the country and what type of impact it has on world consumption. Canada stands out to me on my chart. Canada is a developed country and since World War II has really had an economy boom. They do not have as many people as the United States but, they are still the second highest column for oil consumption. Their GDP per capita is $40,500 which is a high amount compared to some developing countries..")
5
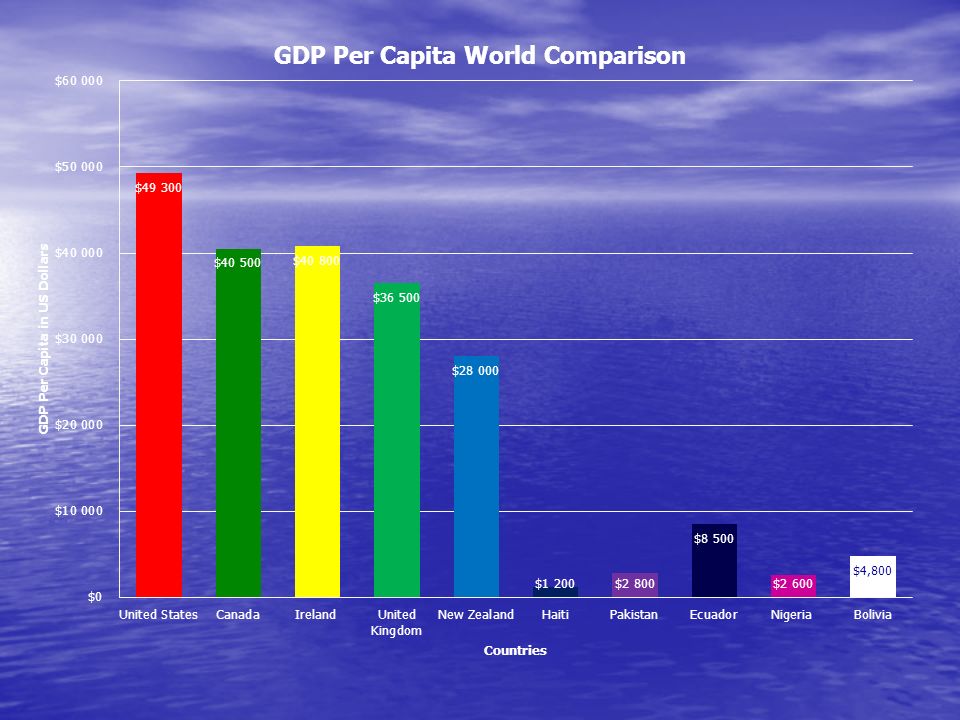
GDP Per Capita 1.What country has the largest column? What are the reasons that you think that this country has the highest amount? The United States has the largest column; I believe that the reasons that this is because it is a developed country with a large population. 2.What country has the smallest/lowest? What reasons would cause this country to have a low amount? Haiti has the smallest GDP per capita; I believe this is because it is a developing country. Many of its people don’t even know how to read (literacy rate is 52.9%)! This results in a lower GDP per capita for everyone (average). Also several disasters have limited development for Haiti. 3.Look at the 5 th and 6 th ranked countries. Are they developed, developing, or one of each? Why do you think that they are where they are in the rankings? Use data to help you answer the question. Ecuador and New Zealand are the 5 th and 6 th ranked countries, New Zealand is developed and Ecuador is developing. I think they are where they are because Ecuador is still developing and has a literacy rate of 91%. This is pretty good for a developing country and so people in Ecuador may have better opportunities than other people that don’t know how to read. Ecuador also is a big oil producer and is solely dependent on their petroleum resources. This can lead to lower GDP per capita if oil is their main resource. New Zealand has a 99% literacy rate which is very high. New Zealand is having some economical problems that might lead to a lower GDP per capita.
. This results in a lower GDP per capita for everyone (average). Also several disasters have limited development for Haiti. 3.Look at the 5 th and 6 th ranked countries. Are they developed, developing, or one of each. Why do you think that they are where they are in the rankings. Use data to help you answer the question. Ecuador and New Zealand are the 5 th and 6 th ranked countries, New Zealand is developed and Ecuador is developing. I think they are where they are because Ecuador is still developing and has a literacy rate of 91%. This is pretty good for a developing country and so people in Ecuador may have better opportunities than other people that don’t know how to read. Ecuador also is a big oil producer and is solely dependent on their petroleum resources. This can lead to lower GDP per capita if oil is their main resource. New Zealand has a 99% literacy rate which is very high. New Zealand is having some economical problems that might lead to a lower GDP per capita..")
6
GDP Per Capita Cont. 4.Look at the 7 th and 8 th ranked countries. Are they developing countries? If so, what do they need to do in order to get to the top half of the rankings? Use data from any information to help you answer the question. Bolivia and Pakistan are the 7 th and 8 th ranked countries. They are both developing countries, to get to the top of the rankings they could improve their literacy rates (Pakistan 54.9%, Bolivia 86.7%). If they improved this they could get more job opportunities or they could higher paying jobs. This would increase their overall GDP Per Capita. This could really improve their rankings. 5.Name another country (other than the US) that stands out to you on the chart. Describe the country and what type of impact it has on world consumption. Ireland really stood out for me; it had the second highest GDP per capita at $40,800, beating Canada ($40,500)but just barely. Ireland is a developed country but has been pretty low on the standings in the past. Ireland relies mainly on trade and has a bit of financial trouble in the last decade but, they seem to be doing well now.
. If they improved this they could get more job opportunities or they could higher paying jobs. This would increase their overall GDP Per Capita. This could really improve their rankings. 5.Name another country (other than the US) that stands out to you on the chart. Describe the country and what type of impact it has on world consumption. Ireland really stood out for me; it had the second highest GDP per capita at $40,800, beating Canada ($40,500)but just barely. Ireland is a developed country but has been pretty low on the standings in the past. Ireland relies mainly on trade and has a bit of financial trouble in the last decade but, they seem to be doing well now..")
9
Physician Density 1.What country has the largest column? What are the reasons that you think that this country has the highest amount? Ireland has the highest column for physician density. Ireland is a developed country which may explain these numbers. Ireland’s literacy rate is 99% showing that it is a very educated country which might explain the number of physicians per 1,000 people. 2.What country has the smallest/lowest? What reasons would cause this country to have a low amount? New Zealand and Haiti are tied for the lowest column. New Zealand is an educated country and it is developed but, it has so few people this might explain it’s numbers. Haiti is a very uneducated, developing, and poor country so these numbers to not shock me. 3.Look at the 5 th and 6 th ranked countries. Are they developed, developing, or one of each? Why do you think that they are where they are in the rankings? Use data to help you answer the question. Ecuador and Bolivia are the 5 th and 6 th ranked countries; they are both developing countries. I think they are where they are because, they have lots of people and their literacy rate is not too high and not too low which might explain why they are right in the middle of the stands. They are poor countries but they still have a good petroleum industry which may help the government or citizens to pay for doctors.

10
Physician Density Cont. 4.Look at the 7 th and 8 th ranked countries. Are they developing countries? If so, what do they need to do in order to get to the top half of the rankings? Use data from any information to help you answer the question. Pakistan and Nigeria are the 7 th and 8 th ranked countries. They are both developing countries and improving their literacy rates (both literacy rates are around the 50% mark. If you improve literacy and education then these countries may be able to train physicians to improve their amount. 5.Name another country (other than the US) that stands out to you on the chart. Describe the country and what type of impact it has on world consumption. The United Kingdom really stands out to me on this chart. It is ahead of the United States in the amount of physicians per one thousand people. The UK is a powerful financial and trading center, it is the third largest economy in Europe. It really plays a part in world consumption, being a developed country, the United Kingdom citizens are able to spend more money on wants.
 that stands out to you on the chart. Describe the country and what type of impact it has on world consumption. The United Kingdom really stands out to me on this chart. It is ahead of the United States in the amount of physicians per one thousand people. The UK is a powerful financial and trading center, it is the third largest economy in Europe. It really plays a part in world consumption, being a developed country, the United Kingdom citizens are able to spend more money on wants..")
Similar presentations


What country has the largest column? What are the reasons that you think that this country has the highest amount? 2)China has the largest column because.>")


. What country has the largest column? What are the reasons that you think that this country.>")


