Download presentation
Presentation is loading. Please wait.

1
Journal Club 埼玉医科大学 総合医療センター 内分泌・糖尿病内科 Department of Endocrinology and Diabetes, Saitama Medical Center, Saitama Medical University 松田 昌文 Matsuda, Masafumi 2011 年 4 月 28 日 8:30-8:55 8階 医局 Jackevicius CA, Tu JV, Ross JS, Ko DT, Carreon D, Krumholz HM. Use of fibrates in the United States and Canada. JAMA. 2011 Mar 23;305(12):1217-24. Hovorka R, Kumareswaran K, Harris J, Allen JM, Elleri D, Xing D, Kollman C, Nodale M, Murphy HR, Dunger DB, Amiel SA, Heller SR, Wilinska ME, Evans ML. Overnight closed loop insulin delivery (artificial pancreas) in adults with type 1 diabetes: crossover randomised controlled studies. BMJ. 2011 Apr 13;342:d1855. doi: 10.1136/bmj.d1855.
: Hovorka R, Kumareswaran K, Harris J, Allen JM, Elleri D, Xing D, Kollman C, Nodale M, Murphy HR, Dunger DB, Amiel SA, Heller SR, Wilinska ME, Evans ML. Overnight closed loop insulin delivery (artificial pancreas) in adults with type 1 diabetes: crossover randomised controlled studies. BMJ Apr 13;342:d1855. doi: /bmj.d")
2
N Engl J Med. 2010 Apr 29;362(17):1563-74. Epub 2010 Mar 14.
: Epub 2010 Mar 14.")
3
primary-prevention trial with gemfibrozil in middle-aged men with dyslipidemia. Safety of treatment, changes in risk factors, and incidence of coronary heart disease. N Engl J Med 1987;317:1237-45. Secondary prevention by raising HDL cholesterol and reducing triglycerides in patients with coronary artery disease: the Bezafibrate Infarction Prevention (BIP) study. Circulation 2000;102:21-7. Effects of long-term fenofibrate therapy on cardiovascular events in 9795 people with type 2 diabetes mellitus Lancet 2005;366:1849-61.
 study. Circulation 2000;102:21-7. Effects of long-term fenofibrate therapy on cardiovascular events in 9795 people with type 2 diabetes mellitus Lancet 2005;366:")
4
JAMA. 2011;305(12):1217-1224 Department of Pharmacy Practice and Administration, College of Pharmacy, Western University of Health Sciences, Pomona, California (Drs Jackevicius and Carreon); Institute for Clinical Evaluative Sciences, Toronto, Ontario, Canada (Drs Jackevicius, Tu, and Ko); Department of Health Policy, Management, and Evaluation, Faculty of Medicine (Drs Jackevicius and Tu) and Division of Cardiology, Schulich Heart Centre, Sunnybrook Health Sciences Centre (Drs Tu and Ko), University of Toronto, Toronto, Ontario, Canada; Veterans Affairs Greater Los Angeles Healthcare System, Los Angeles, California (Dr Jackevicius); University Health Network, Toronto, Ontario, Canada (Dr Jackevicius); Department of Medicine, Section of General Internal Medicine (Dr Ross), Department of Epidemiology and Public Health, Section of Health Policy and Administration (Dr Krumholz), and Section of Cardiovascular Medicine (Dr Krumholz), Yale University School of Medicine, Center for Outcomes Research and Evaluation, Yale NewHaven Hospital,NewHaven, Connecticut (Drs Ross and Krumholz); and RobertWoodJohnson Clinical Scholars Program, New Haven, Connecticut (Dr Krumholz)
: Department of Pharmacy Practice and Administration, College of Pharmacy, Western University of Health Sciences, Pomona, California (Drs Jackevicius and Carreon); Institute for Clinical Evaluative Sciences, Toronto, Ontario, Canada (Drs Jackevicius, Tu, and Ko); Department of Health Policy, Management, and Evaluation, Faculty of Medicine (Drs Jackevicius and Tu) and Division of Cardiology, Schulich Heart Centre, Sunnybrook Health Sciences Centre (Drs Tu and Ko), University of Toronto, Toronto, Ontario, Canada; Veterans Affairs Greater Los Angeles Healthcare System, Los Angeles, California (Dr Jackevicius); University Health Network, Toronto, Ontario, Canada (Dr Jackevicius); Department of Medicine, Section of General Internal Medicine (Dr Ross), Department of Epidemiology and Public Health, Section of Health Policy and Administration (Dr Krumholz), and Section of Cardiovascular Medicine (Dr Krumholz), Yale University School of Medicine, Center for Outcomes Research and Evaluation, Yale NewHaven Hospital,NewHaven, Connecticut (Drs Ross and Krumholz); and RobertWoodJohnson Clinical Scholars Program, New Haven, Connecticut (Dr Krumholz).")
5
Context Interest in the role of fibrates intensified after the publication of the negative results from the Action to Control Cardiovascular Risk in Diabetes (ACCORD) trial, which assessed therapy with fenofibrate plus statins. The evidence for clinical benefit in outcomes with the use of fibrates is heavily weighted on the use of the older fibrates such as gemfibrozil and clofibrate.

6
Objectives To examine trends in the current use of fibrates and to examine the relationship between differences in the availability and use of brand-name vs generic formulations of fenofibrate and the economic implications in the United States compared with Canada. Design, Setting, and Patients Population-level, observational cohort study using IMS Health data from the United States and Canada of patients prescribed fibrates between January 2002 and December 2009. Main Outcome Measures Fibrate prescriptions dispensed and expenditures.

7
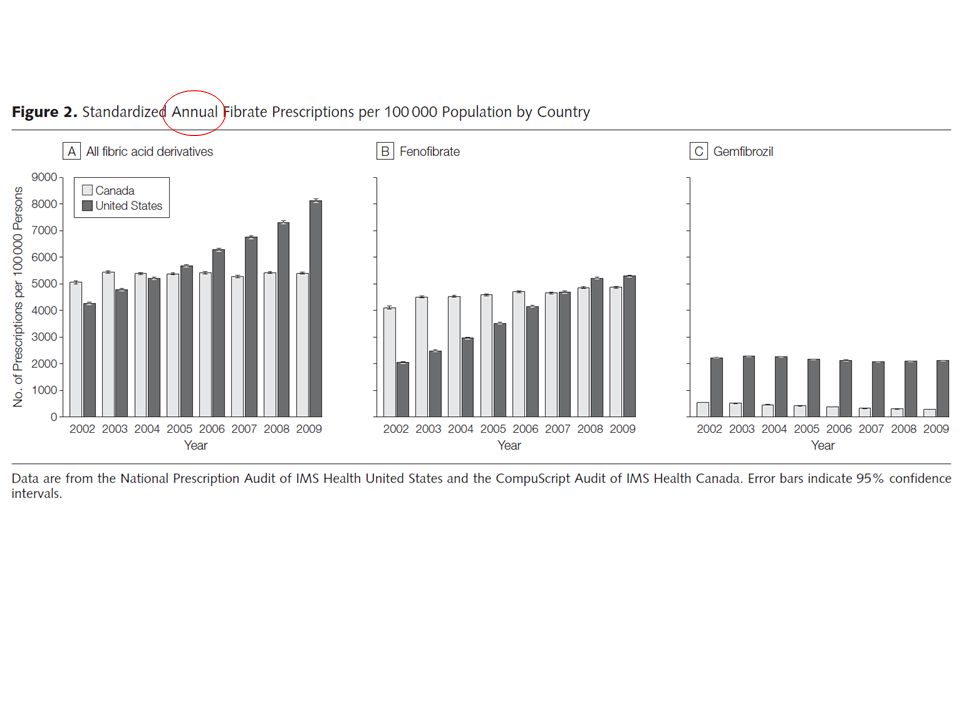
Data are from the National Prescription Audit of IMS Health United States and the CompuScript Audit of IMS Health Canada. Figure 1. Fibrate Prescriptions in the United States and Canada per 100 000 Population per Month

8
Data are from the National Prescription Audit of IMS Health United States and the CompuScript Audit of IMS Health Canada. Figure 1. Fibrate Prescriptions in the United States and Canada per 100 000 Population per Month

11
Data are from the National Prescription Audit of IMS Health United States and the CompuScript Audit of IMS Health Canada. The predominant generic version of Lipidil Supra received approval for market in April 2006. Figure 3. Brand and Generic Fibrate Prescriptions in the United States and Canada per 100 000 Population per Month

13
COMMENT This pattern is paradoxical to declines that might have been expected because the only clinical outcomes evidence for fenofibrate during our study period was the FIELD trial, which failed to find a significant reduction in the primary end point of coronary events in a diabetic population. The US pattern is unusual in that brand-name formulations typically comprise approximately25% to 30%of the product market share for medications 12 years postmarket launch. The preferential use of brand-name fibrate products continues with the latest product Trilipix (which is the active metabolite of fenofibrate), showing a rate of increase in use that far exceeds even that for fenofibrate, even though this specific formulation has yet to be evaluated in clinical outcomes studies. Trilipix is approved for use with statins, while all other fibrates have warnings against combined use with statins. Current US guidelines recommend that fibrates without regard to type should only be considered for reducing very high levels of triglycerides to prevent pancreatitis, for treatment of dysbetalipoproteinemia, and as supplemental therapy to statins in patients with diabetes and high non–high-density lipoprotein cholesterol. The 2006 revision of the Canadian guidelines now more cautiously reserves treatment with fibrates for severe hypertriglyceridemia.
, showing a rate of increase in use that far exceeds even that for fenofibrate, even though this specific formulation has yet to be evaluated in clinical outcomes studies. Trilipix is approved for use with statins, while all other fibrates have warnings against combined use with statins. Current US guidelines recommend that fibrates without regard to type should only be considered for reducing very high levels of triglycerides to prevent pancreatitis, for treatment of dysbetalipoproteinemia, and as supplemental therapy to statins in patients with diabetes and high non–high-density lipoprotein cholesterol. The 2006 revision of the Canadian guidelines now more cautiously reserves treatment with fibrates for severe hypertriglyceridemia..")
14
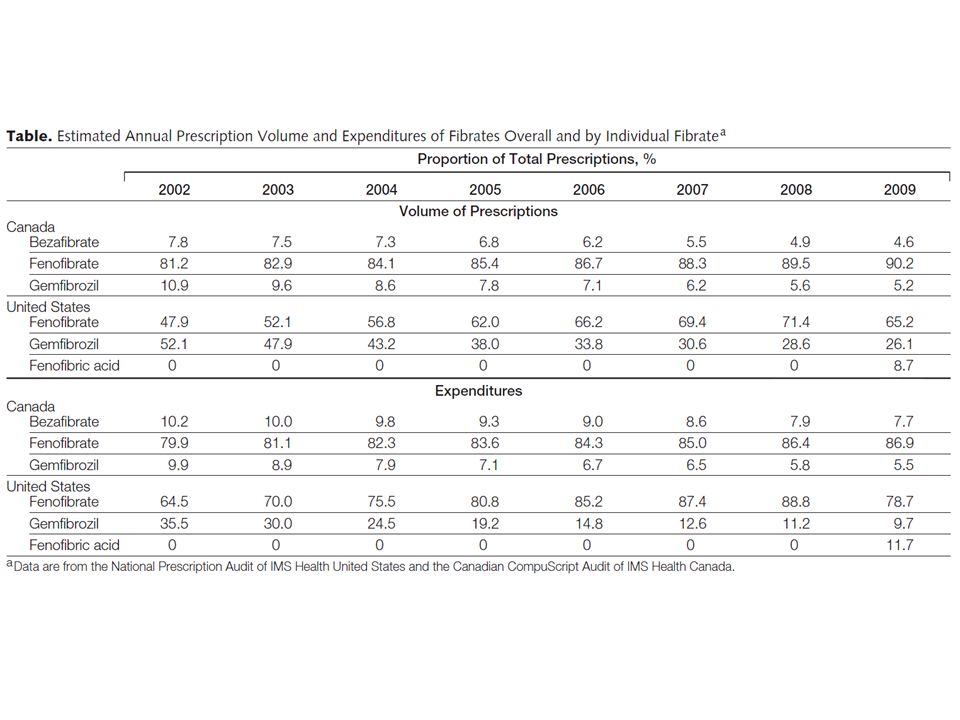
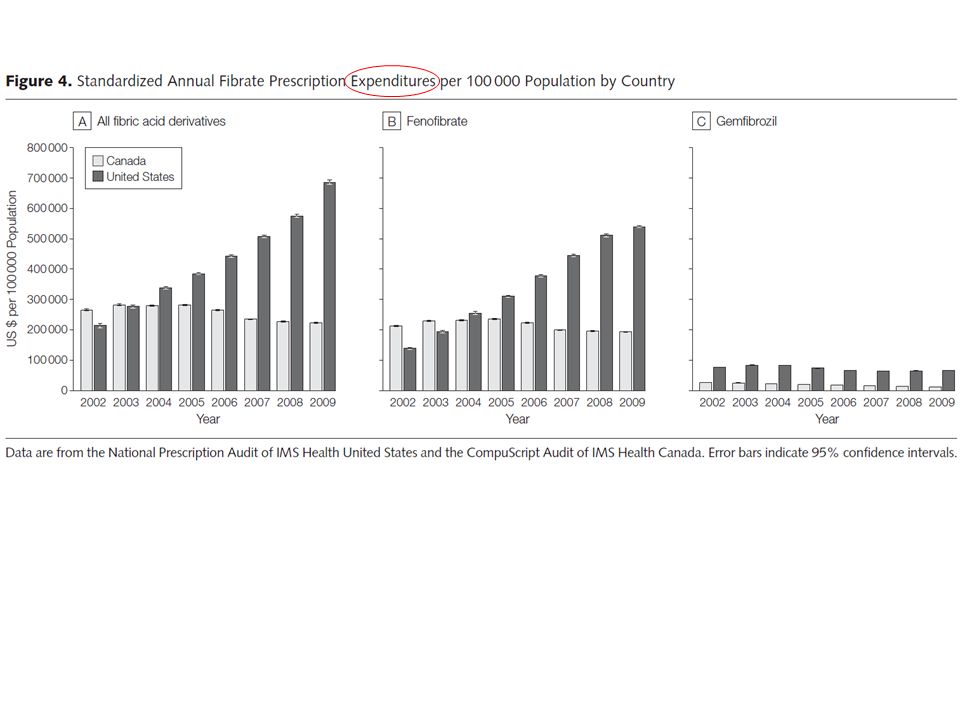
Results In the United States, fibrate prescriptions dispensed increased from 336 prescriptions/ 100 000 population in January 2002 to 730 prescriptions/100 000 population in December 2009, an increase of 117.1% (95% confidence interval [CI], 116.0%- 117.9%), whereas in Canada, fibrate prescriptions increased from 402 prescriptions/ 100 000 population in January 2002 to 474 prescriptions/100 000 population in December 2009, an increase of 18.1% (95% CI, 17.9%- 18.3%) (P <.001). In the United States, fenofibrate prescriptions dispensed increased from 150 prescriptions/100 000 population in January 2002 to 440 prescriptions/100 000 population in December 2009, an increase of 159.3% (95% CI, 157.7%-161.0%), comprising 47.9% of total fibrate prescriptions in 2002 and 65.2% in 2009. In Canada, fenofibrate prescriptions increased from 321 prescriptions/100 000 population in January 2002 to 429 prescriptions/ 100 000 population in December 2009. The annual ratio of generic to brandname fenofibrate use in the United States ranged from 0:1 to 0.09:1 between 2002 and 2008, while the ratio in Canada steadily increased from 0.51:1 to 1.89:1 between 2005 and 2008. In the United States, crude fenofibrate expenditures increased from $11 535/100 000 population/month in 2002 to $44 975/100 000 population/month in 2009, while the rates in Canada declined from $17 695/100 000 population/ month in 2002 to $16 112/100 000 population/month in 2009. Fibrate expenditures per 100 000 population were 3-fold higher in 2009 in the United States compared with Canada.
![Results In the United States, fibrate prescriptions dispensed increased from 336 prescriptions/ population in January 2002 to 730 prescriptions/ population in December 2009, an increase of 117.1% (95% confidence interval [CI], 116.0% %), whereas in Canada, fibrate prescriptions increased from 402 prescriptions/ population in January 2002 to 474 prescriptions/ population in December 2009, an increase of 18.1% (95% CI, 17.9%- 18.3%) (P <.001).](http://images.slideplayer.com/21/6297739/slides/slide_14.jpg "In the United States, fenofibrate prescriptions dispensed increased from 150 prescriptions/ population in January 2002 to 440 prescriptions/ population in December 2009, an increase of 159.3% (95% CI, 157.7%-161.0%), comprising 47.9% of total fibrate prescriptions in 2002 and 65.2% in In Canada, fenofibrate prescriptions increased from 321 prescriptions/ population in January 2002 to 429 prescriptions/ population in December The annual ratio of generic to brandname fenofibrate use in the United States ranged from 0:1 to 0.09:1 between 2002 and 2008, while the ratio in Canada steadily increased from 0.51:1 to 1.89:1 between 2005 and In the United States, crude fenofibrate expenditures increased from $11 535/ population/month in 2002 to $44 975/ population/month in 2009, while the rates in Canada declined from $17 695/ population/ month in 2002 to $16 112/ population/month in Fibrate expenditures per population were 3-fold higher in 2009 in the United States compared with Canada..")
15
Conclusion During the past decade, prescriptions for fibrates (particularly fenofibrate) increased in the United States, while prescriptions for fibrates in Canada remained stable.
 increased in the United States, while prescriptions for fibrates in Canada remained stable.")
16
Message/Comments 2002-09 年の米国とカナダにおけるフィブラー ト系薬剤の処方動向や後発医薬品の使用状況等 を観察コホート研究で検証。フィブラート系薬 剤処方の増加率は米国で 117.1 %、カナダで 18.1 %であったが、フェノフィブラートの後発 医薬品の使用比率はカナダで高かった。 2009 年 における米国のフィブラート系薬剤の消費額は カナダの 3 倍だった。 めちゃくちゃ TG が高い人が米国では増えている のではないか?

18
Figure A4: Plasma glucose, insulin infusion, and plasma insulin during APCam03 (n = 9) Distribution of insulin infusion rates during APCam03 Lancet 2010; 375: 743–51 Manual closed-loop insulin delivery in children and adolescents with type 1 diabetes: a phase 2 randomised crossover trial.
 Distribution of insulin infusion rates during APCam03 Lancet 2010; 375: 743–51 Manual closed-loop insulin delivery in children and adolescents with type 1 diabetes: a phase 2 randomised crossover trial.")
19
BMJ 2011;342:d1855

20
Objective To compare the safety and efficacy of overnight closed loop delivery of insulin (artificial pancreas) with conventional insulin pump therapy in adults with type 1 diabetes. The study was performed on type 1 diabetic pediatric patients using pumps and meters from Smiths Medical, Medtronic, and Abbott.

21
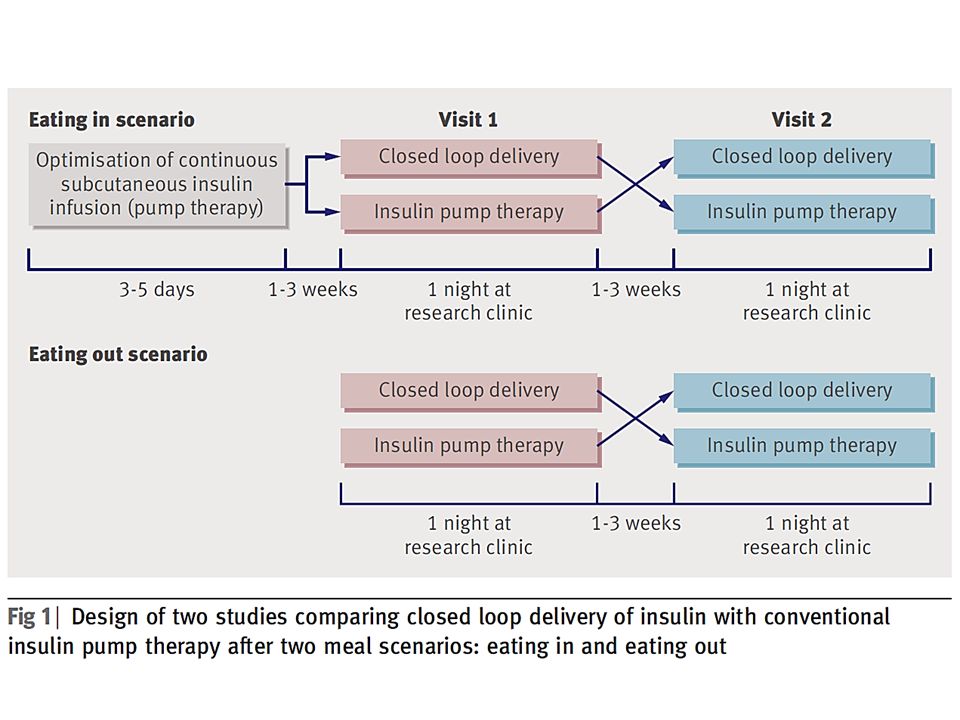
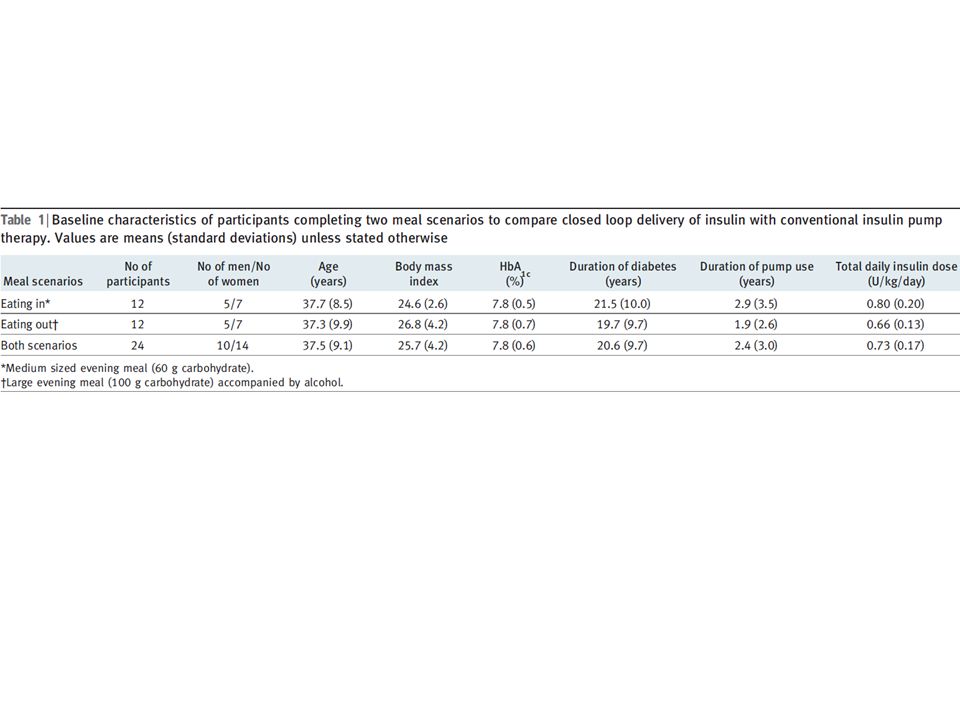
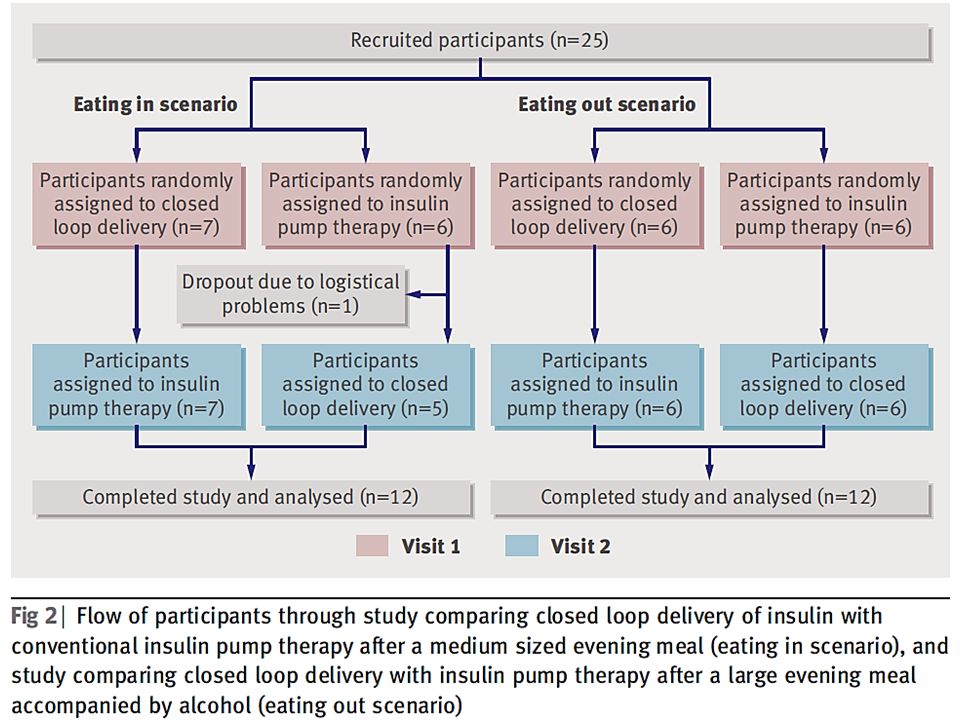
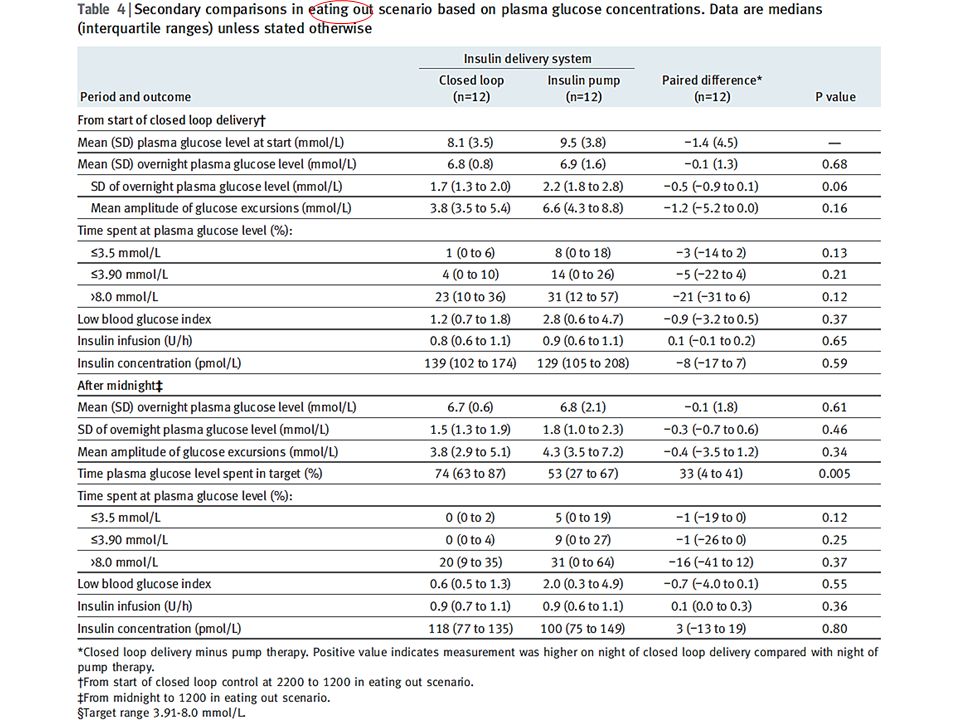
Design Two sequential, open label, randomised controlled crossover, single centre studies. Setting Clinical research facility. Participants 24 adults (10 men, 14 women) with type 1 diabetes, aged 18-65, who had used insulin pump therapy for at least three months: 12 were tested after consuming a medium sized meal and the other 12 after consuming a larger meal accompanied by alcohol. Intervention During overnight closed loop delivery, sensor measurements of glucose were fed into a computer algorithm, which advised on insulin pump infusion rates at 15 minute intervals. During control nights, conventional insulin pump settings were applied. One study compared closed loop delivery of insulin with conventional pump therapy after a medium sized evening meal (60 g of carbohydrates) at 1900, depicting the scenario of “eating in.” The other study was carried out after a later large evening meal (100 g of carbohydrates) at 2030, accompanied by white wine (0.75 g/kg ethanol) and depicted the scenario of “eating out.” Main outcome measures The primary outcome was the time plasma glucose levels were in target (3.91-8.0 mmol/L) during closed loop delivery and a comparable control period. Secondary outcomes included pooled data analysis and time plasma glucose levels were below target (≤3.9 mmol/L).
 with type 1 diabetes, aged 18-65, who had used insulin pump therapy for at least three months: 12 were tested after consuming a medium sized meal and the other 12 after consuming a larger meal accompanied by alcohol. Intervention During overnight closed loop delivery, sensor measurements of glucose were fed into a computer algorithm, which advised on insulin pump infusion rates at 15 minute intervals. During control nights, conventional insulin pump settings were applied. One study compared closed loop delivery of insulin with conventional pump therapy after a medium sized evening meal (60 g of carbohydrates) at 1900, depicting the scenario of eating in. The other study was carried out after a later large evening meal (100 g of carbohydrates) at 2030, accompanied by white wine (0.75 g/kg ethanol) and depicted the scenario of eating out. Main outcome measures The primary outcome was the time plasma glucose levels were in target ( mmol/L) during closed loop delivery and a comparable control period. Secondary outcomes included pooled data analysis and time plasma glucose levels were below target (≤3.9 mmol/L)..")
22
Closed loop algorithm We used an algorithm based on the model predictive control approach. Every 15 minutes a research nurse initiated a control cycle; the nurse inputted the sensor glucose value into the computer based algorithm and adjusted the insulin pump according to the basal infusion rate calculated by the algorithm. The calculations utilised a compartment model of glucose kinetics, describing the effect of rapid acting insulin and the carbohydrate content of meals on glucose excursions detected by the sensor. The algorithm was initialised using participant’s weight, total daily insulin dose, and basal insulin requirements. Additionally, the algorithm was provided with glucose levels measured by the sensor during a 30 minute period preceding the start of closed loop delivery, the carbohydrate content of the evening meal, and the prandial insulin bolus. The algorithm adapted itself to participants by updating two model variables: an endogenous glucose flux correcting for errors in model based predictions, and carbohydrate bioavailability. Several competing models differing in the absorption of subcutaneous insulin and oral carbohydrates ran in parallel. A combined model forecasted plasma glucose excursions over a 2.5 hour prediction horizon. The algorithm aimed to achieve glucose levels between 5.8 (104) and 7.3 (131) mmol/L (mg/dl) and adjusted the actual level depending on fasting versus postprandial status, preceding glucose levels, and the accuracy of predictions made by the compartment model. Safety rules limited maximum insulin infusion and suspended insulin delivery when the sensor measured glucose at or below 4.3 mmol/L or when the sensor detected that glucose was decreasing rapidly. We used algorithm version 0.02.04 to 0.02.18.
 and 7.3 (131) mmol/L (mg/dl) and adjusted the actual level depending on fasting versus postprandial status, preceding glucose levels, and the accuracy of predictions made by the compartment model. Safety rules limited maximum insulin infusion and suspended insulin delivery when the sensor measured glucose at or below 4.3 mmol/L or when the sensor detected that glucose was decreasing rapidly. We used algorithm version to")
27
Fig 3 Profiles (medians and interquartile ranges) of plasma glucose and insulin concentrations and insulin infusion in eating in scenario (12 participants). Outlying squares represent hypoglycaemic events (glucose level <3.0 mmol/L)
.")
28
Fig 4 Profiles (medians and interquartile ranges) of plasma glucose and insulin concentrations and insulin infusion in the eating out scenario (12 participants). Outlying squares represent hypoglycaemic events (glucose level <3.0 mmol/L)
.")
33
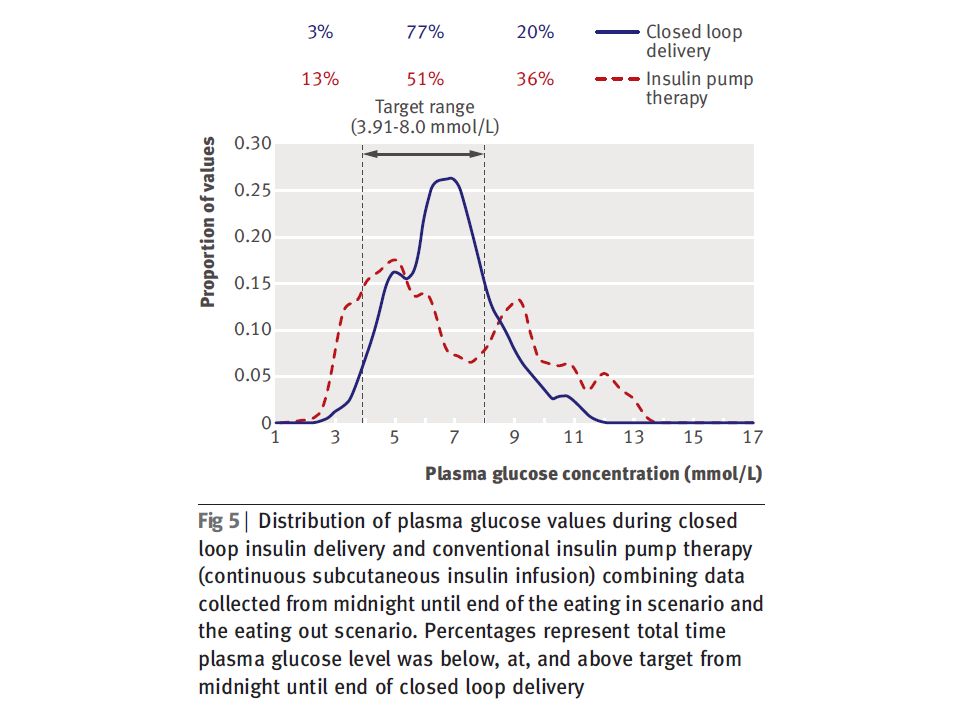
Cumulative probabilities of plasma glucose (solid lines) and sensor glucose (dashed lines) during closed-loop insulin delivery from midnight to the end of closed-loop (red lines) and during continuous subcutaneous insulin infusion (grey lines) combining data observed in 2 scenarios. Cumulative probability of plasma glucose (solid lines) and sensor glucose (dashed lines) during closed-loop insulin delivery from start of closed-loop to the end of closed-loop (red lines) and during continuous subcutaneous insulin infusion (grey lines) combining data observed in eating in scenarios.
 and sensor glucose (dashed lines) during closed-loop insulin delivery from start of closed-loop to the end of closed-loop (red lines) and during continuous subcutaneous insulin infusion (grey lines) combining data observed in eating in scenarios..")
34
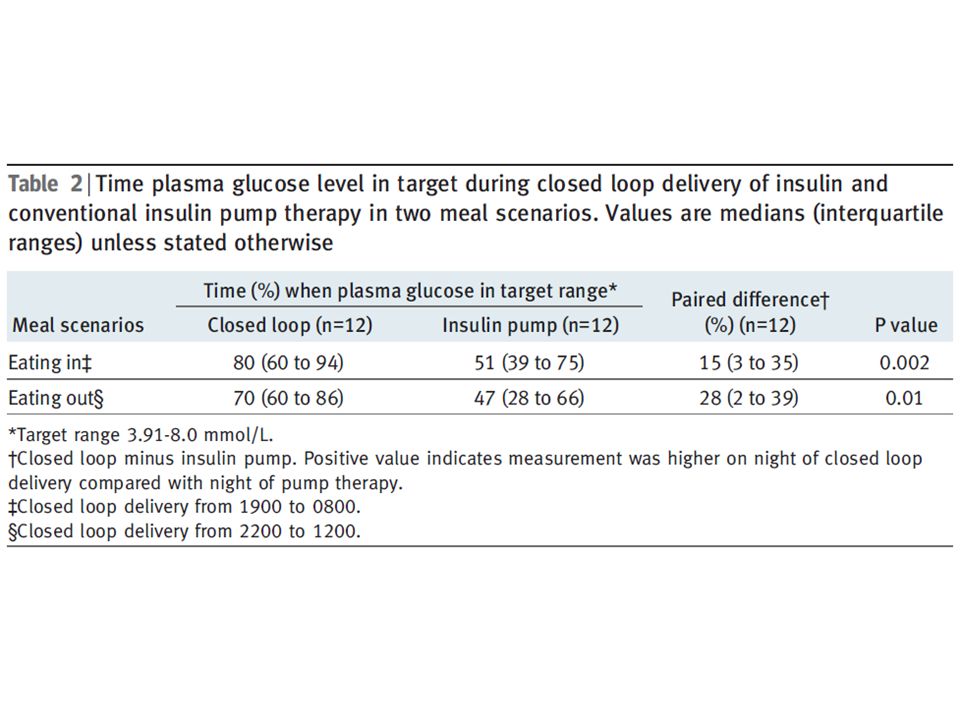
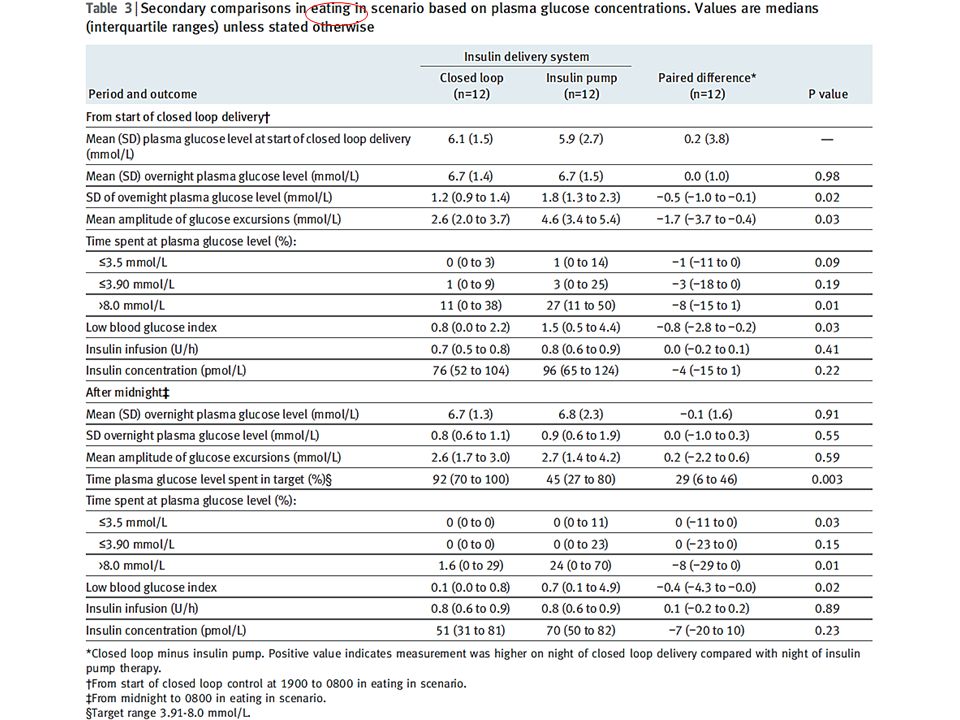
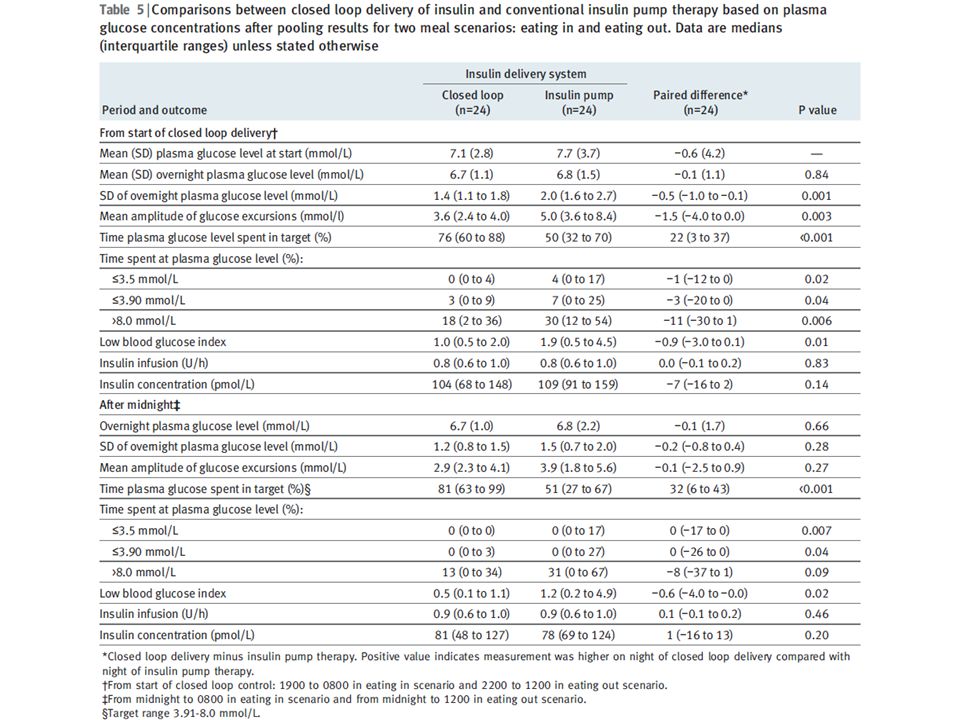
Results For the eating in scenario, overnight closed loop delivery of insulin increased the time plasma glucose levels were in target by a median 15% (interquartile range 3-35%), P=0.002. For the eating out scenario, closed loop delivery increased the time plasma glucose levels were in target by a median 28% (2-39%), P=0.01. Analysis of pooled data showed that the overall time plasma glucose was in target increased by a median 22% (3- 37%) with closed loop delivery (P<0.001). Closed loop delivery reduced overnight time spent hypoglycaemic (plasma glucose ≤3.9 mmol/L) by a median 3% (0-20%), P=0.04, and eliminated plasma glucose concentrations below 3.0 mmol/L after midnight.
, P=0.01. Analysis of pooled data showed that the overall time plasma glucose was in target increased by a median 22% (3- 37%) with closed loop delivery (P<0.001). Closed loop delivery reduced overnight time spent hypoglycaemic (plasma glucose ≤3.9 mmol/L) by a median 3% (0-20%), P=0.04, and eliminated plasma glucose concentrations below 3.0 mmol/L after midnight..")
35
Conclusion These two small crossover trials suggest that closed loop delivery of insulin may improve overnight control of glucose levels and reduce the risk of nocturnal hypoglycaemia in adults with type 1 diabetes. Trial registration ClinicalTrials.gov NCT00910767 and NCT00944619.

36
Message/Comments 1 型糖尿病患者 24 人を対象に、夜間のクローズ ドループ制御によるインスリン注入(人工膵 臓)の安全性、有効性を無作為化比較クロス オーバー試験で検討。従来のインスリンポンプ 群に比べ、クローズドループ制御群で、全時間 血漿グルコース濃度が目標値( 3.91- 8.0mmol/L )内にあった時間の 22 %(中央 値)増加が見られた。 小児や思春期の対象者のデータは1年前に Lancet に報告されたが今回は大人のデータ。 アルゴリズムが問題だが日本では...
の安全性、有効性を無作為化比較クロス オーバー試験で検討。従来のインスリンポンプ 群に比べ、クローズドループ制御群で、全時間 血漿グルコース濃度が目標値( mmol/L )内にあった時間の 22 %(中央 値)増加が見られた。 小児や思春期の対象者のデータは1年前に Lancet に報告されたが今回は大人のデータ。 アルゴリズムが問題だが日本では...")
Similar presentations


 ( 独 ) 農業・食品産業技術総合研究機 構 東北農業研究センター 菅野洋光.>")


 を、出現から消滅まで 全天 X 線監視装置 MAXI (マキシ)で観測したところ、 新種のブラックホール新星であることが判明した。 従来のブラックホールを、 多量のガスを一気に飲み込む「肉食系」と.>")


を体験したことにより興味を惹かれ るきっかけとなった。主な目的は、これ.>")


>")
