Download presentation
Presentation is loading. Please wait.

1
SCI 256 – People, Science and the Environment Environmental Science Week 1 - Environmental Science, The Scientific Method, and Environmentalism, Human Populations

2
Tips on the Power Point Presentations… The Yellow normal text (or yellow, not orange titles) are concepts that are MOST important and are the material that is quizzable/testable. The presentations (especially those online) are a compilation of previous courses I have taught and are TOO long and detailed for a 4 week lecture run. I will edit (skip by quickly) things that are TOO deep (and will edit those slides out when I next teach. I’m still reducing!)
 are a compilation of previous courses I have taught and are TOO long and detailed for a 4 week lecture run. I will edit (skip by quickly) things that are TOO deep (and will edit those slides out when I next teach. I’m still reducing!).")
3
What a science course is… Not as much discussion as you are used to. A lot more PRESENTATION You need input at some point to be able to discuss concepts… Concepts are encapsulated in terminology. Learning the terms is very important.

4
Terminology Make flash cards Quiz yourself Come up with memory tricks (I’ll supply the ones I’ve heard of or the ones in the textbook).
.")
5
More expectations We’ll stick very very closely with the textbook You will be able to go from text to class to (hopefully) the final quiz with everything being reinforced
 the final quiz with everything being reinforced")
6
Repeated Exposure You will hear the same concepts over and over from different directions. Multiple exposures= hopefully better retention. The repeated points: – Sources and sinks (pollution) of resources – Energy and the ‘cycling’ resources – What are the major climate issues in the news and why? – Who decides what and how to fix problems? – Cost/Risk Assessment – in all parts of life Ask questions!
 of resources – Energy and the ‘cycling’ resources – What are the major climate issues in the news and why. – Who decides what and how to fix problems. – Cost/Risk Assessment – in all parts of life Ask questions!.")
7
Today Environmental Science The Scientific Method (your pre-class paper) The Development of Environmentalism Population of the Earth (humans
 The Development of Environmentalism Population of the Earth (humans")
8
Chapter 1 Our Environment – changes? Really?

9
Environmental Science Don’t be intimidated by the term… we’ll break it down It is a mixture of many disciplines…which means you only need to get the basics of a wide range of concepts…you can’t (at this stage) dig into the deeper material. Everything in this section will be repeated and expanded upon in the next 3 weeks.

10
Breaking it down… Biology/ecology, geography, chemistry, geology, physics, economics, sociology/demography, cultural anthropology, natural resources management, agriculture, engineering, law, politics, and ethics. Sounds broad enough? Sounds fun?

11
We’ll be concerned with… Human populations Natural resources Pollution – natural and human in origin – air – water – soil

12
Goals…and the problem… We need to try to find out how the world really works. Scientific knowledge is needed, and needs to be reliable, repeatable, complete. Political decisions often need to be made before science has had time to repeat observations enough for them to become reliable and complete.

13
Issues. Which issues are real? Which issues are the most serious? Which issues can be addressed? What will it cost civilization and the global resource pool to address issues? Is it always ‘gloom and doom’?

14
The extremes On a scale of 1 – 10 how do you feel? (Use any # 1 thru 10) 1: Most if not all the environmental issues brought before the public are extreme, save-the-earth, tree-hugging motivated attacks on our capitalistic economy. 5: Some environmental issues are wrongly ignored by the population while some environmental issues are over emphasized by the media and policy makers. 10: Environmental issues are routinely ignored and downplayed by capitalistic interests and attention to corporate profits.
 1: Most if not all the environmental issues brought before the public are extreme, save-the-earth, tree-hugging motivated attacks on our capitalistic economy. 5: Some environmental issues are wrongly ignored by the population while some environmental issues are over emphasized by the media and policy makers. 10: Environmental issues are routinely ignored and downplayed by capitalistic interests and attention to corporate profits..")
15
We’ll look at each issue and look for signs of over or under- play in public awareness Personal observation – some issues are taken beyond the middle ground to overcome societal inertia – There is a need to bend the metal too far the other way to get it to relax to the correct position – We’ll see if this hypothesis holds true.

16
Environmental Sustainability A BIG term in environmental science “It’s the ability to meet humanity’s current needs without compromising the ability of future generations to meet their needs.” Using resources and earth systems without overusing and/or damaging them.

17
Environmental Sustainability details 1. Our actions effect the health and well-being of the natural environment including living things. 2. Earth’s resources are not in infinite supply – some regenerate (water, wood) - some don’t (coal, oil, metals) 3. Products we consume always have a cost to the environment associated with them 4. Everybody needs to play a part for environmental sustainability to be practiced successfully.
 - some don’t (coal, oil, metals) 3. Products we consume always have a cost to the environment associated with them 4. Everybody needs to play a part for environmental sustainability to be practiced successfully..")
18
Are we operating with sustainability? Many scientists think we are not: – we use nonrenewable resources for fuel (oil, coal) – we use renewal resources faster than they can be replenished – we put out more toxins (a broad word!) than the environment can absorb/break down in many places. – the number of humans on the planet continues to increase rapidly
 – we use renewal resources faster than they can be replenished – we put out more toxins (a broad word!) than the environment can absorb/break down in many places. – the number of humans on the planet continues to increase rapidly.")
19
So why not reduce the consumption and growth? Who does it and how much? How do you enforce it? Who has the right to dictate the changes and policies? Society, ecology and economics all matter!

20
Things need to grow and develop: Sustainable Development 1992 U.N. Conference on Environment and Development

21
The components: Goal: Improve the living conditions of all humans while creating environmental sustainability. 1. Environmentally Sound Decisions 2. Economically Viable Decisions 3. Socially Equitable Decisions QUITE a balancing act! (we’ll see the result of this process as the weeks go by)
.")
22
Our Impact so far

26
What just one family can do!

27
Population is on the rise 1800 = 1 billion world wide 1930 = 2 billion 1960 = 3 billion 1975 = 4 billion 1987 = 5 billion 2000 = 6 billion 2005 = 6.45 billion 2007 = 6.7 billion

28
Poverty High population numbers and poor management of resources leads to poverty. Defined by the world bank as incomes less than $1/day (one measure of poverty) Approx. 1.2 billion live at this level Approx. 2.8 billion are unable to meet basic needs of shelter, food, clothing, education and health. Approx. 828 million consume than 80% of the recommended daily caloric intake
 Approx. 1.2 billion live at this level Approx. 2.8 billion are unable to meet basic needs of shelter, food, clothing, education and health. Approx. 828 million consume than 80% of the recommended daily caloric intake.")
29
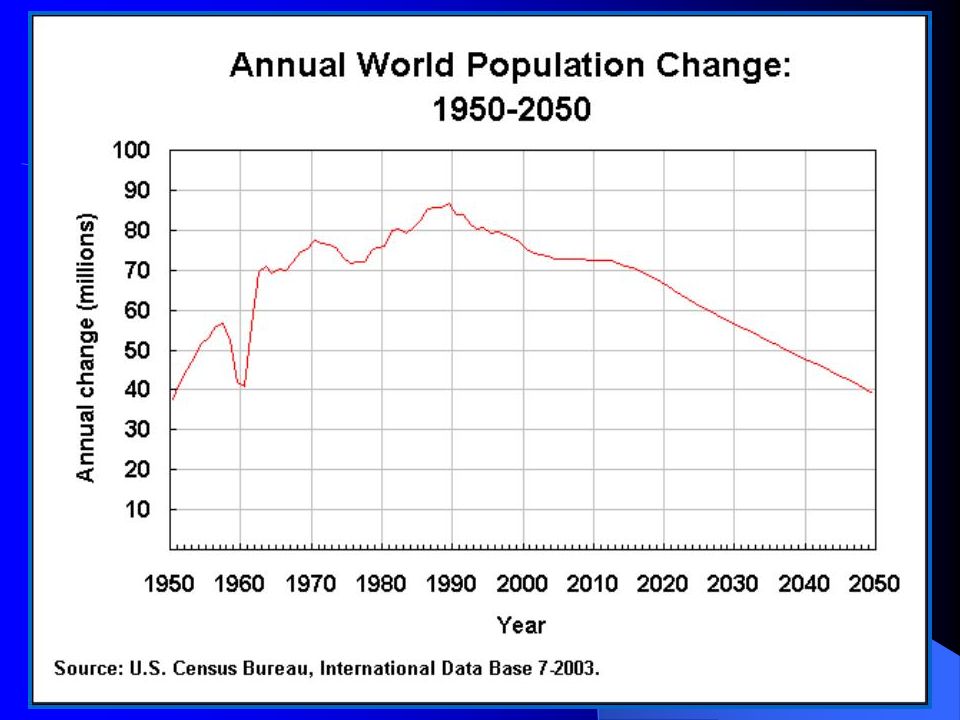
Flattening out of populations? We may see it level off by the end of the 21 st century at about 7.9 to 10.9 billion.

30
Consumption – another measure of population + resources The US consumes more per person (capita) than people in developing countries do. (We also produce more that is sold and distributed world wide more per capita than any country in the world). But this means more concentrated energy, resource use and waste/pollution here than elsewhere.
. But this means more concentrated energy, resource use and waste/pollution here than elsewhere..")
31
Your first look at pollution and a theorized result… (how it might come home to us) Pollution: Any alteration of the physical environment that harms the health or survival of any living organisms. Endocrine Disrupters – There is growing evidence that the direct impact of many chemicals released to the environment from manufacturing and agriculture change the operation of the human endocrine system. – PCB’s and dioxins (chlorine containing chemicals), heavy metals like lead, mercury and pesticides like DDT, kepone, dieldrine, chordane, and endosulfan + some plastic additives like phthalates can all cause our bodies to change chemically (in a broad sense)
, heavy metals like lead, mercury and pesticides like DDT, kepone, dieldrine, chordane, and endosulfan + some plastic additives like phthalates can all cause our bodies to change chemically (in a broad sense).")
32
Stuff inside – and critical thinking. The CDC (center for disease control) in 2001 reported elevated levels of 28 different such chemicals/elements in a sample of the civilian U.S. population BUT 24 of the 28 chemicals had NOT been tested before… they might be naturally picked up from the environment and stored in the body. The best you can say is we have a baseline now…we don’t know if those have actually increased.
 in 2001 reported elevated levels of 28 different such chemicals/elements in a sample of the civilian U.S. population BUT 24 of the 28 chemicals had NOT been tested before… they might be naturally picked up from the environment and stored in the body. The best you can say is we have a baseline now…we don’t know if those have actually increased..")
33
The concern… Endocrine Disrupters change hormone levels in humans. SO reproductive development in males and females of various species including humans may be effected. For example, DDT in Lake Apopka in Florida in 1980 was followed by male alligators having lower testosterone levels Some cancers are hormonally reactive, so cancer rates may change/increase. 60 studies since 1938 report sperm counts from approx. 15,000 men. Over time, the counts have decreased 50% from 1940 – 1990.

34
More terms: When two or more pollutants’ effects add as you expect when you mix them, they are called simply additive. When two or more pollutants react in a way that causes a stronger hormone change than either would do alone, we call that synergism. (usually bad) If the result is less than either alone, then it is called antagonism. (usually good) This hypothesis was not widely accepted until the 1990’s. Environmental problems can arise from surprising combinations of ‘harmless’ chemicals. Even though a chemical is thought safe, it may not be in every situation.
 If the result is less than either alone, then it is called antagonism. (usually good) This hypothesis was not widely accepted until the 1990’s. Environmental problems can arise from surprising combinations of ‘harmless’ chemicals. Even though a chemical is thought safe, it may not be in every situation..")
35
An example: Georges Bank Fishery 1994 the U.S. Commerce Department closed two portions of Georges Bank a large section of ocean off the New England coast Fish populations had plummeted.

36
Restocking and management Reopened but controlled Aug 2004

37
Lessons from Georges Banks More efficient fishing = more impact on the system Subsidizing in situations like this can harm the environment (encouraged technological improvements over fishing) Managed systems CAN bounce back somewhat (in some situations – more on this later).
 Managed systems CAN bounce back somewhat (in some situations – more on this later).")
38
Another example – Bird populations. Evidence suggests a 2 decade decrease in bird populations across North America – esp. songbirds in forests, shrublands, and grasslands. – most migrate to the tropics in the winter Possibility: Forest fragmentation an increase of stressful forest edge. Our actions change the long term balance species have adapted to.

39
Wolves howling in Yellowstone In 1995-1996, grey wolves were re-introduced to Yellowstone Park under the 1973 Endangered Species Act (ESA) Present numbers = 300+ (later numbers – 174 in park, almost 800 in entire area). Ranged from Northern Mexico to Greenland, but were killed off; hunting, poison etc. Only a few in Minnesota remained. Elk overpopulated/overgrazed. 1000’s starved and died yearly. There WAS a big fight to prevent the reintroduction, but populations of other species are better now (small animals, prey birds etc.)
.")
40
Invasive Species… What examples have you heard of?

41
Invasion of the habitat snatchers Cargo-carrying ocean vessels carry approximately 79 million tons of ballast water containing foreign clams, mussels, worms, small fish, crabs and microscopic aquatic organisms. The jellyfish-like organism called a comb jelly hit the Black Sea. With much food and no natural predators, it underwent explosive growth. Fishing industries have been almost eliminated due to the die-off of native fish populations.

42
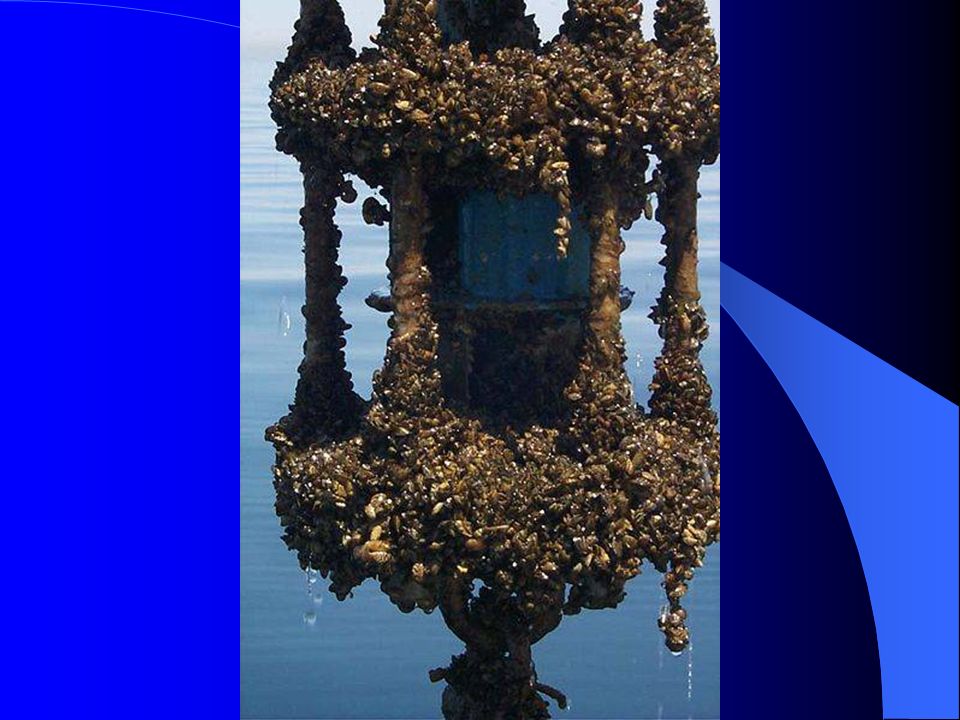
Here at home: The Zebra mussel from the Caspian Sea hit the Great Lakes in the mid 1980’s. It clusters on all objects in the water (buoys, boats, and water intake systems). Now has invaded the Mississippi River Costs the US about $5 billion to control and in economic losses
. Now has invaded the Mississippi River Costs the US about $5 billion to control and in economic losses.")
44
Other examples? Rabbits in Australia (then foxes, then the myxomatosis virus – 90% initially, 75% now)
.")
45
And… Kudzu in the Southern US (1876) Mosquitoes with West Nile virus – eastern US – 1999, 46 states in 2003 Wild/feral cats Weeds: (bermuda grass) in the desert southwest (Georgia in the 1800, spread west during the Gold Rush – 1850’s) http://invasives.fws.gov/index5A.html
 Mosquitoes with West Nile virus – eastern US – 1999, 46 states in 2003 Wild/feral cats Weeds: (bermuda grass) in the desert southwest (Georgia in the 1800, spread west during the Gold Rush – 1850’s)")
47
Overview Time… We’ll spend more time repeating these BIG issues in the next 3 weeks. (I’m repeating that I’ll be repeating.)
.")
48
Onto higher topics… Ozone Stratospheric Ozone – Found in a layer of the atmosphere from 6.2-28 miles up – Formed by ultraviolet rays from the sun breaking down O 2 (diatomic oxygen – what you breath) – Shields us, likewise, from this UV light Protection from sunburns, skin cancer, plant mutations
 – Shields us, likewise, from this UV light Protection from sunburns, skin cancer, plant mutations")
49
The hole truth Thinning NOT a hole Hypnotized to be caused by chlorofluorocarbons (CFC’s) First observed in 1985 over Antarctica Happens Sept/Oct every year – Spring in the southern hemisphere 1990 amounts of ozone were 50% lower than 1980 amounts. 1992 some thinning observed over the Arctic

50
The culprit CFC’s = a chlorine source a catalyst Noclilucent clouds Colder temperatures up there From Global Warming? (more heat near the earth surface, less aloft) 1987 – 160 countries cut back on CFC production/use. CFC’s can last (a catalyst is not consumed) for 120 years+ More on this later.
 1987 – 160 countries cut back on CFC production/use. CFC’s can last (a catalyst is not consumed) for 120 years+ More on this later..")
51
CO 2 and Global Climate Warming A hot topic. (sorry) More like a thermal blanket than a greenhouse (The Thermal Blanket Effect would be a better name, but Greenhouse stuck). The atmosphere is transparent to visible light (so we can see stars and the sun) It is NOT as transparent to infrared light – the way the earth cools itself. CO 2 would look like a haze if you ‘saw’ with infrared eyes.
 More like a thermal blanket than a greenhouse (The Thermal Blanket Effect would be a better name, but Greenhouse stuck). The atmosphere is transparent to visible light (so we can see stars and the sun) It is NOT as transparent to infrared light – the way the earth cools itself. CO 2 would look like a haze if you ‘saw’ with infrared eyes..")
52
Warming up So the theory is that more CO 2 = more infrared that SHOULD go to space stays down near the earth’s surface. We warm up down here.

53
Sources- it matters! Burning forests/grasses = releases CO 2 BUT growing trees/leaves/grass consume CO 2 – NOT a source of greenhouse warming Oil/coal = LONG TERM carbon storage – it’s CO 2 that hasn’t been up here in a LONG time This means a new balance needs to be set…

54
The famous carbon graph

55
Back in time…

56
The Rest of the story- back in time Now--- with error bars… you can SEE the uncertainty now.

57
And back and back…

58
Benefits?Problems? New places things can grow – northern Asia and N. America (more agriculture in southern Canada for example) More disease and drought resistant plant life planet wide Tropical diseases spread pole ward. Sea level rise (NOT melting, but expanding) Changes in rainfall patterns and extreme temperature.
 More disease and drought resistant plant life planet wide Tropical diseases spread pole ward. Sea level rise (NOT melting, but expanding) Changes in rainfall patterns and extreme temperature..")
59
Bits of evidence… The 80’s, 90’s and early 2000’s saw the warmest years in weather records (which are only a century or so long) Estimated warming hovers around 1.4 deg C to 5.8 deg C (2.5-10.4 deg F) by 2100. The Earth has been warmer (ice free) in the distant past.
 in the distant past..")
60
Our reaction to CO 2 increases? Kyoto Protocol in 1997 (US not signed) – called for a 5.2% CO 2 decrease by 2012 2001 the U.N. Intergovernmental Panel on Climate Change (IPCC) – declared most of the observed warming is man- caused Solar energy output increase?
 – called for a 5.2% CO 2 decrease by the U.N. Intergovernmental Panel on Climate Change (IPCC) – declared most of the observed warming is man- caused Solar energy output increase .")
61
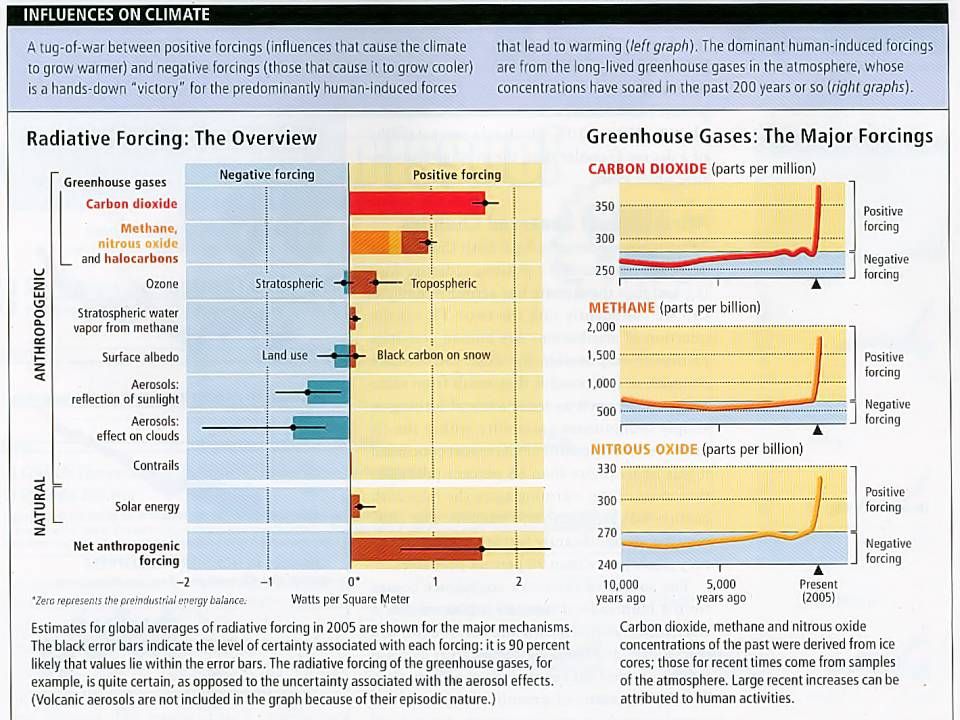
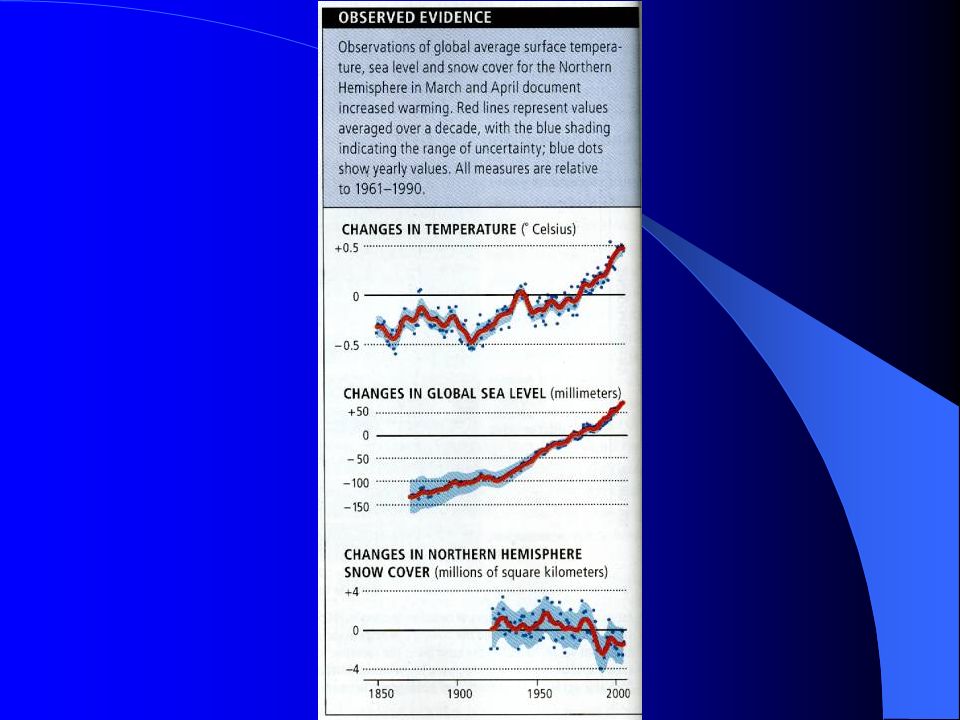
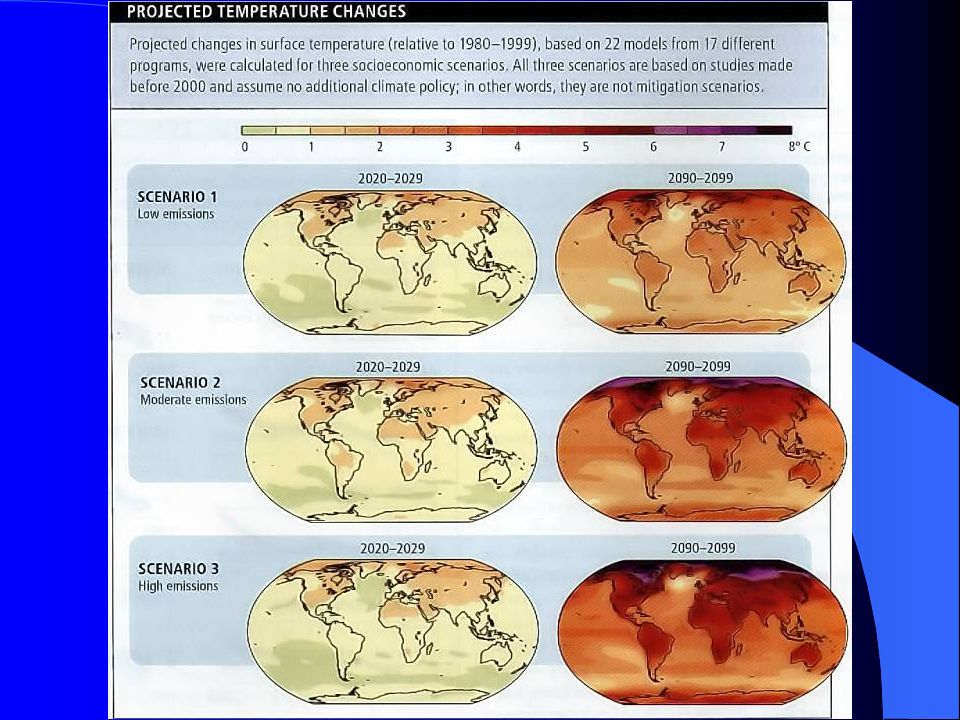
Newest Info – Sci. America Aug 2007 Answering the question: How much of the climate change is human caused and how much is natural?

66
Another issue: Deforestation Late 1990’s, Brazil lost on average about 5 million acres a year to clear cutting. Consequences? – Loss of animal/plant/microbe/biome diversity – Song bird summer places

67
What’s happening Slash-and-burn agriculture: forest is cut down, allowed to dry, and burned for cropland. – Short term release of nutrients, then land us unusable. Forest watersheds release water too quickly – flooding, erosion CO 2 sink is destroyed (remember the short term cycle, not the long term sink)
.")
68
Losses beyond the obvious Bio-prospecting someday? – DNA and chemicals Ecotourism someday? Unforeseen consequences? – Albedo of the planet – Moisture sources/transport

69
Definitions… Ethics vs. Values?

70
Ethics, Values and Worldviews and how they mix with Environmental Problems Ethics: a branch of philosophy that is derived through the logical application of human values Values are the principles that an individual or society considers important or worthwhile. Societal values do shift over time.

71
Values can collide Different societies, groups and individuals can have different values. Ethics help us determine which form of conduct are morally acceptable or unacceptable – right or wrong. When values collide, ethics help us determine which course is the best to follow.

72
Environmental Ethics A set of applied ethics that surround the moral basis of environmental responsibility and how far it extends. What role do humans play in – resource use – species preservation How do we balance political, economic, societal, and individual needs/desires?

73
Worldviews We all have our own. You might share many aspects of your worldview with your family, friends, church groups, but your view is going to be individual. Do you know the extent of your worldview? Have you identified what aspects of your worldview you arrive at and what aspects you adopted from those around you? Your right/wrong choices come from this…good thing to work on!

74
Environmental Worldviews Individuals have one as well as societies and nations. The traditional western world worldview: is called the ‘expansionist worldview’ – conquer, expand and exploit nature. – The 18 th century frontier attitude is included in this extreme. – Resource management must benefit human society.

75
The other extreme view The deep ecology worldview is a body of views dating back to 1970 and Arne Ness (philosopher) and Bill Devall (ecologist) and George Sessions (philosopher). – Human and non-human life on Earth has intrinsic value. – Richness and diversity of life forms are values in themselves. – Humans have no right to reduce richness and diversity. – Present human interference with the non-human world is excessive and worsening.

76
cont. – Human and non-human life needs fewer people to flourish – Policies need to change to bring this about – economic, technological and ideological structures need to change. – A good standard of living needs to be needed over a high standard of living by all – Those who believe in the above need to participate in making it so.

77
You You probably lie somewhere between those two extreme world views. If all 6 billion in the world lived as the best do, the planet could not supply resources fast enough, renew resources fast enough, or absorb waste fast enough to allow it. This class should give you more ammunition on figuring out where you are and where you want to be.

78
Value of the Environment What do we use it for? (Or should we use it?) Utilitarian Justification – the value of the environment is based on how it can be used Ecological Justification – it is necessary for the survival of things valuable to us Aesthetic Justification – it is valuable because it is beautiful Moral Justification – elements of the environment have a right to exist – period.
 Utilitarian Justification – the value of the environment is based on how it can be used Ecological Justification – it is necessary for the survival of things valuable to us Aesthetic Justification – it is valuable because it is beautiful Moral Justification – elements of the environment have a right to exist – period..")
79
Chapter 2 What Science can do for you!

80
What has science done for you…lately? Is it just a body of knowledge? It is, but it is also a process… a way to think…a way to approach a problem. Science wants to reduce complexity to general principles that can make predictions, solve problem, or provide new insights.

81
Science We collect data (plural, singular is datum). Data is collected via observations/experimentations. Faith, emotion, intuition, funding, etc. should NOT enter into the process. The data collection must be repeatable. – COLD FUSION - example

82
She blinded me with… It’s a PROCESS. Rarely is a TRUTH finally found – See GRAVITY as an example.

83
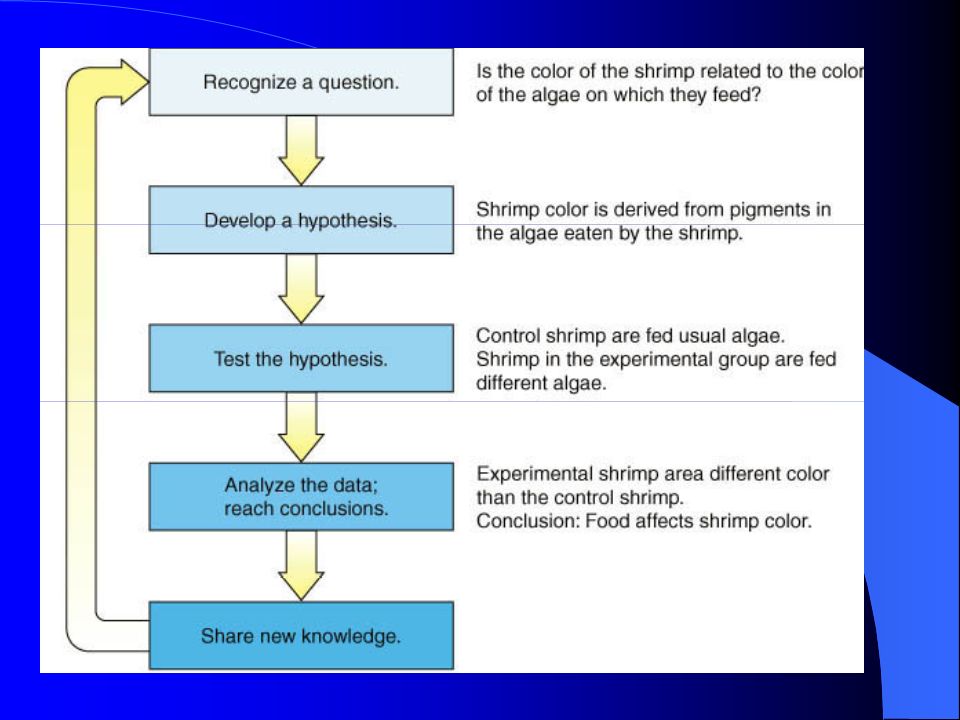
THE Scientific Method (Bubble bursting moment… this is an ideal and RARELY can be fully implemented) 1. Recognize a question or unexplained phenomena in the world. Find out what is already know. 2. Develop a hypothesis – or an educated guess to explain it. A good hypothesis makes a prediction that can be investigated. 3. Design an experiment that tests the hypothesis. Note: you are not proving your hypothesis, you are disproving it. Others can come up with alternate (and better?) hypotheses.
 hypotheses..")
84
The method cont. 4. Analyze and interpret the data to reach a conclusion; is the hypothesis correct so far? Does it need to be rewritten or scrapped? 5. Share the knowledge with the world via writing, speaking, demonstrating etc.

86
The reason to reason Inductive and Deductive Reasoning – We use both – Inductive Reasoning: Discovering general principles by the careful examination of specific cases (organized data). You start with facts and draw a conclusion… (Textbook) : Gold is a metal heaver than water, Iron is a metal heavier than water, Silver is a metal heaver than water. All metals are heavier than water. Error… Lithium is ½ the density and would float.
 : Gold is a metal heaver than water, Iron is a metal heavier than water, Silver is a metal heaver than water. All metals are heavier than water. Error… Lithium is ½ the density and would float..")
87
Reason… – Deductive Reasoning: You start with generalities and and proceed to specifics. – Doesn’t add to knowledge, but can make connections in understanding – (Textbook) : General rule: All birds have wings. Specific example: Robins are birds. Conclusion: All robins have wings.
 : General rule: All birds have wings. Specific example: Robins are birds. Conclusion: All robins have wings..")
88
What about… Clouds are white Snow is white Water foam is white Result: Clouds are made of water ?

89
The answer… Yep, inductive, but the argument is shaky! Why not include sugar in packets, marshmallows, white chocolate and conclude clouds are made of sugar or are cotton candy?

90
Prediction We only want to come up with hypotheses that make predictions or they are useless. Deductive reasoning helps us determine which experiments or observations will help us test our hypothesis.

91
In the lab… experiments To run a good test, you need to isolate the variables that will change based on the hypothesis Clouds are made of water… what comes out of clouds could be observed = a variable.

92
Good experiments need control When possible, you need a group where you don’t change the variables to see what happens when you don’t measure. Maybe putting rain gauges under clouds makes they cry and only then does water come out.

93
It’s theoretical A theory is an integrated explanation of numerous hypotheses. A theory condenses and simplifies many data that seemed unrelated. Remember the uncertainty is never completely gone. A theory can suffer when more observations are made and some or all take exception with the theory. Back to the drawing board. (The theory of gravity again).
..")
94
Scientific Decision Making in light of this uncertainty Assessment of Risks One of the most important survival strategies in our world! Risk is the probability of harm Risk Assessment is measuring the odds that harm will result when a decision is made. See table 2.1 pg 26 (Risk of death in common activities)
.")
95
4 step program 1. Hazard identification 2. Dose-response assessment (of 1) 3. Exposure assessment (of 1) 4. Risk characterization (2+3)
 4. Risk characterization (2+3).")
96
So what do we do with environmental pollutants – run? All chemicals are toxic in high enough doses (salt, sugar!) The study of toxicants is called toxicology. Levels: – Acute toxicity: dizziness, nausea, or death – Chronic toxicity: damage to vital organs usually following long-term exposure Factors: – Dose – Response
 The study of toxicants is called toxicology. Levels: – Acute toxicity: dizziness, nausea, or death – Chronic toxicity: damage to vital organs usually following long-term exposure Factors: – Dose – Response.")
97
Lethal Weapon A lethal dose is hard to determine except where homicides and accidents have happened. Gruesome. Lab animals can be used If 50% have a response (physical change or death) you get the LD 50 (50% of the animals die at this level) or the ED 50 (50% of the animals show a biological response – the effective dose)
 you get the LD 50 (50% of the animals die at this level) or the ED 50 (50% of the animals show a biological response – the effective dose).")
98
Animal house Using animals, we can get the Effective Dose curve of a chemical or medicine and get an idea of human response.

99
Threshold The minimum amount of toxicant or chemical that creates a response is called the threshold amount.

100
Children and toxicants Because the weigh less than adults, they are more susceptible to toxicant effects, they have a lower threshold and ED 50 and LD 50

101
What causes cancer? Everything? Lab animals are often fed massive doses of a suspected carcinogen because research would take years otherwise (for more ‘normal’ doses to produce cancer). It is assumed that being that far above the ED 50 can be extrapolated on a chart like those above to human thresholds. Our bodies CAN break down small doses of almost any carcinogen. But when does it overwhelm us?
. It is assumed that being that far above the ED 50 can be extrapolated on a chart like those above to human thresholds. Our bodies CAN break down small doses of almost any carcinogen. But when does it overwhelm us .")
102
Rick Assessment of Chemical Mixtures We take in a wide range of compounds daily via air, water and food. There are too many chemicals and mixtures of chemicals in the world to all be tested. Remember additive, synergistic, and antagonistic effects? We assume unknown mixtures are usually additive – which CAN underestimate or overestimate the real effects of a given chemical when ingested.

103
Risk assessment example… Irradiated food? Genetically modified food? Vaccines?

104
The Precautionary Principle “An ounce of prevention is worth a pound of cure” CFC’s and ozone Puts the burden of responsibility on the makers of new products / chemicals

105
Ecological risk assessment How do you assess health of the environment? Humans are easy! Environmental Stressors – human-induced changes that tax the environment Changes CAN be beneficial or detrimental. Our understanding is still very incomplete

106
Cost-Benefit Analysis of Risks comes to the rescue Without it, what gets the most publicity gets the attention by politicians. ** The estimated cost is compared with potential benefits to determine how much expense society is willing to incur to derive the benefits**

107
Reality Check Many stories of environmental hazards and toxins are more hype than reality. Everything involves some risk… Saying you want‘zero’ risk is…well…dumb

108
Putting it all together… 1. The problem is defined. 2. Using scientific investigations analyze the potential effects of intervention. 3. Public awareness/education is critical in a democracy 4. A course of action is chosen: Economic and social considerations may overshadow scientific evidence. 5. The results of the actions should be analyzed… did it work? Start over?

109
Creativity and Critical Thinking Creativity in science, as in other areas of knowledge, has to do with original thoughts (those never stated before). Many people have the ability to be creative, but in science it helps to be intensely curious about how something in nature works. Sometimes creativity comes as an inspiration or sudden idea—such as the possible answer to an old question.

110
Science and Technology They are not the same! Technology can dictate/limit how science can measure something. Science can discover new processes that lead to technological developments - They play off each other, but are not the same thing.

111
Science and Objectivity Scientists – in reality – DO have opinions, hopes, and desired outcomes. – “Climate Gate” – Genetic engineering – Nuclear power – Endangered Species High standards of evidence – and a self checking community are needed!

112
Vs. Pseudo Science and Frontier Science The Media often mixes these realms up…not helping us communicate!

113
An example: Lake Washington Seattle grew toward this deep fresh water lake. Lake Washington became increasingly stressed by environmental changes (recreational use as well as waste disposal) 1950 a mass of Oscillatoria – a filamentous cyanobacterium was found growing in the lake 1955 the first alarm was sounded about the pollution feeding the Oscillatoria Eutrophication began – oxygen was consumed to the lake depths killing fish and all other life needing dissolved oxygen.
 1950 a mass of Oscillatoria – a filamentous cyanobacterium was found growing in the lake 1955 the first alarm was sounded about the pollution feeding the Oscillatoria Eutrophication began – oxygen was consumed to the lake depths killing fish and all other life needing dissolved oxygen..")
114
Lake troubles cont. Scientific Assessment- a 1933 study of the microscopic life gave a baseline to compare to the 1950’s levels. Making a Model – Edmondson created a simple mathematical model of the lake and predicted that 5 years would be needed to restore the lake if pollution was stopped. Risk Analysis: How much treatment was feasible, where else could sewage be dumped? The Puget Sound is a salt water environment already rich in nutrients.

115
The final steps Public Education and Involvement: 1955- local sanitation authorities were not convinced of the problem. 1956- Edmonson wrote a letter to a mayoral committee about the problem 1957- A public hearing was conducted 1958- Referendum to change sewage dumping was defeated Later in 1958 a revised bill was passed 1961- Groundbreaking was conducted on the new project.

116
Evaluation Water transparency returned within a few years Oscillatoria persisted until 1970 By 1975 the lake was back to it’s pre-sewage dumping state.

117
Chapter 3 Environmental History, Legislation and Economics No Names/Dates need be memorized for the quizzes/test.

118
We report, you define Define: Conservation VS. Preservation and “Resources”

119
Conservation and Preservation of Resources Quick definitions: – Resources are any part of the natural environment (air, water, soil, forests, minerals, fuel, and wildlife) – Conservation – the sensible (not too much or too little) and careful management of natural resources – Preservation – the setting aside and protection of natural resources
 – Conservation – the sensible (not too much or too little) and careful management of natural resources – Preservation – the setting aside and protection of natural resources")
120
Environmental History of the US 1607, Jamestown, Virginia – colonists began to use/consume land, timber, wildlife, rich soil and clean water. 1700’s and 1800’s the frontier attitude reigned The great forests of the Northeast were leveled within a few generations. Deforestation began in the Midwest right after the Civil War in the 1860’s. By 1897 the sawmills of Michigan alone had processed 160 billion board feet of white pine leaving only 6 billion unused.

121
The first voices Naturalists spoke out by the end of the 1800’s. – John James Audubon (of bird fame) – Henry David Thoreau (Walden Pond) – George Perkins Marsh (“Man and Nature”) – The American Forestry Association – 1875 – The General Revision Act – 1891 – gave the president authority to establish forest reserves on public (federally owned) land.
 – Henry David Thoreau (Walden Pond) – George Perkins Marsh ( Man and Nature ) – The American Forestry Association – 1875 – The General Revision Act – 1891 – gave the president authority to establish forest reserves on public (federally owned) land..")
122
President Precedent Benjamin Harrison Grover Cleveland & Theodore Roosevelt Those three used this law to put 17.4 million hectares (43 million acres) of primarily Western land out of reach to loggers.
 of primarily Western land out of reach to loggers.")
123
Theodore Roosevelt Designated 21 new national forests 16 million acres But then signed the bill to end the creation of new national forests in 6 western states (after creating >16 million acres of national forest)! Gifford Pinchot was appointed by him to head the U.S. Forest Service

124
National Parks and Monuments The Yellowstone region of Montana became our first National Park in 1872 John Muir, who founded the Sierra Club – was a writer and naturalist… influenced the creation of Yosemite and Sequoia National Parks.

125
Another Roosevelt Franklin Roosevelt, during the Great Depression formed the Civilian Conservation Corps which employed >175,000 men – Planted trees – Made paths and roads – Built dams – + other conservation activities

126
Wildlife conservation Aldo Leopold – “Game Management” textbook in 1933 – Helped in the 1937 act which placed taxes on sporting weapons and ammunition that funded wildlife management and research

127
On to pollution and the 60’s Rachel Carson – 1960’s -wrote about interrelationships among living organisms (including humans) – “Silent Spring” in 1962 wrote about the harm pesticides do to the environment – The media, at this time, began to cover deaths in NY City due to pollution Paul Ehrlich – “The population bomb” warning against overpopulation (3.5 billion on the planet at the time)
 – Silent Spring in 1962 wrote about the harm pesticides do to the environment – The media, at this time, began to cover deaths in NY City due to pollution Paul Ehrlich – The population bomb warning against overpopulation (3.5 billion on the planet at the time)")
128
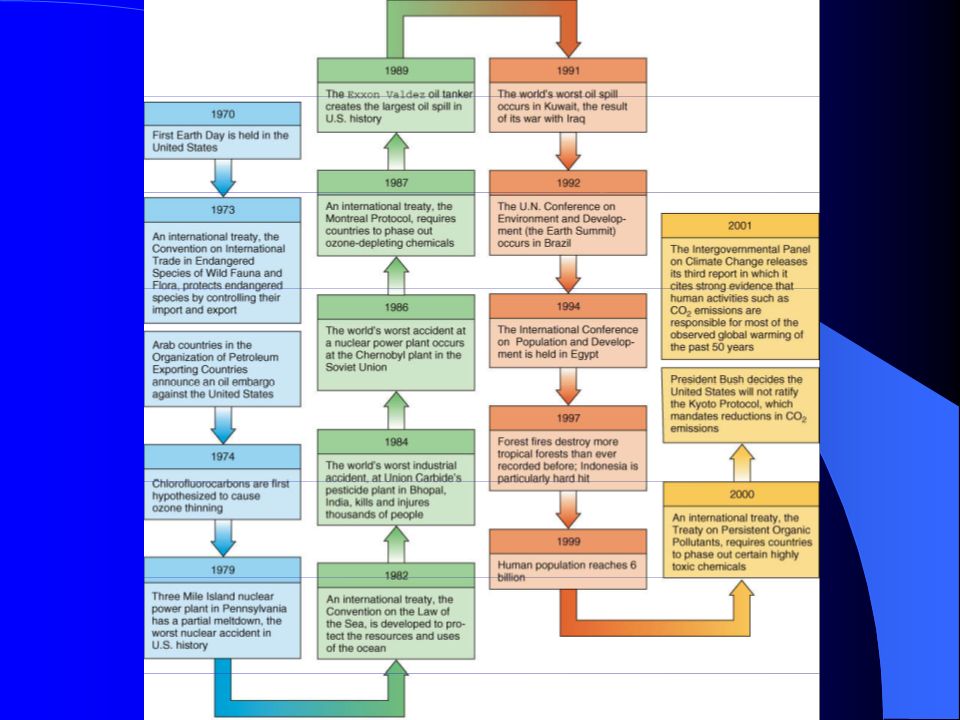
Enter the 70’s – dig it Environmentalists emerge and begin to influence US thinking via the Sierra Club and the National Wildlife Federation The first Earth Day organized in 1970 - estimated 20 million people publicly supported caring for our environment. By Earth Day 1990, it was much more of a global observance with an estimated 200 million people in 141 nations participating in observations large and small. (This is all part of the Public Awareness/Education step from last chapter)
.")
130
Enter the Government Big disasters like the 1969 oil spill of the Santa Barbara, CA coast (and later ones like the Exxon Valdese) harbored in legislation (pun intended) and support for Earth Day brought about the creation of the Environmental Protection Agency (EPA)
 harbored in legislation (pun intended) and support for Earth Day brought about the creation of the Environmental Protection Agency (EPA)")
131
Men in Black The National Environmental Policy Act (NEPA) was signed at that time states that the US government must consider the environmental impact of all projects it finances no matter where : – roads – dams – bridges etc.
 was signed at that time states that the US government must consider the environmental impact of all projects it finances no matter where : – roads – dams – bridges etc.")
132
Looking first The NEPA requires the EPA always develop detailed environmental impact statements (EISs) 1. What is the nature of the proposal and why is it needed? 2. What are the short (few years) and long term (decades) environmental effects of the project? 3. What alternatives exist that would lessen this impact of this project?
 and long term (decades) environmental effects of the project. 3. What alternatives exist that would lessen this impact of this project .")
133
NEPA top down Must solicit public comments when preparing an EIS Must report to the president via the Council on Environmental Quality. About 36 states have adopted similar legislation for state-funded projects.

134
More Government! According to the EPA, by the late 1990’s the cost of complying with the more than 40 major environmental laws in effect (and their requirements) totals to $210 billion per year – about 2.6% of the U.S. Gross Domestic Product Cost/Risk thinking at work! Page 49 lists the huge body of law now governing environmental issues.
 totals to $210 billion per year – about 2.6% of the U.S. Gross Domestic Product Cost/Risk thinking at work. Page 49 lists the huge body of law now governing environmental issues..")
135
Get the pitchforks Most of these laws allow private citizens to challenge those who violate them… called citizen suits. They responsible for much of the enforcement to date.

136
The science isn’t perfect and the laws aren’t perfect The Clean Air Act of 1977 required coal-burning power plants to be outfit with expensive scrubbers that removed sulfur dioxide. BUT allowed very tall smokestacks to go exempt Acid Rain resulted as many tall smokestacks were built and sulfur dioxide poured out. A 1990 amendment to the Clean Air Act helped close this loophole.

137
The success stories Eleven national parks have been established 104 million acres Millions of acres of farmland vulnerable to erosion have been taken out of production and allowed to stabilize (ground cover) Many endangered species (by 1970) are better off – American alligator, California grey whale, the bald eagle are all off the list now. Lead levels in the air have dropped 98% (no leaded gas) Hydrocarbon emissions from automobiles dropped to about half.
 Hydrocarbon emissions from automobiles dropped to about half..")
138
More success Emissions of sulfur dioxide, carbon monoxide, and soot have been reduced by 30% CFC use (and other ozone depleting gasses) are down 70% Industrial waste release down 43% Fewer rivers and streams are in violation of water quality standards (though PCB levels are still rising) The number of secondary bacteria destroying water treatment plants is up 72% since the 1990’s Many harmful pesticides and the like have been banned (DDT, asbestos, dioxins)
 are down 70% Industrial waste release down 43% Fewer rivers and streams are in violation of water quality standards (though PCB levels are still rising) The number of secondary bacteria destroying water treatment plants is up 72% since the 1990’s Many harmful pesticides and the like have been banned (DDT, asbestos, dioxins)")
139
Solving problems – the Lag!

140
Economics and the Environment Economics is the study of how people use their limited resources to satisfy unlimited wants. Everything is treated (as it is in scientific modeling) as Sources or Sinks
 as Sources or Sinks.")
141
The Earth as a Living System One thought is that the interrelated systems (we’ll study more later) are like the different systems that make up a single organism (circulatory system, nervous system, skeletal system etc.) The Gaia Hypothesis
 are like the different systems that make up a single organism (circulatory system, nervous system, skeletal system etc.) The Gaia Hypothesis")
142
Coming and Going A source is where material, resources, energy come from A sink is where all that goes Natural Capital is the Earth’s resources as they related to sources and sinks – you have to get rid of it before you can use more Resource degradation is the overuse of sources (running out of stuff) Pollution is the overuse of sinks.
 Pollution is the overuse of sinks.")
143
Reservoirs

144
National Income Amounts It is the total income of a nation in a year. Two components of it are the : Gross Domestic Product (GDP) – The total output The Net Domestic Product (NDP) – The total output MINUS resources used up Computer company example: – The value of computers made by company X contribute to the GDP – The value of computers MINUS the wear on equipment etc. NDP
 – The total output The Net Domestic Product (NDP) – The total output MINUS resources used up Computer company example: – The value of computers made by company X contribute to the GDP – The value of computers MINUS the wear on equipment etc. NDP.")
145
The NDP and GDP shortcomings Neither take into account the use of environmental sources or sinks EG: Oil removed from a field is not subtracted from the GDP in the NDP.

146
Cost and Benefits of Pollution Control A company can make $100 m of product and produce pollution A company can make $90 m of product and contain/eliminate the pollution Choice 1 is more appealing naturally. Right? Without NDP taking into account the $ loss inherit in source or sink use, companies will gravitate towards the first mode of operation

147
How economists view pollution The harm caused by pollution is called an external cost, or negative externality. The public ‘pays’ one way or another. Since the consumer in a free market system usually does NOT know what the external cost is, they do not buy with that in mind. This encourages more pollution practices.

148
How much is acceptable? Everything we do causes SOME pollution. And the Earth can break down SOME level of everything. How much though? Where do we want to be between “untouched wilderness” and a “sewer”?

149
In the margin The marginal cost of something is its additional cost when you make one more of ‘it’. The marginal cost of pollution is the added cost for all present and future members of society of an additional unit of pollution. Determining this cost is NOT EASY! (We are back to the uncertainty inherit in science).
..")
150
For example – the marginal cost of sulfur dioxide emission Sulfur dioxide comes from burning sulfur rich fuels. Sulfur dioxide combines with water in the atmosphere making sulfuric acid dissolved in the water. This harms plants, changes the acidity of rivers/steams/lakes – dissolves minerals in the soil that pollute waterways. One more ton of sulfur when levels are low won’t matter much – the environment can neutralize it. One more ton of sulfur when levels are high may cause a tremendous negative impact

151
Picturing the marginal cost of pollution

152
Taking Action – abating pollution costs! On the other hand there is the marginal cost of pollution abatement (which is the added cost for all present and future society members of reducing a given pollutant) When levels of the stuff are high, cutting down yields a great benefit When levels are very low of the stuff, the cost of cutting down is great, and little is achieved.
 When levels of the stuff are high, cutting down yields a great benefit When levels are very low of the stuff, the cost of cutting down is great, and little is achieved..")
153
Looking at the numbers

154
The balancing act – what we can stand for…

155
Actually putting REAL numbers to this is the hard part! Science to the rescue! (We hope.)
")
156
Flaws in this method 1. The true cost of environmental damage is hard to measure (science!) 2. The risk of unanticipated environmental catastrophe are not taken into account. See books like “The Sudden Global Superstorm” (aka “ the Day After”) or more serious journal articles on sudden climate change or run-away feedback effects.
 or more serious journal articles on sudden climate change or run-away feedback effects..")
157
Economic Strategies for Pollution Control (How do we make people take care of their toys?) Should we make people take care of their toys? (See the tragedy of the commons) In the US we use command and control regulation. Laws state that pollution must be controlled to a certain level or fines are imposed. – The $ will be spent on cleanup or fines. – Not everyone is caught…can be an invitation to gamble.
 In the US we use command and control regulation. Laws state that pollution must be controlled to a certain level or fines are imposed. – The $ will be spent on cleanup or fines. – Not everyone is caught…can be an invitation to gamble..")
158
Incentive (less force…for our libertarian friends) The preferred method is incentive-based regulation Emission targets are established and industries are given incentives to reduce to those levels. It is considered a market-oriented strategy because it seeks to use the economic forces of a free market to alleviate pollution

159
Another way – big in Europe The emission charge = a tax on pollution production A ‘Green Tax’ Many European countries have restructured their tax system to account for this. Hope: people will either reduce emission or consumption to save money Problems: Most taxes are set too low to influence purchasing and really take into account pollution ‘costs’. And people object to paying for something they perceive as free (just let it go into the air or stream…who cares?)
.")
160
A similar trick - permits The government sets a cap on pollution to an ‘acceptable’ level and breaks that into measurable units – or credits. These are called marketable waste- discharge permits Which give Emission Reduction Credits (ERC’s)
.")
161
Like trading cards These credits can be bought and sold…companies that pollute more than others can buy the rights to permit from them and not harm their industry/production as much. If a company moves to a new city, it needs to buy emission reduction credits from existing companies that have cut their emissions The clean air act of 1990 included this mechanism to cut sulfur dioxide emissions.

162
Populations Chapter 4

164
Factors Affecting Population Numbers

165
Locally…

166
Biotic Potential The Biotic Potential is the maximum rate at which a population could increase under ideal conditions. Different species have different biotic potentials. Different species have different biotic potentials..

167
Biotic Potential of Bacteria

168
Biotic Potential of Flies

169
Biotic Potential of Humans?

170
Exponential Growth Think of exponential growth in terms of making money. How much you increase your earnings will depend on: 1.How much principle you have (population size) 2.The interest rate at which you are earning money (the biotic potential)
 2.The interest rate at which you are earning money (the biotic potential).")
171
Reproduction changes with age - proportion of individuals in each reproductive class can have a large effect on population growth. Expanding: Population momentum: when young make large proportion of the population, potential for rapid increase in natality when young reach reproductive age. ‘Bottom heavy’ Stable: stationary phase. Mortality such that each class goes to the next class at the size the next class was at. The population is at replacement numbers for births. Diminishing: natality has fallen below replacement numbers. ‘Top heavy’.

172
HUMAN POPULATION 2000 years ago 300 million people 200 years ago under a billion people 40 years ago 3 billion people 2000 6 billion people Now, the population is growing by almost 78 million more people each year. Two possible causes: Life expectancy (age at mortality) Fertility
 Fertility.")
173
Mortality and death rates: The primary cause of population growth has been declining mortality. In the last 100 years, average life expectancy has risen by about 25 years - due to modern medicine, better food, and better sanitation (environment changed).
..")
174
Humans by Era Average Lifespan at Birth (years) Upper Paleolithic33 Neolithic20 Bronze Age and Iron Age 35+ Classical Greece28 Classical Rome28 Pre-Columbian North America 25-30 Medieval Islamic Caliphate 35+ Medieval Britain30 Early Modern Britain40+ Early 20th Century30-45 Current world average (2010) 67.2
 Upper Paleolithic33 Neolithic20 Bronze Age and Iron Age 35+ Classical Greece28 Classical Rome28 Pre-Columbian North America Medieval Islamic Caliphate 35+ Medieval Britain30 Early Modern Britain40+ Early 20th Century30-45 Current world average (2010) 67.2")
175
Declining Mortality

176
Population USA Year 2000

177
Population USA Year 2025

178
Population USA Year 2050

179
Comparison Population USA 2000 with 2050 20002050 Pre-repro Reproductive Post-repro

180
Population Conclusion By changing technology (health care/education) we have changed the carrying capacity for the earth?
 we have changed the carrying capacity for the earth")
181
Economics and Life Expectancy Although life expectancy is predicted well by annual per capita income, the correlation is good only up to per capita income, the correlation is good only up to about $4000. about $4000.

182
EMPOWER WOMEN? What would this mean for some societies? Fertility Rates and Female Literacy Fertility Rates and Birth control (linked to literacy?)
.")
183
Cultural Norms Religious Beliefs

184
Overpopulation

186
Issues to Be Considered Population Growth – fertility rates, social and cultural roles, government roles Economic problems – debt, hunger and starvation Available resources – renewable (time frames), non- renewable Consumption – expectations, reality Urbanization – trends, benefits, problems
, non- renewable Consumption – expectations, reality Urbanization – trends, benefits, problems")
187
How Do You Transition from One Type of Population Dynamic to Another?

188
Demographic Transitions How does an expanding population become a stable population? In a stable population, both the birth rates and the death rates are high. If the death rate decreases because of better food/medical/sanitation procedures, the population grows. With technological development the birth rate drops (female education? investment in offspring?) In mature high technology society the birth rates and death rates are low - also producing a stable population.
 In mature high technology society the birth rates and death rates are low - also producing a stable population..")
189
Demographic Transitions

190
Estimates of Most Populous Countries in 2025 Ratio* = 2025:1950

191
Examples of Fertility Rates

192
Regional Population Distribution for People Under Age 15

193
Fertility Rates USA

194
The Demographics of Life USA Source www.populationconnection.org/Communications/demfacts. PDF World 284.5 millionPopulation, Mid 20106.7 billion 77Population per square mile118 15Births per 1,000 people22 9Deaths per 1,000 people9 2.1Total fertility rate2.8 21% of pop under age 1530 13% of pop over age 657

195
The Demographics of Life USAWorld 49Births per 1,000 women aged 15-19 50 7.1Infant deaths per 1,000 live births 56 $29,240GNP per capita (PPP)$6,300 995 kCalAvg daily per capita calories from animal products 441 kCal 66Grains fed to livestock as % total grain consumption 3
$6, kCalAvg daily per capita calories from animal products 441 kCal 66Grains fed to livestock as % total grain consumption 3")
196
The Demographics of Life USAWorld 19,674 kgAnnual per capita carbon emissions 4,157 kg 5% energy consumption from renewable sources 14 1% female labor force in agriculture 52 4% male labor force in agriculture 46 1,484Tractor per 1,000 agricultural workers 20

197
NamePopulation 1. Cordova, Spain450,000 2. Kaifeng, China400,000 3. Constantinople (Istanbul), Turkey300,000 4. Angkor, Cambodia200,000 5. Kyoto, Japan175,000 6. Cairo, Egypt135,000 7. Baghdad, Iraq125,000 8. Nishapur (Neyshabur), Iran125,000 9. Al-Hasa, Saudi Arabia110,000 10. Patan (Anhilwara), India100,000 Top 10 Cities of the Year 1000
, Turkey300, Angkor, Cambodia200, Kyoto, Japan175, Cairo, Egypt135, Baghdad, Iraq125, Nishapur (Neyshabur), Iran125, Al-Hasa, Saudi Arabia110, Patan (Anhilwara), India100,000 Top 10 Cities of the Year")
198
Estimates of Most Populous Countries in 2025 Ratio* = 2025:1950

199
NamePopulation 1. New York, United States12,463,000 2. London, United Kingdom 8,860,000 3. Tokyo, Japan 7,000,000 4. Paris, France 5,900,000 5. Shanghai, China 5,406,000 6. Moscow, Russia 5,100,000 7. Buenos Aires, Argentina 5,000,000 8. Chicago, United States 4,906,000 9. Essen, Germany 4,900,000 10. Calcutta, India 4,800,000 Top 10 Cities of the Year 1950

200
NamePopulation 1. Tokyo, Japan 28,000,000 2. Mexico City, Mexico18,100,000 3. Bombay, India18,000,000 4. Sao Paulo, Brazil17,700,000 5. New York, United States 16, 600,000 6. Shanghai, China 14,200,000 7. Lagos, Nigeria 13,500,000 8. Los Angeles, United State 13,100,000 9. Calcutta, India12,900,000 10. Buenos Aires, Argentina 12,400,000 Top 10 Cities of the Year 2000

201
Current population growth of the world

202
How to achieve demographic transition? Family planning in Thailand - example of success Annual population growth dropped from 3.3% in 1972 to 1.2% in 1995. Mechai Viravaidya, founder of Community- Based Family Planning Service (CBFPS). Focused on wants and needs of poor.Annual population growth dropped from 3.3% in 1972 to 1.2% in 1995. Mechai Viravaidya, founder of Community- Based Family Planning Service (CBFPS). Focused on wants and needs of poor.
. Focused on wants and needs of poor.Annual population growth dropped from 3.3% in 1972 to 1.2% in Mechai Viravaidya, founder of Community- Based Family Planning Service (CBFPS). Focused on wants and needs of poor..")
203
How did Thailand Accomplish Transition? CelebrityCelebrity Humor/break taboos of contraceptionHumor/break taboos of contraception Condom give-a-waysCondom give-a-ways Financial incentivesFinancial incentives Reduced infant mortality due to infectious diseases - clean water supplyReduced infant mortality due to infectious diseases - clean water supply Altered desired number of children (from 8 to 3)Altered desired number of children (from 8 to 3)
Altered desired number of children (from 8 to 3).")
204
Contrast Thailand with China In China, population control is a political outcome Women must receive “birth coupons” prior to conception Mass murders of girl babies Abortions (even at 9 months gestation) Women of reproductive age examined and monitored
 Women of reproductive age examined and monitored")
206
World Population While demographic transition is occurring in many places, the world population keeps increasing at a rate of about 1.5% to 2% per year. So the doubling rate is between 35 and 46 years!

207
Population Growth - Optimistic Growing prosperity will reduce desire for large families. Technology/communication will spread information faster, making transition more rapid than it occurred for more developed countries. Fertility rates are dropping and populations are stabilizing (except in Africa).
..")
208
Population Growth - Pessimistic Demographic trap: poorer countries will not become developed enough for birth rate to be reduced, causing population growth rates to remain high. Local catastrophe will be the only regulatory control.

209
World Population Growth What will this mean for the planet? Will we alter the human carrying capacity by our impact? What can we do to help stabilize the world’s population? What should we do?

210
Consumption Comparisons One quarter of the global population living in developed countries consumes for 80% of the world’s total energy. USA alone accounts for 6% of the global population, but consumes 30% of its resources. 20% of the global population consumes 70% of its material resources and possesses 80% of the wealth. The majority of this 20% in centered in Canada, USA, Saudi Arabia, Australia, and Japan.

211
Consumption Comparisons A child born today in the United States will by the age of 75 years produce 52 tons of garbage, consume 10 million gallons of water and use 5 times the energy of a child born in the developing world. The United States uses approximately one quarter of the world's fossil fuels and is the largest contributor of carbon dioxide, undesirable combustion products, and chlorofluorocarbons, chemicals that contribute to greenhouse warming and attack the Earth's ozone shield.

212
Consumption Comparisons Increasing the fuel mileage of cars by just 3 mpg would save the same amount of oil that could be tapped from the Arctic National Wildlife Refuge over 10 years. Every 20 minutes, the world adds another 3,500 human lives but loses one or more entire species of animal or plant life - at least 27,000 species per year. Population is growing faster than food supplies in 64 of 105 developing countries. Overcultivation, primarily due to population pressures, has degraded some 2 billion hectares of arable land - an area the size of Canada and the United States combined

213
Globally, the demand for fresh water exceeds the supply by 17 percent already. Two-thirds of the world's population will experience some form of a severe water shortage in the next 25 years. By 2025, when world population is projected to reach 8 billion, 48 countries with a total population of 3 billion will face chronic water shortages. In 25 years, humankind could be using over 90 percent of all available freshwater, leaving just 10 percent for the rest of the world's plants and animals. Consumption Comparisons

214
What is the Carry Capacity of the Planet for Humans? Paul Erlich – Population Bomb, 1968 – predicted 2 billion. Now at 6 billion. Julian Simon – there is no problem, more people means more potential technology solutions. Some estimate 20 billion will be maximum (at this rate, in your lifetime!!!) Solution = balance of population controls and consumption controls.
 Solution = balance of population controls and consumption controls..")
215
We’ll jump to next chapter here… NEXT TIME: Natural Ecosystems Population Dynamics Pollution/Pests

Similar presentations


 affect the physical and chemical cycles and.>")


 McGraw Hill Ryerson 2007 11.2 Human Activity and Climate Change Climate change is the change in long-term weather patterns in certain regions. These.>")
