Download presentation
Presentation is loading. Please wait.

1
Ch 20 Sustainable Energy

2
2 Ch 20 Outline 20.1 Conservation –Cogeneration 20.2 Tapping Solar Energy –Passive vs. Active 20.3 High Temperature Solar Energy –Photovoltaic Cells 20.4 Fuel Cells 20.5 Energy From Biomass 20.6 Energy From Earth’s Forces

3
3 Conservation Utilization Efficiencies –Today’s average new home uses half the fuel required in a house built in 1974. –Reducing air infiltration is usually the most effective way of saving household energy. –According to new national standards: –New washing machines will have to use 35% less water. –Will U.S. cut water use by 40 trillion liters annually and save enough electricity every year to light all the homes in the U.S.?

4
4 Utilization Efficiencies For even greater savings, new houses can be built with extra thick superinsulated walls, air-to-air heat exchangers, and double-walled sections. –Straw-bale construction –Home orientation so have passive solar gains in winter and shade from trees in summer –Turn off appliances on standby - TV, printer, computer

5
5 Standby Energy Consumption

6
6 Energy Conversion Efficiencies Energy Efficiency is a measure of energy produced compared to energy consumed. –Thermal conversion machines such as steam turbines can turn no more than 40% of energy in primary fuel into electricity or mechanical power due to waste heat. –We could be recapturing the heat and using it for space heating –Fuel cells can theoretically approach 80% efficiency using hydrogen or methane.

7
7 Energy Conversion Efficiencies Transportation –Raising average fuel efficiency in U.S. by 3 miles per gallon would save more oil than the maximum expected production from drilling in Arctic Wildlife Refuge. –There are now more vehicles in the U.S. than there are licensed drivers. –In the 1970s, when oil prices rose, U.S. doubled auto gas mileages. Reached 25.9 mpg in 1988 but now down to 22.1 mpg.

8
8 Energy Conversion Efficiencies Transportation –For short trips, could walk or bicycle –Could buy high efficiency mini car that gets 60 mpg like the one shown in photo –Could buy hybrid gasoline electric car

9
9 Transportation Efficiencies Could buy plug in hybrid car which recharges batteries from household current at night –Electricity costs the equivalent of 50 cents per gallon –Need to generate more electricity but could capture pollutants at the plant Could buy diesel. A diesel sold in Europe currently gets 150 mpg.A diesel sold in Europe currently gets 150 mpg A diesel plug in hybrid could make the U.S. entirely independent from imported oil.

10
10 Transportation Efficiencies Fuel-cell powered vehicles are being developed which use hydrogen gas as fuel. –Produce water as their only waste product –Will take at least twenty years to come to market –Most hydrogen is currently created from natural gas, making it no cleaner or more efficient than burning the gas directly. –Governments in U.S. and Europe are spending billions on this.

11
11 Cogeneration Cogeneration - simultaneous production of both electricity and steam, or hot water, in the same plant –Increases net energy yield from 30-35% to 80-90%. –In 1900, half of electricity generated in U.S. came from plants also providing industrial steam or district heating. –By 1970’s cogeneration had fallen to less than 5% of power supplies.

12
12 Cogeneration Interest is being renewed –District heating systems are being rejuvenated. –Plants that burn municipal waste are being studied. –Combined cycle coal gasification plants may be used in urban locations. –Apartment building-sized power generating units are being built that use methane, diesel or coal.

13
13 Tapping Solar Energy A Vast Resource –Average amount of solar energy arriving on top of the atmosphere is 1,330 watts per square meter –Amount reaching the earth’s surface is 10,000 times more than all commercial energy used annually –Until recently, this energy source has been too diffuse and low intensity to capitalize for electricity.

14
14 Solar Energy Passive Solar Heat - using absorptive structures with no moving parts to gather and hold heat –Greenhouse Design

15
15 Active Solar Heat - pump heat-absorbing medium through a collector, rather than passively collecting heat in a stationary object –Water heating consumes 15% of U.S. domestic energy budget. A flat panel of 5 m 2 can provide hot water for family of 4.

16
16 High Temperature Solar Energy Parabolic mirrors are curved reflective surfaces that collect light and focus it onto a concentrated point. Two techniques: –Long curved mirrors focused on a central tube containing a heat-absorbing fluid. –Small mirrors arranged in concentric rings around a tall central tower track the sun and focus light on a heat absorber on top of the tower where molten salt is heated to drive a steam-turbine electric generator.

17
17 Parabolic Mirrors

18
18

19
19 Solar Energy Only solar power tower in U.S. is in Southern California. It generates enough electricity for 5,000 homes at cost far below oil or nuclear power. –If entire U.S. used solar towers, it would take up an area half the size of South Dakota (but less land than will be strip mined in next 30 years to get coal). Parabolic mirrors or solar box cookers can also be used for home cooking in tropical countries.
. Parabolic mirrors or solar box cookers can also be used for home cooking in tropical countries..")
20
20 Solar Cooker An inexpensive insulated box with a black interior and a clear plastic lid can serve as a solar cooker. Helps reduce deforestation and avoids health risks from smoky cooking fires in tropical countries.

21
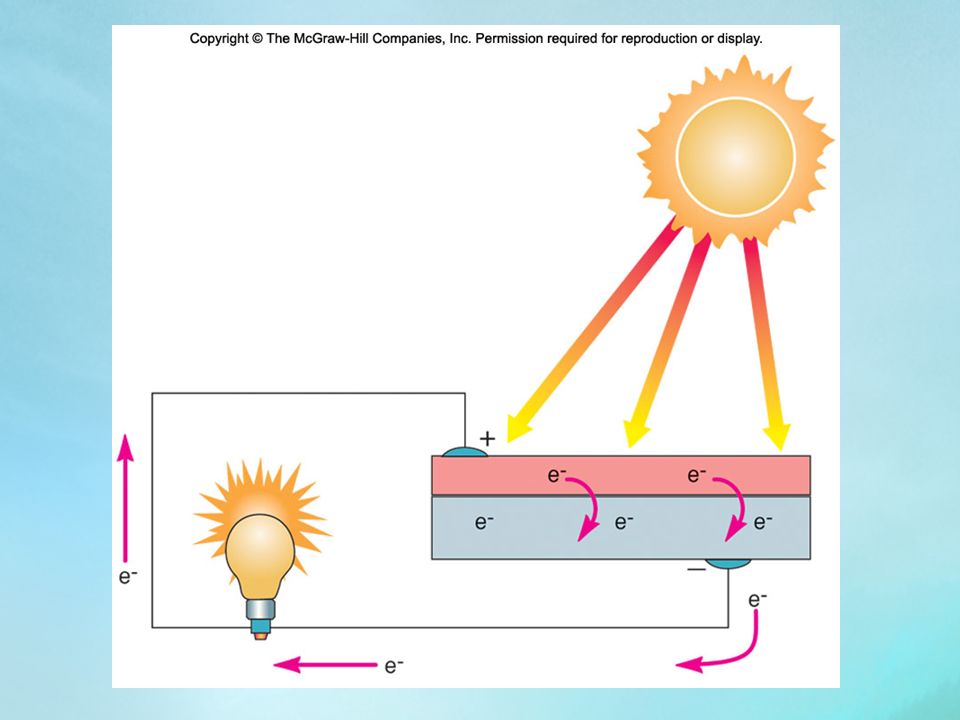
21 Photovoltaic Solar Energy Photovoltaic cells capture solar energy and convert it directly to electrical current by separating electrons from parent atoms and accelerating them across a one-way electrostatic barrier. –Bell Laboratories - 1954 –1958 - $2,000 / watt –1970 - $100 / watt –2007 - $2.50 / watt –2009 - $1.00 / watt

23
23 Photovoltaic Cells During the past 25 years, efficiency of energy capture by photovoltaic cells has increased from less than 1% of light to more than 15% in field conditions and over 75% in the laboratory. –Invention of amorphous silicon collectors has allowed production of lightweight, cheaper cells. –Roof tiles with photovoltaic cells can generate enough electricity for a home. At least 2 billion people now live without electricity. This could be a solution to their problems.

24
24 Storing Electrical Energy Electrical energy storage is difficult and expensive. –Lead-acid batteries are heavy (3-4 tons) and have low energy density. –Metal-gas batteries are inexpensive and have high energy densities, but short lives. –Alkali-metal batteries have high storage capacity, but are more expensive. –Lithium batteries have very long lives, and store large amounts of energy, but are very expensive.
 and have low energy density. –Metal-gas batteries are inexpensive and have high energy densities, but short lives. –Alkali-metal batteries have high storage capacity, but are more expensive. –Lithium batteries have very long lives, and store large amounts of energy, but are very expensive..")
25
25 Fuel Cells Fuel Cells - use ongoing electrochemical reactions to produce electric current. –Cathode (+) and anode (-) separated by electrolyte which allows ions to pass, but is impermeable to electrons –Hydrogen passed over anode where a catalyst strips an electron –Electrons pass through external circuit, and generate electrical current. –Hydrogen ion passes to cathode where it is united with oxygen to form water.
 and anode (-) separated by electrolyte which allows ions to pass, but is impermeable to electrons –Hydrogen passed over anode where a catalyst strips an electron –Electrons pass through external circuit, and generate electrical current. –Hydrogen ion passes to cathode where it is united with oxygen to form water..")
26
26 Fuel Cell

27
27 Fuel Cells Fuel cells provide direct-current electricity as long as supplied with hydrogen and oxygen. –Hydrogen can be supplied as pure gas, or a reformer can be used to strip hydrogen from other fuels. Oxygen comes from air. –Fuel cells run on pure oxygen and hydrogen, and produce no waste products except drinkable water and radiant heat.

28
28 Fuel Cells Typical fuel cell efficiency is 40-45%. Current is proportional to the size of the electrodes, while voltage is limited (1.23 volts/cell). –Fuel cells can be stacked until the desired power level is achieved. A fuel cell stack that could provide all the electricity for a home would be about the size of a refrigerator.
. –Fuel cells can be stacked until the desired power level is achieved. A fuel cell stack that could provide all the electricity for a home would be about the size of a refrigerator..")
29
29 Energy from Biomass Plants capture about 0.1% of all solar energy that reaches the earth’s surface. –About half the energy used in metabolism. –Useful biomass production estimated at 15 - 20 times the amount currently obtained from all commercial energy sources. –Biomass resources include wood, wood chips, bark, leaves and starchy roots.

30
30 Burning Biomass Wood provides less than 1% of U.S. energy, but provides up to 95% in poorer countries. –1,500 million cubic meters of fuelwood collected in the world annually –Inefficient burning of wood produces smoke laden with fine ash and soot and hazardous amounts of carbon monoxide. –Clean burning woodstoves are available but expensive, produces fewer sulfur gases than coal.

31
31 Fuelwood Crisis About 40% of world population depends on firewood and charcoal as their primary energy source –Of these, three-quarters do not have an adequate supply. –Gathering wood is work of women and children and in some places it now takes 8 hours to get to supply and even longer to walk back with wood that will last only a few days.

32
32 Fuelwood Crisis In cities, people must pay high prices for wood, as much as 25% of household income. By 2025, if current trends continue, the demand is expected to be twice current harvest rates while supply will stay steady. In some African nations, demand is already ten times the sustainable yield.

33
33 Dung Where other fuel is in short supply, people often dry and burn animal dung. –Downside: not returning animal dung to land as fertilizer reduces crop production and food supplies.

34
34 Methane Methane is main component of natural gas. –Produced by anaerobic decomposition –Burning methane produced from manure provides more heat than burning dung itself, and left-over sludge from bacterial digestion is a nutrient-rich fertilizer. –Methane is clean, efficient fuel –Municipal landfills contribute as much as 20% of annual output of methane to the atmosphere. This could be burned for electricity.

35
35 Anaerobic Production of Methane

36
36 Methane Cattle feedlots and chicken farms are a tremendous potential fuel source since wastes contain more energy than all the nation’s farmers use. –Haubenschild dairy farm uses manure to generate all their electricity. In January 2001, the farm saved 35 tons of coal, 1,200 gallons of propane, and made $4,380 selling electricity.

37
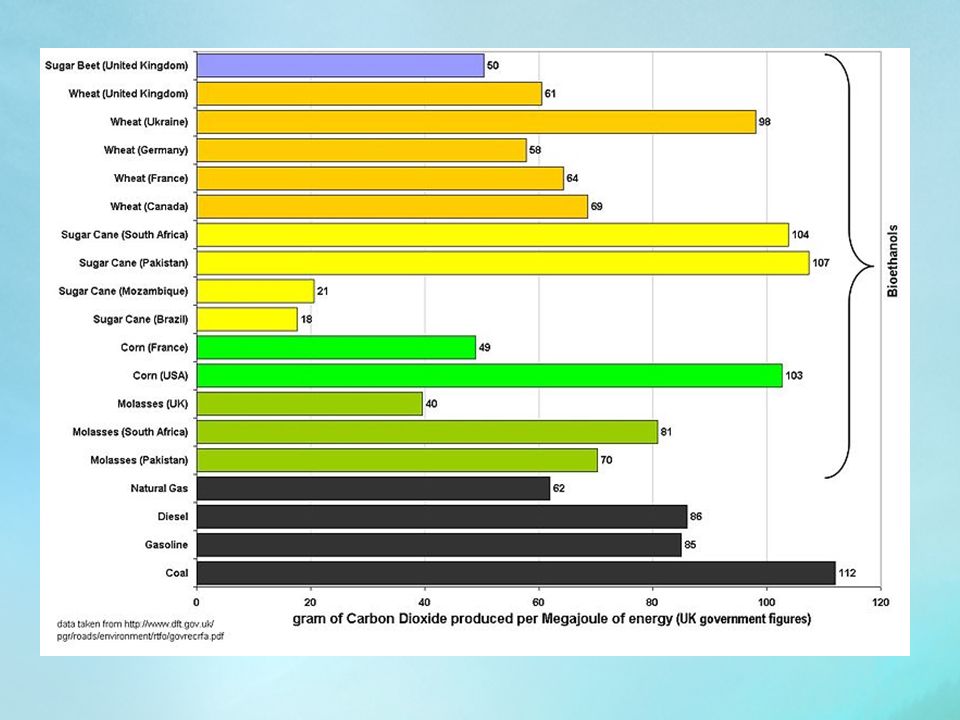
37 Alcohol from Biomass Ethanol or methanol made from plant materials or diesel made from vegetable oils or animal fats Gasohol - mixture of gasoline and ethanol –Ethanol in gasohol makes gasoline burn cleaner and most states require that 5% to 10% be added to gasoline. –Most ethanol now made from grain but can be made from any cellulosic material such as wood chips or straw.

39
39 Alcohol from Biomass Brazil is world’s leader in alcohol from biomass, mostly sugarcane waste. Ethanol production growing rapidly in the U.S. but use of corn for fuel has increased corn prices by 50%. Since corn is used as animal feed, meat, milk and egg prices have risen. U.S. has 5 million flex fuel vehicles now Increasing fuel economy by 12% would reduce oil consumption just as much as use of ethanol and save $10 billion in subsidies.

40
40 Alcohol from Biomass Energy crops - such as switch grass, cattails and hybrid poplars could be grown on marginal lands specifically as energy source. –Low-input high-diversity fuels - mix of native prairie perennial species which grow well in dry, low nitrogen conditions and which could be harvested for fuel

41
41 Fuel from Biomass Water is a worry when using ethanol as a biofuel. –It takes 3 to 6 liters of water to produce a liter of ethanol and in many of plains states there is not enough water to produce both food and fuel. Biodiesel can be made from almost anything organic such as fat from meat or vegetable oil. European Union already consumes 1 billion gallons of biodiesel.

42
42 Energy from Earth’s Forces Hydropower –In 1925, falling water generated 40% of world’s electric power. –Hydroelectric production capacity has grown 15-fold but fossil fuel use has risen so rapidly that hydroelectric only supplies 20% of electrical generation. –Untapped potential for hydropower in Latin and Central America, Africa, India and China

43
43

44
44 Dams Much of hydropower in recent years has been from enormous dams –Human Displacement –Ecosystem Destruction –Wildlife Losses –Large-Scale Flooding due to Dam Failures –Sedimentation –Herbicide Contamination –Evaporative Losses –Nutrient Flow Retardation

45
45 Dams –Rotting of submerged vegetation kills fish, acidifies water, produces greenhouse gases –Schistosomiasis - human disease caused by parasitic fluke that lives in snails, which like the slow moving water behind dams –Indigenous peoples lose their lands

46
46 Dam Alternatives Low-Head Hydropower - extract energy from small headwater dams Run-of-River Flow - submerged directly in stream and usually do not require dam or diversion structure Micro-Hydro Generators - small versions designed to supply power to single homes –Government subsidies for small scale hydropower resulted in abuse of water resources e.g. diverting small streams

47
47 Wind Energy Estimated 80 million MW of wind power could be commercially tapped worldwide. –Five times total current global electrical generating capacity –Typically operate at 35% efficiency under field conditions –When conditions are favorable, electric prices typically run as low as 3 cents / kWh.

48
48 Wind Power no fuel costs or emissions generates income for farmers who rent land for turbines or sell electricity BUT intermittent source not enough wind everywhere bird mortality power lines needed to transmit the electricity

49
49 Wind Resources in the U.S.

50
50 Geothermal Energy Geothermal Energy - tap energy from hot springs, geysers Few places have geothermal steam, but can use Earth’s warmth everywhere by pumping water through buried pipes using heat pumps Deep wells for community geothermal systems are being developed. Heat from Earth’s crust is never exhausted

51
51 Geothermal Energy

52
52 Tidal and Wave Energy Ocean tides and waves contain enormous amounts of energy that can be harnessed. –Tidal Station - tide flows through turbines, creating electricity –Requires a high tide/low-tide differential of several meters –Pelamis wave power generator - snakelike machine points into waves and undulates up and down, which pumps fluid to hydraulic motors that drive electrical generators. Cables carry power to shore.

53
53 The world's first commercial-scale and grid-connected tidal stream generator – SeaGen – in Strangford Lough. [8] The strong wake shows the power in the tidal currentStrangford Lough [8]wake

54
54 Pelamis Wave Converter

55
55 Ocean Thermal Electric Conversion Heat from sun-warmed upper ocean layers is used to evaporate a working fluid, such as ammonia, which has a low boiling point. –Gas pressure spins electrical turbines. –Cold water is then pumped from the depths to condense the ammonia again. –Need temperature differential of about 20 o C between warm upper layers and cooling water.

56
56 Ideal Scenario for World Energy Consumption 2100

Similar presentations


 or to cause a change. Wind has energy to move these wind turbines.>")


 Production – Use the sun’s energy to heat water or air Either stored or used immediately – Photovoltaic cells are used.>")


