Download presentation
Presentation is loading. Please wait.

1
Measuring for Impact Peter Levesque Institute for Knowledge Mobilization October 30, 2013 800-266-1832 | www.ktddr.org Copyright ©2013 by SEDL. All rights reserved. Funded by NIDRR, US Department of Education, PR# H133A120012. No part of this presentation may be reproduced or transmitted in any form or by any means, electronic or mechanical, including photocopy, recording, or any information storage and retrieval system, without permission in writing from SEDL (4700 Mueller Blvd., Austin, TX 78723), or by submitting an online copyright request form at www.sedl.org/about/copyright_request.html. Users may need to secure additional permissions from copyright holders whose work SEDL included after obtaining permission as noted to reproduce or adapt for this presentation.
, or by submitting an online copyright request form at Users may need to secure additional permissions from copyright holders whose work SEDL included after obtaining permission as noted to reproduce or adapt for this presentation..")
2
"When a measure becomes a target, it ceases to be a good measure.” - Goodhart's law 2

3
3 New Yorker: Sam Gross 1991

4
How are we measuring now? The Challenge: How did we get here? A brief history. Where are we: Study Designs –Longitudinal studies –Interrupted time series studies –Controlled before and after studies Where are we: Monitoring Designs –Direct observation –Interview –Survey –Multi-method approaches 4

5
What are we trying to find? Value Identification –Programs –Policies –Priorities –Processes/Procedures –Practice –Products –Perspectives –Possibilities –People Skills Where do we go from here? –Spectrum of impact –Multiple value manifestations –Enhanced partnerships and collaboration –Gamification, sensors, and always-on monitoring 5

6
The Challenge of the “Growth of Everything” Context 6

7
Challenge: Growth of the Research System http://jrp.icaap.org/index.php/jrp/article/viewArticle/128/106 1945 2000 7

8
This growth shifts patterns of sharing 8 Passive push (until 1970s+) Push harder (1990s+) Partner & pull (2000+) Dissemination via traditional journals, conferences Focus on implementation, e.g. performance feedback Linkage & exchange, e.g. joint production 8

9
Growing recognition that success will mean working together in more complex ways 9 9

10
Challenge: Competition in “idea market” 10 Philip Davies, Is Evidence-Based Government Possible? Jerry Lee Lecture 2004, Washington, DC Evidence Experienc e Judgemen t ResourcesValuesHabitsTraditionsLobbyists Pressure Groups Pragmatic s Contingen cy Emotions Other Factors 10

11
Challenge of the growth of Scientific Literature Available literature includes considerable discussion about the value of knowledge translation Little solid research concerning methods for ongoing monitoring and evaluation of KT processes Most literature discusses measurement of the outputs of KT activities Some literature discusses outcomes Very little on longer-term impact of KT 11 Growth of articles on Speciation Analysis

12
4 Common Obstacles to Research Use: 1.The research question is not pertinent to practice. 2.The research is not timely. 3.The research is not communicated in ways relevant to users. 4.Management pressures trump the use of research- based evidence in decision-making. Source: Allen, P. et al 2007. “Commissioning research that is used: the experience of the NHS Service Delivery and Organization Research Development Programme.” Evidence & Policy, 3(1): 119-134, as summarized in CHSRF’s Insight and Action, Issue 13, June 2007. 12
: , as summarized in CHSRF’s Insight and Action, Issue 13, June")
13
Why are we concerned about this now? Production –Every day, we create 2.5 quintillion bytes of data — so much that 90% of the data in the world today has been created in the last two years alone. –This data comes from everywhere: sensors used to gather climate information, posts to social media sites, digital pictures and videos, purchase transaction records, and cell phone GPS signals to name a few. –This data is big data. http://www-01.ibm.com/software/data/bigdata/ 13

14
Over Consumption? –Email: 144 billion email per day worldwide. (2012) –Websites: 624 million (2012) –Users: 2.4 billion (2012) –Mobile: 6.7 billion mobile subscriptions (2012) –Twitter: 175 million tweets daily average (2012) –Facebook: 1 billion users (2012) –Google: 1.2 trillion searches on Google (2012) –YouTube: 4 billion hours/month of video watched (2012) –Youth: spend less time watching TV (60%) and more time online (600%) 14
 –Websites: 624 million (2012) –Users: 2.4 billion (2012) –Mobile: 6.7 billion mobile subscriptions (2012) –Twitter: 175 million tweets daily average (2012) –Facebook: 1 billion users (2012) –Google: 1.2 trillion searches on Google (2012) –YouTube: 4 billion hours/month of video watched (2012) –Youth: spend less time watching TV (60%) and more time online (600%) 14.")
15
What is “Business as Usual” in KT Evaluation and Monitoring 15

16
Steps or shift in ecology? Mitton (2007) & Ward (2001) identified 5 main steps in KT: 1.identification and communication of the problem 2.analysis of the context in which the problem exists 3.development and selection of knowledge 4.activities and interventions 5.use of knowledge 16
 & Ward (2001) identified 5 main steps in KT: 1.identification and communication of the problem 2.analysis of the context in which the problem exists 3.development and selection of knowledge 4.activities and interventions 5.use of knowledge 16.")
17
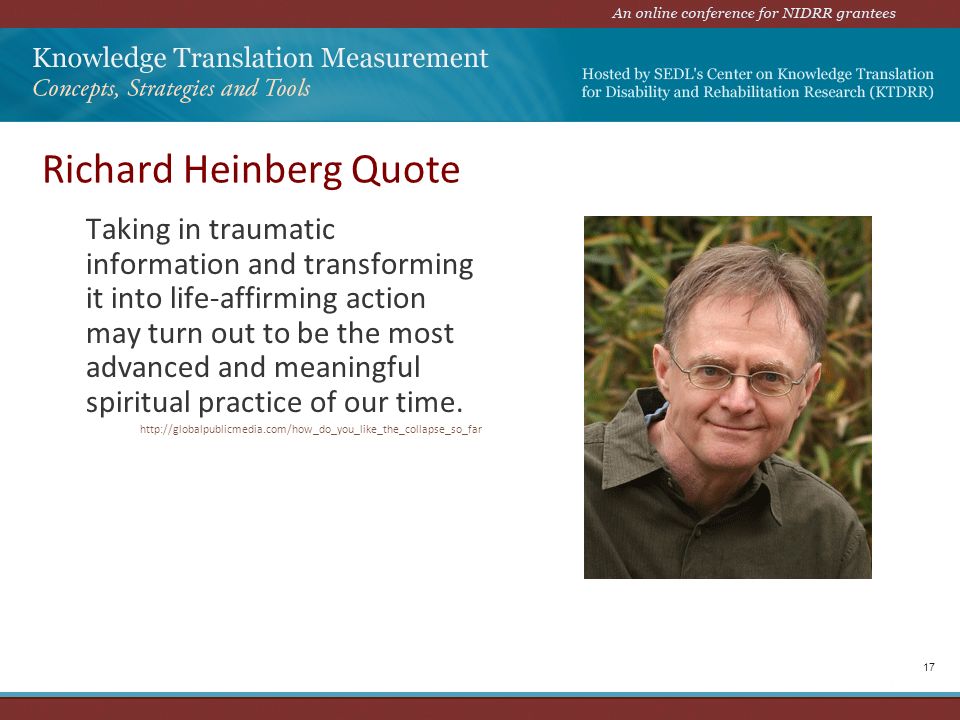
Richard Heinberg Quote Taking in traumatic information and transforming it into life-affirming action may turn out to be the most advanced and meaningful spiritual practice of our time. http://globalpublicmedia.com/how_do_you_like_the_collapse_so_far 17
18
What are we doing: Study Designs KT monitoring and evaluation studies tend to follow one of three main directions: –Longitudinal studies –Interrupted time series studies –Controlled before and after studies 18

19
Longitudinal Studies Continued monitoring of a KT process or “intervention” from beginning to end Real-time monitoring of an intervention allows for identification of problems with the intervention and to address these issues throughout the entire process Requires significant financial, time and human resources 19

20
Interrupted time series studies Involves taking measurements at multiple points before and after a KT intervention has taken place including some limited measurement at pre-selected stages of the intervention More streamlined than longitudinal studies Does not easily allow assessment of the impact of outside influences on the outcome being studied. 20

21
Controlled before and after studies Make assessments before commencing the intervention and then making assessments after the intervention has taken place to evaluate changes that have occurred Beneficial in determining the effect of an intervention in one specific isolated context Difficult to account for confounding variables that may have affected the outcome being studied 21

22
What are we doing: Monitoring Monitoring and control of a KT study typically involves one of 4 techniques: –Direct observation –Interview –Survey –Multi-method approaches 22

23
Direct Observation Constant awareness of how the KT process is unfolding allows for ‘on the fly’ problem solving Develop KT solution that is right for the context of the initiative Requires the continuous presence of a knowledge broker May be a costly endeavour and create a strain on human resources, finances and workloads 23

24
Interview Qualitative semi-structured interviews with participants at the outset of the intervention and throughout the implementation process One of the most popular methods for evaluating and monitoring KT Time consuming requiring preparation and follow up Care must be taken to ensure that results produced are not biased 24

25
Survey Typically involves a before and after survey Before the intervention takes place to get a baseline of attitudes, knowledge, skills and descriptive statistics After completion of the KT intervention process, individuals are given another survey to determine the change in the factors measured before the survey Relatively quick, cheap and easy to perform May not provide a full picture of the changes that occur 25

26
Multi-method Approaches A coordinated, multi – layer monitoring plan throughout the whole process of the KT initiative Provide the most complete picture of the initiative, from multiple perspectives in a continuous manner if planned and organized effectively Allows for both qualitative and quantitative insight More labour, time and financially intensive than any of the other methods used alone 26

27
No singular KT strategy was shown to be effective in all contexts. Conclusions about interventions cannot be taken on their own without considering the characteristics of the knowledge that was being transferred, providers, participants and organizations. - The effectiveness of knowledge translation strategies used in public health: a systematic review LaRocca et al. BMC Public Health 2012, 12:751 27

28
So. How can we think differently? 28

29
Do we want KT evaluations that measure the effectiveness of KT interventions? OR Do we want to make what we know ready to use, to create value for the communities we are concerned about? 29

30
30 VisionMissionGoalsStrategyTacticsOutputsOutcomesImpacts How to align Strategy & Tactics to Create impacts that meets the Vision, Mission, and Goals? Impacts determine whether Vision is being achieved or not

31
Thinking about KT as Value Creation Now What: Decisions, Directions, Actions So What: Meaning, Analysis, Interpretation What: Data, Information, Description, Stories MULTIPLE INPUTS FROM RESEARCH, PRACTICE, EXPERIENCE, CULTURE Innovation Supporting Infrastructure Initiatives Incentives to Share between Levels Value Creation Programs Policies Priorities Processes Practice Products Perspectives Procedures Possibilities People Skills 31

32
Thinking about a spectrum of activities Skinner, K. (2007). Developing a tool to measure knowledge exchange outcomes. Canadian Journal of Program Evaluation, 22(1), 49-73. 32
. Developing a tool to measure knowledge exchange outcomes. Canadian Journal of Program Evaluation, 22(1),")
33
Thinking about a nested system of changes Shaxson and Gwynn (2010) “Developing a strategy for knowledge translation and brokering in Public policymaking” paper from Knowledge Translation and Brokering workshop, Montreal, Canada, 20 October 2010 33
 Developing a strategy for knowledge translation and brokering in Public policymaking paper from Knowledge Translation and Brokering workshop, Montreal, Canada, 20 October")
34
Thinking about Conversations that link multiple contents with contexts, capacities and cultures within and between people. 34

35
Choosing metrics that are preferred by people Juice: A Guide to Creating Dashboards People Love to Use http://www.juiceanalytics.com/wp-content/uploads/2010/11/Guide_to_Dashboard_Design.pdf 35

36
Choosing play and game design in how we share The nature of intelligent environments has transformed with the impact of Web 2.0 and social media over the past years. The conceptualization of the user has changed from being a cog in an organizational machine to a partner in system interaction and an ultimate consumer, and more recently to a content creator and a task performer. 36

37
Measuring for Impact requires a shift from: “policing” to “engaging” “producers and users” to “partners and co-creators” “mechanical systems” to “complex emergent systems” “content is king” to “Yes but conversation is queen” “binary yes/no, on/off” to “spectrum of utilization” “You fit context” to “Context is customized to you” “work” to “purposeful play” 37

38
38 (613) 552-2725 peter@knowledgemobilization.net www.knowledgemobilization.net @peterlevesque Institute for Knowledge Mobilization Fairmont Chateau Laurier 1 Rideau Street, Suite 700 Ottawa, ON, K1N 8S7 38
 Institute for Knowledge Mobilization Fairmont Chateau Laurier 1 Rideau Street, Suite 700 Ottawa, ON, K1N 8S7 38")
Similar presentations


