Download presentation
Presentation is loading. Please wait.

1
Campus Crime and Security Campus Fire Safety 2012 Annual Reports

2
Annual Security Report An institutional responsibility Prescribed by federal regulation Inclusive process - OGC, UPD, ODOS, EH&S, HRL, IRM, Audit, OUR…. Institutional policies Crime statistics for calendar years 2012, 2011, and 2010 Posted to UPD website Notice distributed to current & prospective students & employees Statistics submitted to the U.S. Department of Education

3
2012 Clery Crime Statistics On Campus Resident Halls * CRIMES201220112010201220112010 MURDER/NON-NEGLIGENT HOMICIDE000000 NEGLIGENT HOMICIDE000000 ROBBERY100000 AGGRAVATED ASSAULT102100 MOTOR VEHICLE THEFT438000 ARSON001000 BURGLARY121816811 SEX OFFENSES FORCIBLE333332 SEX OFFENSES NON-FORCIBLE000000 Low rates Consistent trends

4
2012 Enforcement Categories On Campus Resident Halls* ALCOHOL LAW VIOLATIONS201220112010201220112010 ARRESTS9513120 DISCIPLINARY REFERRALS601623598527544501 DRUG VIOLATIONS201220112010201220112010 ARRESTS1711 443 DISCIPLINARY REFERRALS1281161619097130 ILLEGAL WEAPONS VIOLATIONS201220112010201220112010 ARRESTS111000 DISCIPLINARY REFERALLS5912488 Consistent patternsMinor changes in rates

5
UNCW Campus Fire Safety Report Prepared by Environmental Health & Safety Applies to residence halls Requires reporting of building construction, fire protection systems, drills, regulations and training, improvements as well as actual fires Major accomplishments: Revised Health & Safety Inspection protocols to ensure uniformity and cover highest risks Targeted cooking education programs Increased fire safety education significantly in residence halls http://uncw.edu/ehs/documents/AnnualFireSafetyReport.pdf

6
2012/2013 Fire Safety Log The report includes a log of all reportable fires in on campus housing Fire – any event that results in injury, death, or property damage or any flame that is outside its intended container There was one reportable fire at UNCW – Seahawk Landing Building 6 - short circuit in a dryer, due to lint accumulation Primary source of nuisance alarms is cooking, particularly instant macaroni and cheese and breakfast meats Secondary source of nuisance alarms are personal grooming such as blow dryers and hairspray.

7
Culture of Safety Campus Involvement Coordinating and Consulting Bodies Chancellor’s Council on Safety & Security Committees are populated by cross- sections of the University providing technical expertise and user perspective. Student Behavioral Intervention Team Several committees oriented to safety Institutional Risk Management Bike and Pedestrian Safety Committee Campus Safety and Investigations Committee (CIS, Admissions process) Student Conduct Process (campus judicial system) Relationship Violence-Sexual Assault Response Team (RV-SART)
 Student Conduct Process (campus judicial system) Relationship Violence-Sexual Assault Response Team (RV-SART).")
8
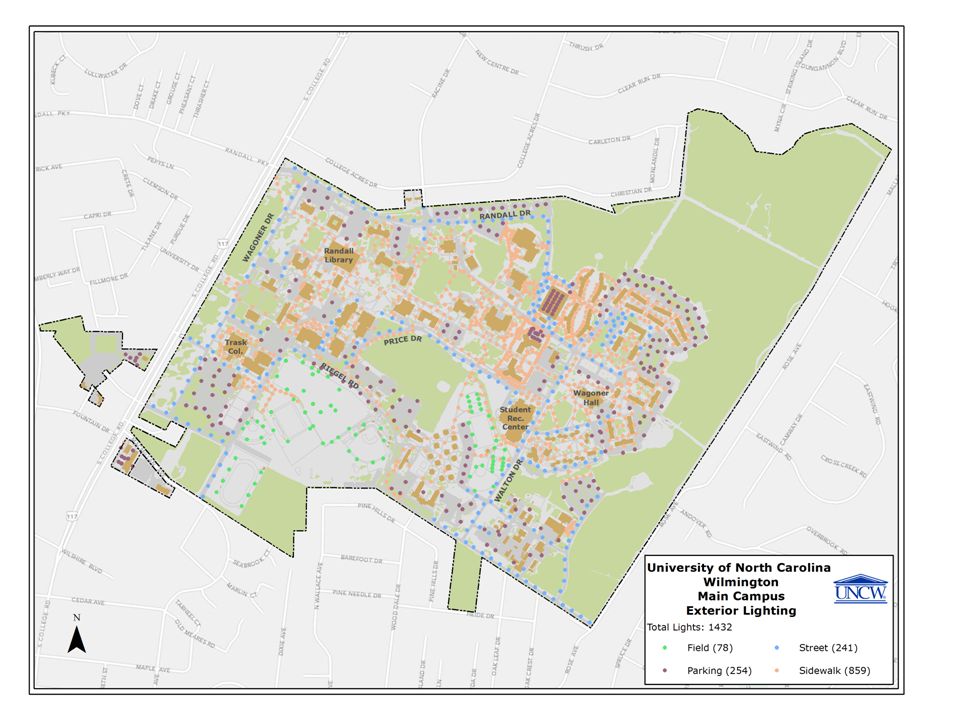
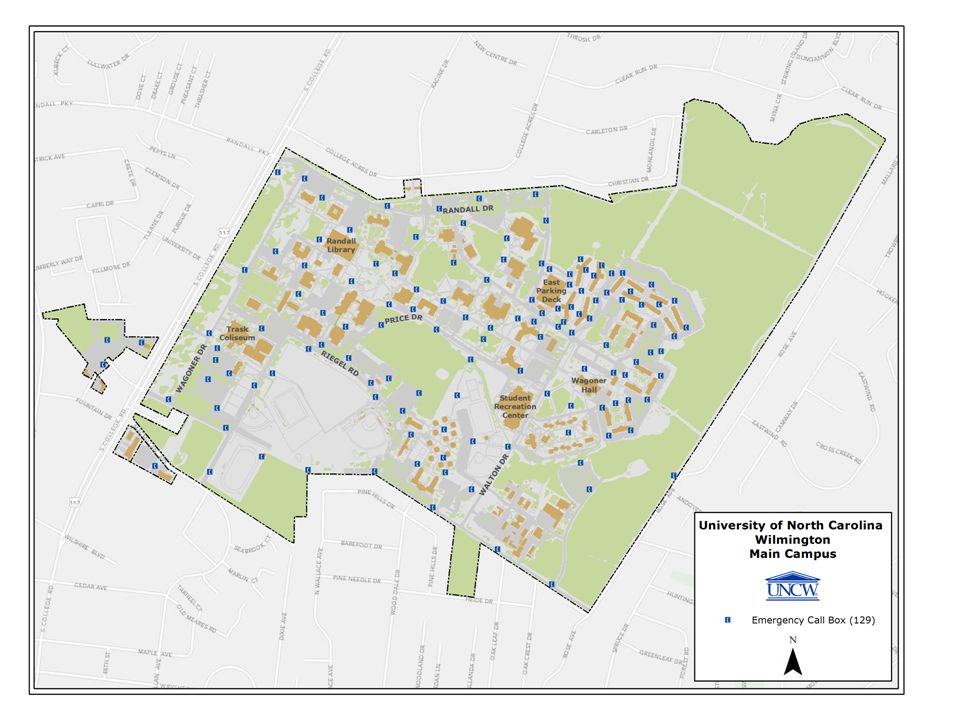
Culture of Safety Environmental Design 150+ Emergency Call Boxes and Telephones Intercoms in many campus buildings and rooms Fire alarms in all major campus buildings Sprinklers in all residential buildings Traditional residence halls are locked 24/7 UNCW Alert – a layered system that includes sirens, text messages, and alert beacons and web postings Lighting and Landscaping - designed and maintained with an eye towards security Annual safety walk – community participation Security cameras for investigative purposes

11
Culture of Safety Staffing & Intervention CROSSROADS: Substance Abuse Prevention & Education HRL Staff available 24/7 (RAs, RCs, ARCs) Broad involvement & collaboration w/ local emergency responders Emergency Planning Group 24 hour desk receptionists in residence halls Counseling Center CARE – Collaboration for Assault Response and Education EH & S, Emergency Management Office of Facilities Institutional Risk Management
 Broad involvement & collaboration w/ local emergency responders Emergency Planning Group 24 hour desk receptionists in residence halls Counseling Center CARE – Collaboration for Assault Response and Education EH & S, Emergency Management Office of Facilities Institutional Risk Management")
12
Culture of Safety Awareness and Education Freshman & Parent Orientation – Safety Presentations Floor meetings in the residence halls New Employee Orientation UNI 101 Classes Fire Exit Drills Health & Safety Inspections Personal Safety, self-defense, and workplace safety training seminars Defensive Driving Courses A myriad of other topics

13
Strategies Best practices Monitor offense rates and trends of offending Engage our colleagues across the state and nation Sustain programs with proven results: Campus Judicial System Education and awareness Campus partnerships Community policing Early intervention

14
Questions

15
Three Year Averages 2012 – 2010 Campus Sex OffenseRobbery Aggr. AssaultBurglary MV TheftArsonAlcoholDrugsWeapons ASU510.3316.3311568.66253.666.33 ECSU33.665.33230.66015.6623.338.33 ECU7.662.3311111784.6623417.33 FSU2.663.33135.335.660.6620.6646.3313.66 NCA&T21.661.335.333.330.333374.3313.33 NCCU3.6622.3329.3330.6641.3375.665.66 NCSU6.33812.3336.6615.330574.66151.668.33 UNC CH17.331.664.66314.660.66397.6649.665.66 UNC School of Arts0.660.33050.660.3324.6621.331 UNCA30.33 9 0.66100.66541 UNCC33.331.3372.3372.33442.66172.6613 UNCG01.33116.3310265.33152.3310.33 UNCP1.331.660.6617.661088.3312411.33 UNCW30.33115.3350.33616.33791 WCU40.331.3323.330096.66115.664.66 WSSUn/a University of Maine701.665.6629.66415.66273.331 Southern Connecticut St University3.66008.660.660398.66680 North Dakota State University3.3300.6681.660.33401376.33 Western Washington University2.330.33213.6630.33365177.660.66 College of Charleston7.330.330.66410.33248840.33

16
Three Year Average Offense 2013 YTD 10/8/13 3 yr avg201220112010 Robbery0.33100 Aggravated Assault11102 Sex offenses73333 Total Violent84.33535 Burglary215.33121816 Arson3.33001 Motor Vehicle Theft 05438 Total Property520.66162125 Alcoholn/a616.33610628611 Drugs79148145127172 Weapons19.6661013

17
Rates & Regulations CalendarViolent*Property*Alcohol*Drug*Weapon* 2013 est. thru Oct. 8, 2013 Student rate.06% Housing rate.19% Student rate.04% Housing rate.12% Not currently available.Student.57% Housing 1.91% Student.01% Housing.02% 2012 Student rate.04% Housing rate.12% Student rate.12% Housing rate.38% Student 4.64% Housing 14.32% Student rate 1.10% Housing rate 3.40% Student.05% Housing.14% 2011 Student rate.02% Housing rate.07% Student rate.16% Housing rate.50% Student rate 4.80% Housing rate 14.84% Student rate.97% Housing rate 3.00% Student rate.08% Housing rate.24% 2010 Student rate.04% Housing rate.12% Student rate.19% Housing rate.62% Student rate 4.73% Housing rate 15.06% Student rate 1.33% Housing rate 4.24% Student rate.10% Housing rate.32% *Notes: Violent crimes includes murder, non-negligent homicide, robbery, aggravated assault, sex offenses Property crimes includes arson, burglary, and motor vehicle theft Student rate is the number of violations as a percentage of the total student enrollment Housing rate is the number of violations as a percentage of the total number of students living on campus. Rates are calculated using Fall enrollment/housing values from prior year, ex. Calendar year 2013 crime against fall 2012 enrollment. Report for Calendar Year 2013 will include new information: statistics and policies surrounding domestic violence, relationship violence, and stalking and additional categories of hate crimes. U.S. Department of Education has not released final reporting criteria. Enrollment & Housing: 2012 – 13,733 / 4,135; 2011 – 13,145 / 4,259; 2010 – 13,071 / 4,239; 2009 Fall Enrollment 2013 – 13,937 2012 – 13,733 2011 – 13,145 2010 – 13,071 2009 – 12,924 Fall Housing 2013 – 4,135 2012 – 4,135 2011 – 4,259 2010 – 4,231 2009 – 4,058

18
Alcohol Violations as Percentage of Student Enrollment (working document) 20112010 1University of North Iowa4.83UNCW4.73 2UNCW4.80University of Maine3.74 3ASU4.30North Dakota State University3.73 4Southern Connecticut St University3.76WCU3.23 5University of Maine3.37University of Northern Iowa3.20 6College of Charleston3.26Southern Connecticut St University2.84 7ECU3.18ECU2.70 8North Dakota State University3.06ASU2.57 9UNC School Arts2.83NCCU2.27 10NCCU2.81Western Washington University1.20 11WCU2.51UNCA1.79 12UNCC2.12UNCC1.70 13Western Washington University2.05College of Charleston1.50 14UNCA1.94UNC School Arts1.40 15UNCG1.51UNC CH1.35 16UNCP1.39UNCG0.98 17UNC CH1.39UNCP0.85 18NCSU0.89ECSU0.79 19ECSU0.72NCSU0.61 20WSSU0.57WSSU0.41 21FSU0.30FSU0.40 22NCA&T0.19NCA&T0.19
 University of North Iowa4.83UNCW4.73 2UNCW4.80University of Maine3.74 3ASU4.30North Dakota State University3.73 4Southern Connecticut St University3.76WCU3.23 5University of Maine3.37University of Northern Iowa3.20 6College of Charleston3.26Southern Connecticut St University2.84 7ECU3.18ECU2.70 8North Dakota State University3.06ASU2.57 9UNC School Arts2.83NCCU NCCU2.81Western Washington University WCU2.51UNCA UNCC2.12UNCC Western Washington University2.05College of Charleston UNCA1.94UNC School Arts UNCG1.51UNC CH UNCP1.39UNCG UNC CH1.39UNCP NCSU0.89ECSU ECSU0.72NCSU WSSU0.57WSSU FSU0.30FSU NCA&T0.19NCA&T0.19")
19
Alcohol Violations as Percentage of Dorm Capacity (working document) 2011 2010 1ECU16.08 UNCW14.73 2Southern Connecticut St University15.32ECU11.95 3UNCW15.14Southern Connecticut St University11.82 4ASU13.36University of Maine10.61 5University of Northern Iowa12.90North Dakota State University9.24 6College of Charleston11.26NCCU7.96 7University of Maine10.22UNCC7.77 8UNCC10.23ASU7.52 9North Dakota State University8.83University of Northern Iowa7.38 10NCCU8.39Western Washington University6.20 11Western Washington University7.50WCU5.48 12UNCA6.95UNCA4.70 13UNCG6.90College of Charleston4.53 14UNC School of Arts6.33UNC CH3.80 15WCU6.31UNCG2.98 16UNCP4.63UNCP2.29 17UNC CH3.81FSU1.57 18NCSU3.65ECSU1.54 19WSSU1.52UNC School Arts1.58 20ECSU1.22NCSU1.09 21FSU1.16WSSU0.80 22NCA&T0.89NCA&T0.77
 ECU16.08 UNCW Southern Connecticut St University15.32ECU UNCW15.14Southern Connecticut St University ASU13.36University of Maine University of Northern Iowa12.90North Dakota State University9.24 6College of Charleston11.26NCCU7.96 7University of Maine10.22UNCC7.77 8UNCC10.23ASU7.52 9North Dakota State University8.83University of Northern Iowa NCCU8.39Western Washington University Western Washington University7.50WCU UNCA6.95UNCA UNCG6.90College of Charleston UNC School of Arts6.33UNC CH WCU6.31UNCG UNCP4.63UNCP UNC CH3.81FSU NCSU3.65ECSU WSSU1.52UNC School Arts ECSU1.22NCSU FSU1.16WSSU NCA&T0.89NCA&T0.77")
20
Alcohol Violations as Percentage of Dorm Capacity (working document) InstitutionAcreageStudent Headcount Dorm Capacity EE Headcount Distance to Coast City Population Micro/Metr opolitan Population Operation & Maintenance Expenses Total Headcount (Student and EE) University of Maine 66010,9013,6813,168~ 100 miles 10,000154,000$24.4 m14,069 Western Washington University (Coastal) 21214,8334,0542,089~ 15 miles82,000205,000$27.2 m16,922 University of Northern Iowa 94012,2734,9292,456~260 m to Great Lake 40,000169,000$21.9 m14,729 Southern Connecticut University (Coastal) 17111,1172,8331,734~1 mile131,000863,000$20.5 m12,851 North Dakota State University 25814,4434,9873,406~230 m to Great Lake 110,000216,000$21.1 m17,849 College of Charleston (Coastal neighbor) 5211,7233,3742,160~ 2 miles126,000697,000$22.3 m13,883 UNCW65613,7334,1472,487~6 miles110,000263,000$25.3 m16,220
 InstitutionAcreageStudent Headcount Dorm Capacity EE Headcount Distance to Coast City Population Micro/Metr opolitan Population Operation & Maintenance Expenses Total Headcount (Student and EE) University of Maine 66010,9013,6813,168~ 100 miles 10,000154,000$24.4 m14,069 Western Washington University (Coastal) 21214,8334,0542,089~ 15 miles82,000205,000$27.2 m16,922 University of Northern Iowa 94012,2734,9292,456~260 m to Great Lake 40,000169,000$21.9 m14,729 Southern Connecticut University (Coastal) 17111,1172,8331,734~1 mile131,000863,000$20.5 m12,851 North Dakota State University 25814,4434,9873,406~230 m to Great Lake 110,000216,000$21.1 m17,849 College of Charleston (Coastal neighbor) 5211,7233,3742,160~ 2 miles126,000697,000$22.3 m13,883 UNCW65613,7334,1472,487~6 miles110,000263,000$25.3 m16,220")
Similar presentations


 TRAINING PROGRAM MAKING OUR CAMPUS COMMUNITY SAFER.>")


 Places.>")


