Download presentation
Presentation is loading. Please wait.

1
GIS Syllabus & Introduction
Faculty of Applied Engineering and Urban Planning Civil Engineering Department GIS 2nd Semester 2008/2009 Syllabus & Introduction Lecture - Week 1

2
Content Lecturer Information Course Outline
Text Book and Recommended Readings Activities Assessment

3
MSc. Infrastructre Engineering
Lecturer Information Eng. Maha A. Muhaisen MSc. Infrastructre Engineering 2004 Office: BK210 Tel.: Ext. 1127 O. Hours: Will be provided later

4
Course Outline Introduction Fundamentals of GIS Data models
Hardware and software Sources, collection and integration of data Database / building geodata, metadata Georeferance and map projection GIS tools GIS analysis GIS applications Initiating GIS

5
Principle of Geographic information systems
Text Book Principle of Geographic information systems Second Edition 2001 Rolf A. de By, Richard A. , Knippers Yuxian Sunm Martin C. Ellis Menno-Jan Kraak Michael J. C. Weir Yola Georgiadou Mostafa M. Radwan Cees J. vanWesten Wolfgang Kainz Edmund J. Sides

6
Activities Lectures Lab Theory and Principles Examples
Group Work and Discussion Quizzes Lab application on ArcGIS Projects

7
Grade Policy Mid-term Exam 30% Final Exam 40%
Assignments & Quizzes % Lab Work/ project 20% 100%

8
Definitions of GIS Broad definitions:
“…geographic information systems are tools that allow for the processing of spatial data into information, generally information tied explicitly to, and used to make decisions about, some portion of the earth.” (DeMers, 1997: 7).
.")
9
Definitions of GIS Broad definitions:
“A geographic information system is a facility for preparing, presenting, and interpreting facts that pertain to the surface of the earth. ” (Tomlin, 1990: xi).
.")
10
Definitions of GIS Perspective-oriented definitions (information technology): “A geographic information system (GIS) is an information system that is designed to work with data referenced by spatial or geographic coordinates. ...GIS is both a database system with specific capabilities for spatially-reference data, as well [as] a set of operations for working with data. ” (Star and Estes, 1990: 2-3).
 is an information system that is designed to work with data referenced by spatial or geographic coordinates. ...GIS is both a database system with specific capabilities for spatially-reference data, as well [as] a set of operations for working with data. (Star and Estes, 1990: 2-3).")
11
Definitions of GIS Perspective-oriented definitions (management):
“[GIS is] an institutional entity, reflecting an organizational structure that integrates technology with a database, expertise and continuing financial support over time.” (Carter, 1989: 3)
")
12
Definitions of GIS Perspective-oriented definitions (decision support): “[GIS is] a decision support system involving the integration of spatially referenced data in a problem solving environment.” (Cowen, 1988)
")
13
Definitions of GIS Three ‘role-based’ views on GIS Cartographic view
Database view Spatial Analysis View

14
Definitions of GIS Geographic Information System “GIS” is a computer system for capturing, managing, integrating, manipulating, analyzing and displaying data which is spatially referenced to the Earth.

15
What is GIS? An integration of five basic components Procedures A
What is a GIS? Definitions of a geographic information system can vary considerably. The definition provided here combines both the components and functions of a GIS. The components needed to perform GIS tasks include those listed below: People This is the most important component in a GIS. People must develop the procedures and define the tasks of the GIS. People can often overcome shortfalls in other components of the GIS, but the opposite is not true. The best software and computers in the world cannot compensate for incompetence. Data The availability and accuracy of data can affect the results of any query or analysis. Hardware Hardware capabilities affect processing speed, ease of use and the type of output available. Software This includes not only the actual GIS software, but also various database, drawing, statistical, imaging or other software. Procedures Analysis requires well defined, consistent methods to produce correct and reproducible results. Procedures A Introduction to ArcGIS for ArcView and ArcInfo (I)
")
16
What is GIS? Component-based : hardware software data people
organizational/institutional context

17
What is GIS? Hardware computer monitor printer network infrastructure

18
Definitions of GIS Hardware computer monitor printer
network infrastructure

19
Definitions of GIS Software the GIS application may be modular
many component pieces for different purposes i.e. for output, types of analysis, editing, etc. different software for different purposes

20
Definitions of GIS Data spatial attribute metadata

21
Definitions of GIS People application authors
administrators who maintain system expert users casual users consumers of GIS products management

22
Definitions of GIS Organizational/Institutional Context
mission of organization organizational atmosphere encourage innovation entrenched bureaucracy resistant to change morale management hierarchy

23
Definitions of GIS Definition based on what a GIS does: the basic functions of a GIS (GIS as toolbox) Data input Data management (storage/retrieval) Data manipulation/analysis Data output
 Data manipulation/analysis. Data output.")
24
Definitions of GIS Data input
getting the ‘real world’ into the database data already in digital format data in other formats data transformation

25
Definitions of GIS Data management (storage/retrieval)
store data in a particular format data is organized in a way that facilitates fast and easy retrieval data can be created, deleted, and edited

26
Definitions of GIS Data manipulation/analysis
transform data representations (i.e. interpolation) model geographic distributions determine spatial relationships extract information from data
 model geographic distributions. determine spatial relationships. extract information from data.")
27
Definitions of GIS Data output: communication Maps Tables Diagrams
Animations Etc.

28
Definitions of GIS Does a GIS have to be computer based?
is a (paper) map creation, storage, retrieval, and analysis organization (i.e. a cartographic analysis lab) a GIS?
 map creation, storage, retrieval, and analysis organization (i.e. a cartographic analysis lab) a GIS")
29
Definitions of GIS Is a pre-computer-based library catalog system (card catalog) a GIS? Spatial or geographic information? Data input? Data management? Data analysis? Data output?

30
Definitions of GIS Works with geographic information
Performs data input, management, manipulation/analysis, and output functions Composed of hardware, software, people, and institutional context

31
Definitions of GIS Many names for related systems and systems that overlap with GIS: spatial information system (SIS) geo-information system (GIS) spatial decision support system (SDSS) land information system (LIS) computer aided design (CAD) computer aided mapping (CAM) remote sensing (image processing) (RSS)
 spatial decision support system (SDSS) land information system (LIS) computer aided design (CAD) computer aided mapping (CAM) remote sensing (image processing) (RSS)")
32
Definitions of GIS Primary related technologies computer cartography
database management (information technology) computer graphics remote sensing computer aided design (CAD)
 computer graphics. remote sensing. computer aided design (CAD)")
33
Origins of GIS 1950s in Geography
quantitative revolution, spatial analysis, computer cartography 1960s: individual development efforts Harvard Lab for Computer Graphics (and 70s) early GISs: SYMAP, GRID, ODYSSEY Canada GIS Roger Tomlinson coined the term ‘GIS’
 early GISs: SYMAP, GRID, ODYSSEY. Canada GIS. Roger Tomlinson coined the term ‘GIS’")
34
Origins of GIS 1970s: the federal government
USGS automated mapping of quad maps, available GIS products US Census DIME (1970) and TIGER (1990) 1980s and 1990s: a GIS industry commercial vendors ESRI and Intergraph
 and TIGER (1990) 1980s and 1990s: a GIS industry. commercial vendors. ESRI and Intergraph.")
35
Why use GIS? Until 1960s geographic information was represented primarily using paper maps convenient storage and retrieval suits a wide variety of purposes people are familiar with them

36
Some issues with paper maps
Why use GIS? Some issues with paper maps difficult to update/edit many types of analysis are problematic/complex e.g. overlay, proximity analysis data integration is difficult large volumes of data

37
Why use GIS? GIS provides data integration and standardization
methods for managing large volumes of data advanced spatial analysis capabilities automation of repetitive tasks sophisticated means of communication: distribution and output

38
Data Integration and Standardization
Why use GIS? Data Integration and Standardization data of different types, origins, scales can be registered to a common georeferencing system and integrated for mapping or analysis problems: data of different resolutions and accuracies may be integrated introducing error

39
Managing large volumes of data
Why use GIS? Managing large volumes of data databases are designed for the purpose of managing large amounts of data DBs have certain mechanisms that provide the means for speedy data retrieval and creation, deletion, and update operations disk space (memory) is cheap
 is cheap.")
40
Why use GIS? Spatial analysis
automated basic and advanced spatial analysis functions some automate traditional map analyses that were previously cumbersome (e.g. overlay) other spatial analysis functions have only been made widely available through GIS (e.g. least cost path)
 other spatial analysis functions have only been made widely available through GIS (e.g. least cost path)")
41
Automation of repetitive tasks
Why use GIS? Automation of repetitive tasks can create scripts to batch process customize GIS interface for specific purposes mapmaking tabular reporting common data retrieval certain type of analysis

42
Distribution and output
Why use GIS? Distribution and output not restricted to maps diagrams, reports, tables, animation, multi-media easy and cheap to make multiple copies easy to distribute data in digital format available global and local distribution networks: Internet, intranets, …etc

43
Why use GIS? Issues with GIS expensive
requires expertise to maintain and learning curve specific systems for specific types of applications

44
Four basic categories:
Why use GIS? Four basic categories: environmental/natural resource management urban and regional management infrastructure management commercial

45
environmental/natural resource management
Applications of GIS environmental/natural resource management vegetation, habitat (ecologic) hydrology minerals agriculture: planning and prediction
 hydrology. minerals. agriculture: planning and prediction.")
46
Urban and regional management
Applications of GIS Urban and regional management land use planning environmental impact emergency response (fire, police) crime analysis maintenance of legal records
 crime analysis. maintenance of legal records.")
47
infrastructure management
Applications of GIS infrastructure management am/fm public works utilities transportation (relationship with CAD/CAM) commercial market area analysis site selection routing
 commercial. market area analysis. site selection. routing.")
48
GIS Functions Capture Store Query Analyze Display Output

49
Storing Data Vector Formats discrete representations of reality
Raster Formats use square cells to model reality

50
Data Collection & Data Model GIS

51
Data Collection

52
Data in GIS – Acquisition Overview
Real world digital environment Data Input Digitizing Scanning Aerial Photographs Remote Sensing Surveying Global Positioning System

53
Data Input Major need in order to use a GIS Data
input costs often consume 60-90% of project costs data input is labor intensive, tedious, error prone reducing costs and maximizing accuracy important Automation appealing automated input can create future problems redrafting source documents (maps) often needed Input involves encoding locational information attribute data Locational data Cartesian coordinate system source maps may have different projections, scales common coordinate system for multiple source integration Attribute data tables, Digital data sharing
 often needed. Input involves encoding. locational information. attribute data. Locational data Cartesian coordinate system. source maps may have different projections, scales. common coordinate system for multiple source integration. Attribute data tables, Digital data sharing.")
54
Sources of Data Digital Non-digital graphics Document files
Existing vector/raster information Databases/spreadsheet tables Satellites Non-digital graphics Maps Photographs Sketches Diagrams Document files Scientific reports Survey measurements

55
Creating Digital Information
Digitize existing maps Scan existing maps Digital photogrammetric map production Manual entry of computed coordinates from field measurements Transfer data from existing digital sources

56
Digitizing Maps Map-based information exists Vector representation
Preparation Identify relevant features to digitize Organization Digitizing Internal coordinate systems Coordinate referencing (control points) Point and stream digitizing
 Point and stream digitizing.")
57
Issues to Consider Paper maps Cartographic license Map sheets
Humidity Errors Spills, blots, etc. Cartographic license Moving boundaries to include other map elements Map sheets Temporal changes Different creator Accuracy and precision Human error Experience Over and under shoots Cleaning process planar enforcement

58
Scanning Map-based information exists Automated digital data creation
Background need support other map information Automated digital data creation Raster representation Preparation Map needs to be of high cartographic quality Map needs to be clean Line width of at least 0.1 mm Scanning process Binary encoding process Regular grid produced

59
Processing Scan Information
Scale and Resolution Issues Vectorization Convert raster data to vector format Errors Pattern recognition Labels Features

60
Digitizing vs. Scanning
Advantages of digitizing Performed on inexpensive equipment Requires little training Does not require high quality map Disadvantages of digitizing Tedious Time consuming Advantages of scanning Easily performed Rapid creation of digital information Disadvantages of scanning Raster data files can be large and memory intensive Attribute data cannot be directly linked to line or polygon features Improving data quality is labor intensive Lines scaling not easy to deal with Clean maps with well defined lines necessary Equipment/software can be expensive Expert personnel required

61
Aerial Photographs Taken from above the surface of the earth
Balloons, planes, helicopters Vertical angles Need for interpretation Roads, lakes, rivers, buildings, fields, forests Vegetation, soils and geological formations Shapes of objects Size, pattern, shadows, color, texture Resolution 0.025 mm + Distortion Need for projecting to a ground coordinate system Georeferencing

62
Remote Sensing Satellite measurements of solar energy on the surface of the earth (electromagnetic radiation) Passive optical (reflected sunlight and reemitted thermal radiation) Microwave (transmission and reflection of energy using microwave portion of the radio frequency spectrum) Landsat (US) Polar orbit and solar synchronous Altitude of 705 km (4-5,7) 16 day cycles SPOT (French) Polar orbit Altitude of 832 km 26 day cycle Two sensors (Panchromatic and Multispectral) Three-dimensional image capabilities
 Microwave (transmission and reflection of energy using microwave portion of the radio frequency spectrum) Landsat (US) Polar orbit and solar synchronous. Altitude of 705 km (4-5,7) 16 day cycles. SPOT (French) Polar orbit. Altitude of 832 km. 26 day cycle. Two sensors (Panchromatic and Multispectral) Three-dimensional image capabilities.")
63
Surveying Field data collection
Method to determine horizontal and vertical position of objects Reference marks needed Coordinates used to supplement and update Measurements: Distance Direction Positional accuracy 1-10 cm Typically two people needed Time consuming task Attribute information needs to be attached to locational measurements

64
Global Positioning System
Satellite navigation system US Department of Defense Designed for military use Nominal operational constellation 24 satellites orbit the earth (12 hour circular paths) – 20,000 km often more than 24 operational satellites (new ones launched to replace older ones)
 – 20,000 km. often more than 24 operational satellites (new ones launched to replace older ones)")
65
GPS Signals Atomic clocks (highly accurate radio signals)
Coded satellite signals processed by a GPS receiver (compute position, velocity and time) Use of four satellites enables position and time on surface to be determined (x,y,z) Six orbital planes equally spaced (60° apart), and inclined at about 55° with respect to the equatorial plane (5-8 satellites visible from any point on earth)
 Use of four satellites enables position and time on surface to be determined (x,y,z) Six orbital planes equally spaced (60° apart), and inclined at about 55° with respect to the equatorial plane (5-8 satellites visible from any point on earth)")
66
Differential GPS Error corrections GPS readings adjusted using
Ground stations Another GPS receiver Accuracy ± 2 cm to ± 10 m

67
Understanding Spatial Data Structures
Lecture 3a Understanding Spatial Data Structures

68
Perception, and Space How do we deal with representing constructions of spatial objects, like “mountain,” “river,” “street,” “city,” How about representing more conceptual constructions like “temperature,” “migration pattern,” “traditional homeland,” “habitat,” “geographic range,” etc? Answer: we have various data models which use different abstractions of reality

69
There are two general approaches for representing things in space:
Entities and Fields There are two general approaches for representing things in space: Entities/ Objects: precise location and dimensions and discrete boundaries (remember, points are abstractions). Fields, or phenomena: a Cartesian coordinate system where values vary continuously and smoothly; these values exist everywhere but change over space
. Fields, or phenomena: a Cartesian coordinate system where values vary continuously and smoothly; these values exist everywhere but change over space.")
70
Two major data models Entity approach roughly corresponds with the vector model Field approach roughly corresponds with raster model Any geographic phenomenon can be represented with both, but one approach is usually better for a particular circumstance

71
Raster Spatial features modeled with grids, or pixels
Cartesian grid whose cell size is constant Grids identified by row and column number Grid cells are usually square in shape Area of each cell defines the resolution Raster files store only one attribute, in the form of a “z” value, or grid code. Consider the contrary….
![]()
72
Vector Vector layers either represent:
Points (no dimensions) Lines, or “arcs” (1 dimension) or Areas, or “polygons” (2 or 3 dimensions) Points are used to define lines and lines are used to scribe polygons Each point line or polygon is a “feature,” with its own record and its own attributes
 Lines, or arcs (1 dimension) or. Areas, or polygons (2 or 3 dimensions) Points are used to define lines and lines are used to scribe polygons. Each point line or polygon is a feature, with its own record and its own attributes.")
73
Vector and Raster Models in GIS
Representation of Lines Raster Vector

74
Raster and Vector representations of the same terrain
Raster: great for surfaces Vector: limited with surfaces

75
Raster and Vector representations of the same land use

76
Raster and Vector representations of the same land use: closer in

77
Vector vs. Raster: bounding
Raster: bad with bounding Vector: boundary precision

78
Vector vs. Raster: Sample points Cancer rates across space

79
Moving between vector and raster
In Arc View and Arc GIS, we can covert vector layers to grids, based on an attribute, or grids to vector layers The disadvantage of vector to raster is that boundaries can be imprecise because of cell shape Each time you convert, you introduce more error too

80
WHEN TO USE RASTER OR VECTOR???

81
Raster data analysis is better for representing phenomena:
where boundaries are not precise that occur everywhere within a frame and can be expressed as continuous numeric values where change is gradual across space where the attribute of a cell is a function of the attributes of surrounding cells

82
Raster technical advantages :
Simple file structure Simple overlay operations Small, uniform unit of analysis Raster technical disadvantages : Big file size, especially for fine-grained data Difficult and error-prone reprojections Square pixels are unrealistic

83
Vector analysis is better :
Where there are definable regions Where the relative position of objects is important Where precise boundary definition is needed Where multiple attributes are being analyzed for a given spatial object For modeling of routes and networks For modeling regions where multiple overlapping attributes are involved units with man-made boundaries (cities, zip codes, blocks), roads, rivers
, roads, rivers.")
84
Vector technical advantages :
Smaller file size (in general) More graphically interpretable Allows for topology (see further on) Vector technical disadvantages : Complicated file structure Minimum mapping units are inconsistent between overlapping layers
 More graphically interpretable. Allows for topology (see further on) Vector technical disadvantages : Complicated file structure. Minimum mapping units are inconsistent between overlapping layers.")
85
Specific Vector Usages
All legal and administrative boundaries (zip codes, states, property lines, land ownership) Building footprints and 3-D models Roads Bedrock geology Pipelines, power lines, sewer lines Flight paths and transportation routes Coastlines
 Building footprints and 3-D models. Roads. Bedrock geology. Pipelines, power lines, sewer lines. Flight paths and transportation routes. Coastlines.")
86
Specific Raster Usages
Terrain modeling where micro-locational variability is present and matters Groundwater modeling, where surface flow outside of channels is important Representation of slope and aspect Representations of distance and proximity to features Spatial representation of probabilities Modeling phenomena in nature with continuous spatial variability and numeric attributes, like soil moisture, depth to bedrock, percent canopy cover, vegetative greenness index, species richness index

87
In many cases, though, the choice between raster and vector may not be so clear.
Often it depends on the application The following are some examples where you could go either way:

88
Terrain Vector-based models used for terrain, including contours and TIN (The Triangulated Irregular Network) Problem: creates distinct terrain entities that distort reality: terraces and triangular facets Raster based grids are more commonly used They are optimal for showing spatial micro-variation in elevation although still have the problem of being like miniature “steps” Lattices deal with this through interpolation

89
Soil Soil type: Vector Soil pH: raster
Soil types are meant to represent discrete and homogeneous areas and are qualitative. There is no “slight gradation” between soil types like with pH Soil pH: raster pH is numeric, not categorical, and that number may vary slightly within a single soil type polygon If pH were turned into categories, like High, Medium and Low, vector might be better

90
Weather Weather station data: Vector, coded with points
Average precipitation surface: Raster interpolation of points Average precipitation contours: vector lines Both are interpolations, but one may be more accurate in a given situation Downside of contours: terrace effect, fewer intervals, more categorical.

91
Rivers Most people think of a river as a discretely bounded entity, hence vector What about where the river size fluctuates seasonally, e.g. desert rivers? Or where the location of the river bed changes slowly and gradually over the years Or where the river becomes delta, and the distinction between “river” and “swamp” becomes fuzzy? Or where the river has a certain probability of flowing or being dry at any given location and time

92
Rivers Depends on the type of analysis being done
With vector can do network modeling of stream and river system, but only in the arcs Vector stream model can take advantage of topologically enabled analysis tools With raster, can do surface flow modeling More realistic, because when it rains water flows everywhere, not just in channels, shows accumulation Think of every piece of land as mini stream channel

93
Metropolitan Areas No official administrative boundary for this
Where does one metro area begin and another end? Look at the New York New Jersey area. For a precise bounding, say for administrative purposes, use vector Can also include “fuzzy boundaries” To represent a gradual change from one urban area to another, use raster

94
Vegetation Mapping Vector works well for modeling vegetation stand type where categories are broad, e.g. mixed conifer, deciduous hardwood Raster works better where there is micro-locational heterogeneity in species distribution The more specific and variable the classification, the more likely the raster approach will be needed

95
Introduction to the Architecture of ArcGIS

96
What is ArcGIS? ArcGIS Desktop is a software product from ESRI
It comes in three versions: ArcView – basic desktop package, $ ArcEditor – ArcView +Advanced editing, $$ ArcInfo – ArcEditor + Comprehensive Geoprocessing, $$$ We are using ArcInfo

97
Components of Arc GIS All installation levels of Arc GIS come with
ArcMap (now includes toolbox in Arc 9.0) ArcCatalog ArcInfo installation ArcInfo Workstation ArcReader ArcObjects Developer Tools ArcScene
 ArcCatalog. ArcInfo installation. ArcInfo Workstation. ArcReader. ArcObjects Developer Tools. ArcScene.")
98
Components of Arc GIS How do you access these?
Go to the start menu>>programs>>ArcGIS

99
ArcCatalog for organizing and managing spatial and tabular data
Main menu Standard Toolbar Catalog tree Catalog display

100
This button allows you to connect to a local folder or a network place
In this course, all data and work will be stored on your Zoo account. In lab we’ll learn to “map a network” drive to your Zoo account, so it looks no different from saving to your local machine. This will be your Z drive.

101
Arc Catalog Once you’ve mapped your network drive, you can open an Arc Catalog connection to it, or to a subfolder in it

102
Arc Catalog For instance, here are the contents of my nr143 folder on my Zoo account, which I made a connection to:

103
Arc Catalog There are five types of data shown here Geodatabase
Coverage Tabular data Arc Map Project file Shapefile

104
Data types Shapefile: native file format for the ArcView 3.x;
Coverage: native file format for old ArcInfo 7.x Is not a file, but a complex directory structure Dbase/tabular data: non-spatial data table that can be used in a GIS, spreadsheet or database--.dbf Map document: a project file—it stores your map view and preferences in ArcGIS

105
Data types Geodatabase: This is ArcGIS’s new data model for storing geographic information It can contain any number of layers within it, known as “feature classes.” Shapefile have only one feature class As an example, here is a geodatabase with three layers, as seen in Arc Catalog

106
Feature classes In a geodatabase there are features classes for points, lines and areas (polygons) as well as for rasters (surfaces), annotation (labels) and dimensions Polygon, or area feature class Line, or arc feature class Annotation class: stores info about displaying labels on a map layer; important for roads and utilities
 as well as for rasters (surfaces), annotation (labels) and dimensions. Polygon, or area feature class. Line, or arc feature class. Annotation class: stores info about displaying labels on a map layer; important for roads and utilities.")
107
Feature dataset Feature dataset: a thematic grouping of feature classes Feature classes can be stand alone Feature data sets Feature classes

108
Geodatabase Geodatabases offer numerous advantages:
Multiple spatial layers and non-spatial data sources can be stored in a single file and organized thematically Rules can be easily defined that can apply to all classes These rules can include relationships between layers For instance if you have one subclass with water lines and one with water valves, you can ensure that if you move a water line, the water valve that connects that line will move as well, or it ensures that, say, if the material attribute for a water line is set to copper, the water valves that connect to it will also be copper

109
Geodatabase Other advantages:
Spatial layers maintain the same measurement and geographic reference systems, because new layers added to the geodatabase can “inherent” properties of existing ones Labeling “behavior” can be stored as an annotation feature class, making it easier to keep labels consistent “Domains” can be established, which specify the valid ranges of values for attributes, which reduces input error.

110
Geodatabase Types: Personal or multiple user
We will use personal geodatabases. These are actually Microsoft Access files with the .MDB file extension. A multi-user (SDE) geodatabase is for organizations that wish to have many people accessing the same database. These are used with enterprise database systems, like Oracle, Informix or SQL Server
 geodatabase is for organizations that wish to have many people accessing the same database. These are used with enterprise database systems, like Oracle, Informix or SQL Server.")
111
Personal Geodatabase With Access you can edit and query attribute tables and manage relationships between feature classes But it can only be viewed spatially in ArcGIS

112
Arc Catalog: data management
Arc Catalog is where you can create and modify geodatabases. You can create new feature classes, tables or relationship classes within a geodatabase You can also import existing shapefiles or coverages into a geodatabase or export a feature class to a shapefile

113
Arc Catalog: data management
Through right clicking, you can access the properties of a feature subclass and make changes to fields for the feature class’ attribute table

114
Arc Catalog: Online data
Arc Catalog also allows you to access some data directly from the Internet It comes preloaded with a connection to the Geography Network, where many layers are available through the Arc Internet Map Server (IMS) service ; other Internet connections can be added
 service ; other Internet connections can be added.")
115
Arc Catalog: Online data
Geography network data

116
Arc Catalog:Functionality
Arc Catalog allows you to preview geographic data, including geodatabase feature classes Use these buttons to zoom and pan

117
Arc Catalog:Functionality
You can also preview online data sets, like those from the geography network

118
Arc Catalog:Functionality
…and you can preview and browse tabular attribute data

119
Arc Catalog: Functionality
Preview, create and modify the “metadata,” or data about the data Arc Catalog standardizes this information and allows you to import and export metadata between layers

120
Arc Map Arc Map is where you’ll do most of your mapping and visualization of spatial data This is the default upper tool and menu bar Change map’s display scale (zoom factor) Zoom to full extent Find feature Zoom tools Add new layer measure Select feature
 Zoom to full extent. Find feature. Zoom tools. Add new layer. measure. Select feature.")
121
Arc Map: overlaying data
Using the add data button, you can overlay any number of layers for which geographic reference information exists. Display Window TOC

122
Arc Map: overlaying data
The window on the left side of Arc Map is the Table of Contents, where loaded layers are listed There are 2 modes for the TOC: display and source Display: note that it gives a symbol for the feature type Source mode: can see that the first 3 layers are from 1 geodatabase and the fourth is from a stand alone file TOC

123
Arc Map: properties You can access many functions by right clicking on the layer in the TOC. You can access, edit and query attribute tables from a special interface

124
Arc Map: Layer properties
You can access layer properties by double clicking on that layer: much functionality is found there

125
Arc Map: Layouts Arc Map can view in two modes:
data view: for viewing, analyzing and manipulating data layout view: for laying out data for presentation

126
Arc Map: Measurement Units
Map and Display units. With reference info Map units are already set; Display units are still changeable Without reference info Define map units (This turns into guesswork)
")
127
Arc Map: Units Once you’ve set display units, future geographic measurement functions should be in those units, even if they’re different from the Map units; however, this does not apply to non-spatial attribute values If you use the ruler tool for instance, measurements will be in the selected Display units at the bottom of the page

128
Arc Map: Scale Translation factor between one unit on the map and same unit in the real world map units: ground units (ratio) 1:10,000:1 inch equals 10,000 inches in real world Scale is a dimensionless number

129
Large vs. Small Scale Large scale Lots of detail Shows small features
No much detail Shows large features

130
Large vs. Small Scale USA 1:21,197,708 1:3,125,078
Washington State 1:21,197,708 1:3,125,078 Clark County, Washington highway interchange Clark County, Washington 1:30,137 1:5,269

131
ArcGIS: Extensions Specialized applications 3D Analyst Spatial Analyst
Geostatistical Analyst Tracking Analyst, X Tools… Others…

132
ArcGIS: Extensions Activate by going to Tools>>extensions

133
Arc Map: toolbars When you load Arc Map it defaults to a state with a minimum of toolbars. You can add more toolbars representing more functionality, including extensions from the view menu.

134
Arc Toolbox Used to be a separate interface, now part of ArcMap

135
Arc Toolbox Advanced Analyses Extract Overlay Proximity Statistics

136
Arc Toolbox Data Conversions
Change formats from one file type to another …

137
Arc Toolbox Data Management A collection of tools for data management…

138
Arc Scene Primarily for viewing 3D data

139
An Introduction to the Vector Data Model and Map Layout Techniques
Lecture 3b An Introduction to the Vector Data Model and Map Layout Techniques

140
Reviewing Vector Data Types
Three basic “feature” or “object” types Point Arc Polygon A layer holds a single feature type

141
Reviewing Vector Data Types
Attribute table Attribute types Nominal attributes: descriptive information Ordinal attributes: rank order or scale Interval/ratio attributes: numeric items, order, magnitude of difference

142
Point Feature ID X,Y Coordinates
A point layer: a collection of records with (x,y) coordinates 6 2 ID X,Y Coordinates 1 2,2 2 3,6 3 5,5 4 6,3 … 10 4,1 3,6 5 3 5,5 4 3 4 6,3 2 1 2,2 1 10 4,1 1 2 3 4 5 6 Image modified from ESRI Arc Info electronic help
 coordinates ID. X,Y Coordinates. 1. 2, , , ,3. … 10. 4,1. 3, , , , , Image modified from ESRI Arc Info electronic help.")
143
Image modified from ESRI Arc Info electronic help
Line (Arc) Feature Feature has length but not area Straight or curved Lines connect a set of vertices and nodes Feature is the ARC, not the line segments Arcs meet at nodes Vertices Line segment Node Node Image modified from ESRI Arc Info electronic help
 Feature. Feature has length but not area. Straight or curved. Lines connect a set of vertices and nodes. Feature is the ARC, not the line segments. Arcs meet at nodes. Vertices. Line segment. Node. Node. Image modified from ESRI Arc Info electronic help.")
144
Line (Arc) Feature Each point has a unique location
 Feature Each point has a unique location")
145
Polygon Feature Area of homogenous phenomena
In a polygon layer, lines (arcs) define areas Closed region – first and last coordinate pairs are in the same location Line segments bound the polygon Lines (Arcs) Points
 define areas. Closed region – first and last coordinate pairs are in the same location. Line segments bound the polygon. Lines (Arcs) Points.")
146
TOPOLOGY

147
TOPOLOGY (for vector data)
What is topology? Why is important? Three types of topological models in GIS Spatial operations of topology Contiguity Connectivity Trade-offs of topological structure Application model Triangular Irregular Network (TIN):Vector-based GIS
:Vector-based GIS.")
148
Spatial features and spatial relationships
Spatial features in maps Points, lines and polygons Human being interprets additional information from maps about the spatial relationships between features A route trace from an airport to a house Land contiguity adjacent to streets along which the lands are located

149
The definition of Topology
The spatial relationships can be interpreted identification of connecting lines along a path definition of the areas enclosed within these lines identification of contiguous areas In digital maps, these relationships are depicted using ‘Topology’ Topology = A mathematical procedure for explicitly defining spatial relationship Topology is the description of how the spatial objects are related with spatial meaning

150
Topology Definition1: Explicit encoding of spatial relationships between objects: the spatial location of each point, line and polygon is defined in relation to each other Definition2: Topology is a collection of rules and relationships that enables the geodatabase to more accurately model geometric relationships found in the world.

151
Why Topology Two major purposes Allows for powerful analysis tools
Quality control mechanism

152
Types of Vector Topology
Arc-node topology Polygon topology Route topology Region topology

153
Arc-node & Node Topology
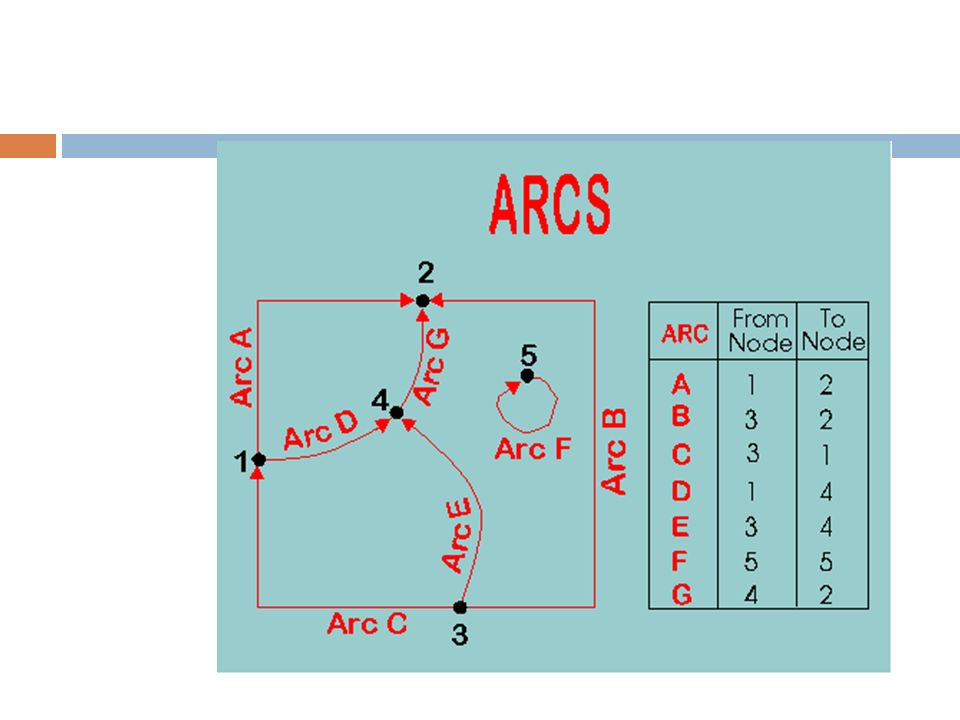
Connectivity analysis Arc-node Topology Arc-node List Direction Image source: ESRI Arc Info electronic help

154
Image source: ESRI Arc Info electronic help
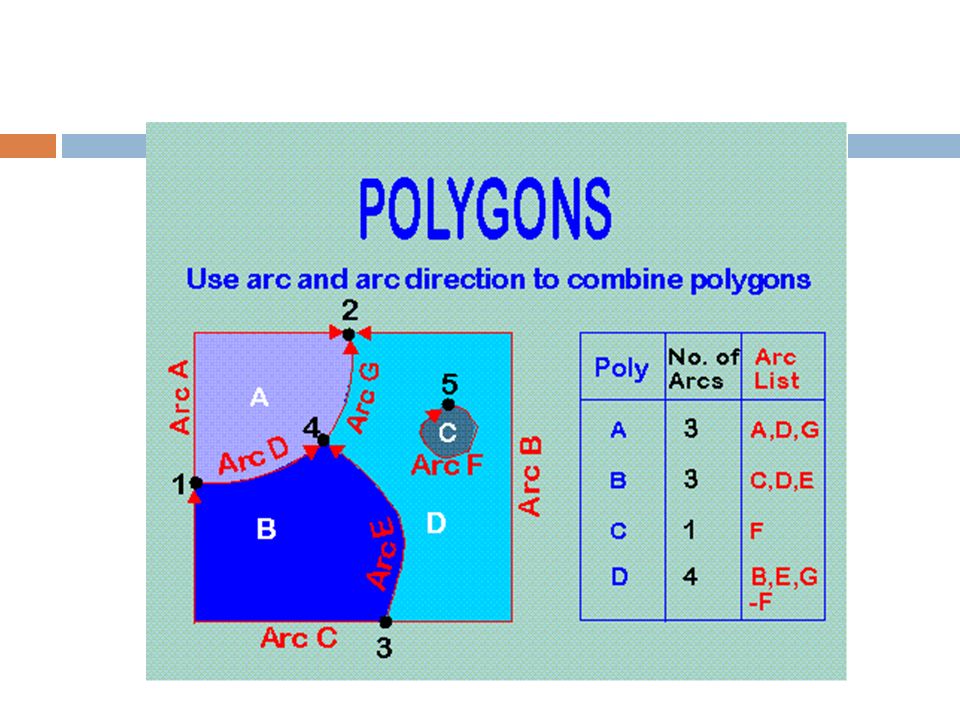
Polygon-arc Topology Polygon-arc Topology Polygon-arc List The order does matter! Image source: ESRI Arc Info electronic help

155
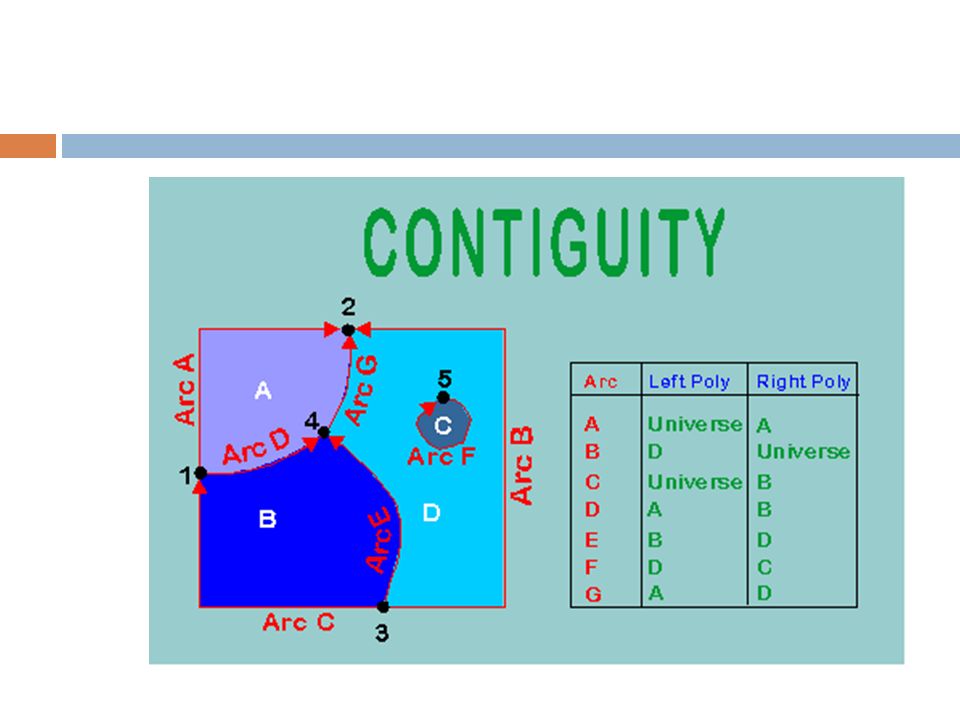
Polygon-arc Topology Adjacency External polygon

156
Define paths based on series of arcs
Route Topology Define paths based on series of arcs

158
Quality control and topology
Ensuring “logical consistency” Define complex and nuanced rules governing spatial relationships of features Data quality Single layer quality control Mutli-Layer quality control

159
Rules for spatial relationships
Say we have the following layers: parcels, sidewalks, right of way boundaries, building footprints, zoning Rules for spatial relationships Lots must be enclosed polygons Buildings must be entirely within a lot Sidewalks must be outside a parcel polygon and entirely within the public right of way Lots must fall entirely within a single zoning class All lots must have access to a right of way

160
Quality control and topology
Single layer quality control undershoot Dangles polygon overshoot does not share a border

161
Quality control and topology
Mutli-Layer quality control: Defining spatial rules between layers Polygon rules: e.g. Must Be Covered by Feature Class of Line rules: e.g. Must not Self Intersect Point rules: e.g. Must be Properly Inside Polygons ArcCatalog includes new tools for defining and validating topology rules

162
Spaghetti Data Model Non-topological data model
Lecture 3b Spaghetti Data Model Non-topological data model Collections of line segments and points Only stores features coordinates No real connection, topology or relationships Not for spatial analysis Generally come from CAD files or digitizing Can “clean” these data, using user-defined tolerances

163
Map Layouts and Cartographic Representation
Lecture 3b Map Layouts and Cartographic Representation

164
Lecture 3b Map Compilation X Map? Map Elements?

165
Map Compilation Title Legend Neatline Data frame North arrow Scale bar
Lecture 3b Map Compilation Title Legend Neatline Data frame North arrow Scale bar Notes

166
Lecture 3b Layouts Create a map for layout in ArcMap Layout view View>>Layout view.

167
Map Compilation Legend Geographic features Other map elements Title
Lecture 3b Map Compilation Geographic features Other map elements Legend Title North arrow Scale bar Author Neatline Source of data Other objects…

168
Lecture 3b Layouts Legends are edited in the Legends property window: Accessed by double clicking the legends. Give a title, e.g. land use Symbol editing

169
Legends editing: Items
Lecture 3b Layouts Legends editing: Items Item Style Symbol

170
Legends editing: Frame
Lecture 3b Layouts Legends editing: Frame Frame

171
Legends editing: Size and position
Lecture 3b Layouts Legends editing: Size and position Size&Position

172
More than one frames can be shown in layout view
ArcMap: data frame More than one frames can be shown in layout view Frame 1 Frame 2

173
Create a new view or “data frame” in ArcMap
Layouts: data frame Create a new view or “data frame” in ArcMap

174
Access and edit data frame properties
Layouts: data frame Access and edit data frame properties

175
Mxd files are project files
Lecture 3b MXD Files Mxd files are project files Save your layout All other preferences Data is not included With an extension .mxd File >> Save (As)
")
176
Layer Files Save symbology and setting
Lecture 3b Layer Files Save symbology and setting Primarily for saving legend setting Opening a layer file will open the data layer with all the preferences saved With an extension .lyr

177
Use layer files when you have lots of non-numeric categories
Lecture 3b Layer Files Use layer files when you have lots of non-numeric categories

178
Create a layer file in ArcCatalog
Lecture 3b Layer Files Create a layer file in ArcCatalog

179
Create a layer file in ArcMap
Lecture 3b Layer Files Create a layer file in ArcMap

180
Import a layer file’s symbology in properties
Lecture 3b Layer Files Import a layer file’s symbology in properties

181
Topological data models
Three types of topological concepts Arc, Node and polygon topologies Arc Arcs have directions and left and right polygons (=contiguity) Node Nodes link arcs with start and end nodes (=connectivity) Polygon Arcs that connect to surround an area define a polygon (=area definition)
 Node. Nodes link arcs with start and end nodes (=connectivity) Polygon. Arcs that connect to surround an area define a polygon (=area definition)")
182
Terms and concepts Connectivity - from and to nodes
Contiguity - Polygon Enclosure Adjacency - from Direction To Node Arc Right Polygon Left Polygon From Node

185
5. The Example of Topological Relationships

187
Spatial operations of topology
Connectivity and contiguity A basic, but core spatial analysis operations in GIS Contiguity A city planner might be interested in zoning conflicts such as industrial zones bordering recreation areas Connectivity Transportation network, telecommunication systems, river systems To find optimum routings or most efficient delivery routes or the fastest travel route To estimate water flow at a bridge crossing that will result from heavy flood

188
Trade-offs of topology
Advantages Spatial data is stored more efficiently Analysis process faster and efficient for large data sets By topological relationships, we can perform spatial analysis functions, Modelling flow through the connection of lines in a network (i.e. buffering) Combining adjacent polygons with similar characteristics (i.e. spatial merge) Overlaying geographical features (i.e. spatial overlay)
 Combining adjacent polygons with similar characteristics (i.e. spatial merge) Overlaying geographical features (i.e. spatial overlay)")
189
Disadvantages Extra cost and time Additional batch job working
creating topological structure does impose a cost Topology should be always updated when a new map or existing map is updated Additional batch job working To avoid the extra efforts, GIS systems need to run a batch job (i.e. a process that can be run without user interactions); 70% of total GIS costs Autoexec.bat in DOS Macro languages such as AML (Arc/Info), Avenue (ArcView), MapBasic (MapInfo) and etc
; 70% of total GIS costs. Autoexec.bat in DOS. Macro languages such as AML (Arc/Info), Avenue (ArcView), MapBasic (MapInfo) and etc.")
190
Conclusions of topology
When topology is created, we can identify Know its positions of spatial features Know what is around it Understand its geographical characteristics by virtue of recognising its surroundings Know how to get from A to B

191
Metadata Metadata is ‘data about data’. It should include such information as:- The origin of the data source When the dataset was created Who created / modified it Data coverage and scale Accuracy and precision Ownership, copyright and restrictions on use Dataset file location Critical to maintaining an effective GIS

Similar presentations


>")
