Download presentation
Presentation is loading. Please wait.

1
The arduous transition to low-carbon energy A multi-level analysis of renewable electricity niches and resilient regimes Prof. Frank W. Geels Manchester Business School + King Abdulaziz University 24 April 2014, Jeddah, KSA Conference organised by Faculty of Economics and Administration

2
Structure 1. Introduction 2. Multi-level perspective
3. Empirical application and assessment 3.1. Positive developments in (global) renewable electricity niches 3.2. Negative developments in (global) electricity regimes 4. Conclusions
 renewable electricity niches Negative developments in (global) electricity regimes. 4. Conclusions.")
3
1. Introduction/background
- Worldwide CO2 emissions rising fast - Current trends are in the upper scenario range - Timely transition will be difficult/arduous

4
Addressing climate change requires major change in various sectors/systems (IPCC, 2007)
Focus here on electricity supply

5
Confusing picture with conflicting trends
Some positive trends: Rise of renewable electricity Decreasing CO2 emissions in Europe and US (shale gas, recession, offshoring, renewables) Many city initiatives But also negative trends Increasing worldwide coal use Steep emission rise
 Many city initiatives. But also negative trends. Increasing worldwide coal use. Steep emission rise.")
6
Rising CO2 emissions mainly non-OECD (IEA, 2013)
")
7
Aims of presentation 1. Introduce MLP as analytic sensemaking framework 2. Make empirical assessment of transition to renewable electricity a) Positive (niche) developments b) Negative (regime) developments (coal, gas, nuclear)
 Positive (niche) developments. b) Negative (regime) developments (coal, gas, nuclear)")
8
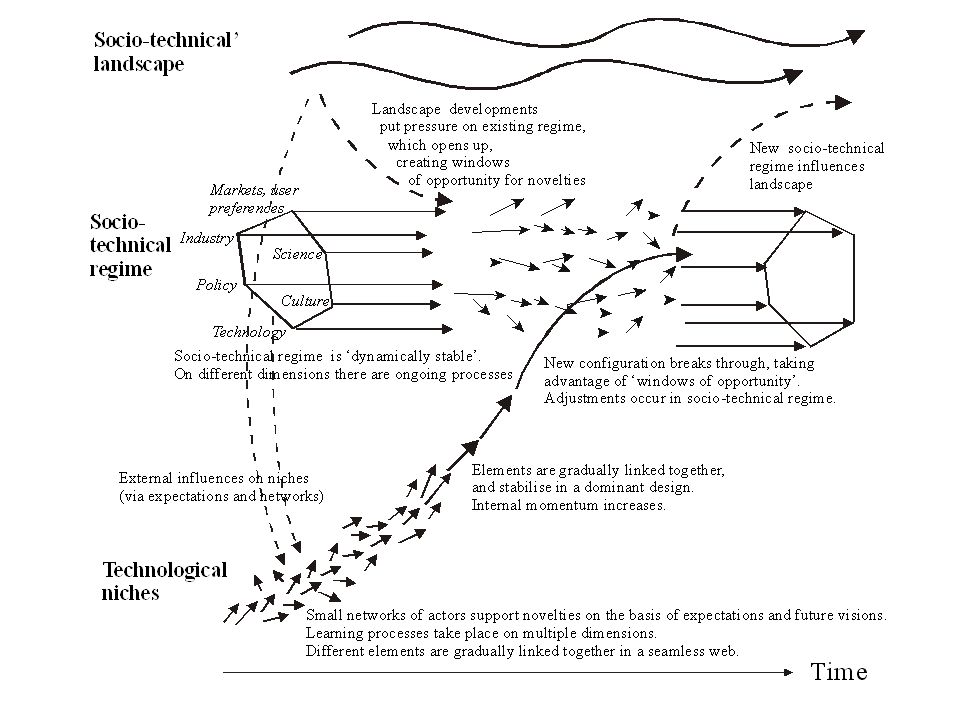
2. Multi-level perspective (MLP)
Widely used in debate on socio-technical transitions. Some characteristics: Looks at systems, but also at actors (different from system dynamic models) Looks at multiple dimensions (multi-disciplinary!) Socio-technical systems as meso-level unit of analysis (not entire society, not individual innovations)
 Looks at multiple dimensions (multi-disciplinary!) Socio-technical systems as meso-level unit of analysis. (not entire society, not individual innovations)")
9
Socio-technical system (Geels, 2004)
")
10
Analyse social interactions in organizational field

11
Static multi-level perspective (nested hierarchy)
Static multi-level perspective (nested hierarchy) * Radical innovation in niches (variation/novelty) * Struggling against existing regimes * In context of broader ‘landscape trends’
 * Radical innovation in niches (variation/novelty) * Struggling against existing regimes * In context of broader ‘landscape trends’")
12
1) Existing regime is locked-in + path dependent
Economic: vested interests sunk investments (competence, infrastructure) scale advantages, low cost Social: cognitive routines make ‘blind’ (beliefs) alignment between social groups (‘social capital’) user practices, values and life styles Politics and power: Opposition to change from vested interests Uneven playing field + policy networks
 scale advantages, low cost. Social: cognitive routines make ‘blind’ (beliefs) alignment between social groups (‘social capital’) user practices, values and life styles. Politics and power: Opposition to change from vested interests. Uneven playing field + policy networks.")
13
2) Niches for radical innovation
Nurturing of ‘hopeful monstrosities’ (Mokyr) Protection from mainstream market selection Carried by entrepreneurs, outsiders, small social networks
 Protection from mainstream market selection. Carried by entrepreneurs, outsiders, small social networks.")
14
electronic digital computers 1939 1943 4 float glass 1902 41
Time lag between invention and innovation (Clark, Freeman, Soete, 1981) Invention Innovation Time lag (years) electronic digital computers 1939 1943 4 float glass 1902 41 fluorescent lighting 1901 1938 37 helicopter 1904 1936 32 jet engine 1928 1941 13 magnetic tape-recording 1898 1937 39 radar 1925 1934 9 radio 1900 1918 18 synthetic detergents 1886 42 television 1923 transistor 1948 1950 2 zipper 1891
 Invention. Innovation. Time lag (years) electronic digital computers float glass fluorescent lighting helicopter jet engine magnetic tape-recording radar radio synthetic detergents television transistor zipper")
15
3. Situated in exogenous socio-technical landscape
Exogeneous backdrop Slow-changing secular trends (demographics, macro-economics, ideology, climate change)
")
17
Transitions involve multi-dimensional struggles between niche-innovations and existing regimes (in context of wider landscape change) Business/firms: New entrants vs. incumbents Economic: Competition between ‘grey’ and ‘green’ technologies in uneven playing field Political: Political struggles over adjustments in policies. Status quo defended by incumbent ‘elites’ (politicians, big firms). Cultural: Discursive struggles about importance and framing of problems (e.g. ‘market failure’ vs. ‘planetary boundaries’)
. Cultural: Discursive struggles about importance and framing of problems (e.g. ‘market failure’ vs. ‘planetary boundaries’)")
18
3. Empirical application and assessment of low-carbon electricity transition
3.1. Positive developments in (global) renewable electricity niches 3.2. Negative developments in (global) electricity regimes Overall MLP-interpretation: Niche-innovations are gaining momentum, but regimes are not (yet) falling apart Resilient regimes hinder transition
 renewable electricity niches Negative developments in (global) electricity regimes. Overall MLP-interpretation: Niche-innovations are gaining momentum, but regimes are not (yet) falling apart. Resilient regimes hinder transition.")
19
3.1. Positive developments in (global) renewable electricity niches
World-wide growth in installed capacity of renewable electricity options (in GW): wind, solar-PV and bio-power
: wind, solar-PV and bio-power.")
20
Most investments (cumulatively) in Europe (2004-2012), but 29% decrease in 2012
China single largest country investor US: boom and bust pattern

21
New investment in renewable energy (excluding large hydro) (Frankfurt School, 2013): billion $
 (Frankfurt School, 2013): billion $")
22
Cumulative world-wide investment ($ billion) per type (data from Frankfurt School, 2013)
Most investments in wind and solar-PV Global investment decreased in 2012

23
Investment in Europe led to substantial rise in renewable electricity
From 12.2% in 1990 to 19.6% in 2010: - Old renewables (hydro, biomass/wood) - New renewables (wind, solar, biogas)
 - New renewables (wind, solar, biogas)")
24
Europe is global leader in ‘new’ renewable electricity
Relative composition (%) of electricity in 2011 Europe is global leader in ‘new’ renewable electricity Global renewable electricity = 20.5% ‘old’ renewables dominate Germany one of European leaders in new renewables, after Portugal (41.2%), Denmark (32.9%) and Spain (29.5%) China relatively small % new renewable (despite investments)
 of electricity in Europe is global leader in ‘new’ renewable electricity. Global renewable electricity = 20.5% ‘old’ renewables dominate. Germany one of European leaders in new renewables, after Portugal (41.2%), Denmark (32.9%) and Spain (29.5%) China relatively small % new renewable (despite investments)")
25
Driving factors of positive niche-developments
Price/performance improvements in wind turbines and PV-modules (overproduction and dumping) New political discourse (‘green growth’, ‘transitions to green economy), targets (e.g. Europe 2020 goals) and some favourable policies, e.g. generous feed-in tariffs
 New political discourse (‘green growth’, ‘transitions to green economy), targets (e.g. Europe 2020 goals) and some favourable policies, e.g. generous feed-in tariffs.")
29
3. Rising public concerns after 2005:
Hurricane Katrina (2005), All Gore’s movie (2005), Stern Review (2006) , IPCC report (2007), Nobel Prize (2007) Public attention to climate change (UK)
, All Gore’s movie (2005), Stern Review (2006) , IPCC report (2007), Nobel Prize (2007) Public attention to climate change (UK)")
30
4. Green stimulus packages (2009): $522 billion
Varying country commitments - Korea + China - UK low green stimulus

31
But also some weakening of drivers
Decline in public attention for climate change Decline of global investment in 2012 3) Weakening of green policies a) Reductions in feed-in tariffs (UK, Germany, Spain, Italy) b) No successor of Kyoto; no international action until 2020 c) Green stimulus packages winding down ( ) d) EU ETS is not (yet) working: carbon price is low and variable
 Weakening of green policies. a) Reductions in feed-in tariffs (UK, Germany, Spain, Italy) b) No successor of Kyoto; no international action until c) Green stimulus packages winding down ( ) d) EU ETS is not (yet) working: carbon price is low and variable.")
32
d) EU ETS carbon price: low, decreasing, fluctuating
 EU ETS carbon price: low, decreasing, fluctuating")
33
3.2. Negative developments in (global) electricity regimes
1) Shale gas revolution started in US and now spreading to China, UK, Poland IEA (2011) predicts ‘golden age for natural gas’ Lower gas prices in US
 Shale gas revolution. started in US and now spreading to China, UK, Poland. IEA (2011) predicts ‘golden age for natural gas’ Lower gas prices in US.")
34
Positive: gas replacing coal in US (gradually)
Double edged sword Positive: gas replacing coal in US (gradually) US power generation (IEA, 2013)
 US power generation (IEA, 2013)")
35
Negative effects a) Immediate risks (groundwater, tremors) controversial debates b) May wipe out renewables investment wave c) May lock us into new fossil fuel (for next 30 years) d) cheap US coal flooding world-market, leading to 6% increase in coal use in Germany in 2012 and 32% increase in UK
 May lock us into new fossil fuel (for next 30 years) d) cheap US coal flooding world-market, leading to 6% increase in coal use in Germany in 2012 and 32% increase in UK.")
36
2) Nuclear renaissance? Nuclear seemed on its way out (expensive, risky) Nuclear phase-out in Germany, Japan, Belgium But made comeback as low-carbon option + energy security But ‘nuclear renaissance’ in UK, China, India, Russia Also IPCC, IEA argue for doubling of nuclear capacity to address climate change This will be quite a challenge given recent stagnation

37
Worldwide installed nuclear capacity (in GW(e))
)")
38
Actual decrease since 2006 (Schneider and Froggatt, 2013)
- New nuclear expansion would compete with renewables - Probably requires public subsidies (to cover risks)
")
39
3) Coal expansion “For all the talk about natural gas and renewables, coal unquestionably won the energy race in the first decade of the 21st century” (IEA, 2011) South Africa (93%), Poland (90%), China (79%), Australia (70%), India (69%), US (45%), Germany (44%)
 South Africa (93%), Poland (90%), China (79%), Australia (70%), India (69%), US (45%), Germany (44%)")
40
Coal-fired generation grew 45% between 2000 and 2010
Projected to keep growing in line with 6-degree climate change

41
Leads to ‘capture ready’ promise (contested)
Coal regime actors defend themselves with ‘clean coal’ discourse and promise of CCS Slow CCS progress (90 Mt CO2 is less than 1% of power sector CO2 emissions) Leads to ‘capture ready’ promise (contested) CCS capacity by region and project status, 2012 (IEA: 2013: 25)
 Leads to ‘capture ready’ promise (contested) CCS capacity by region and project status, 2012 (IEA: 2013: 25)")
42
4) Regime conclusion: Fossil fuel regimes are resilient + adaptive
Renewables mainly additional to fossil fuels We can only burn 1/3 of proven fossil fuel reserves to stay within 2-degree target (Berners-Lee and Clark 2013; IEA, 2013) So, we need accelerated diffusion of green niche-innovations (investments, market creation, cultural enthusiasm) and managed decline of ‘grey’ regimes (taxes, regulations, standards) Transition research should also look at destabilisation of existing regimes
 So, we need accelerated diffusion of green niche-innovations (investments, market creation, cultural enthusiasm) and managed decline of ‘grey’ regimes (taxes, regulations, standards) Transition research should also look at destabilisation of existing regimes.")
43
4. Conclusions Conceptual
Transitions are complex, multi-dimensional processes MLP is useful heuristic framework, not a ‘truth machine’ MLP is ‘outside-in’ framework focusing on overall patterns But one can ‘zoom in’ further and develop ‘inside-out’ understanding (actors, searching, groping, struggling, debating)
")
44
Empirical conclusions
Substantial (European) progress in green electricity But renewables face uphill struggles against regimes Regimes (coal, gas, nuclear) relatively stable, because of commitment from government and industry Transition will be arduous and likely more contentious in next 5-10 years We should not just study ‘green’, but also existing regimes + more attention for political economy
 progress in green electricity. But renewables face uphill struggles against regimes. Regimes (coal, gas, nuclear) relatively stable, because of commitment from government and industry. Transition will be arduous and likely more contentious in next 5-10 years. We should not just study ‘green’, but also existing regimes + more attention for political economy.")
47
Transition pathways a. Technological substitution
b. Regime transformation (endogenous) c. Regime reconfiguration d. De-alignment and re-alignment
 c. Regime reconfiguration. d. De-alignment and re-alignment.")
48
a. Technological substitution

49
b. Transformation pathway

50
c. Reconfiguration pathway

51
d. De-alignment and re-alignment

52
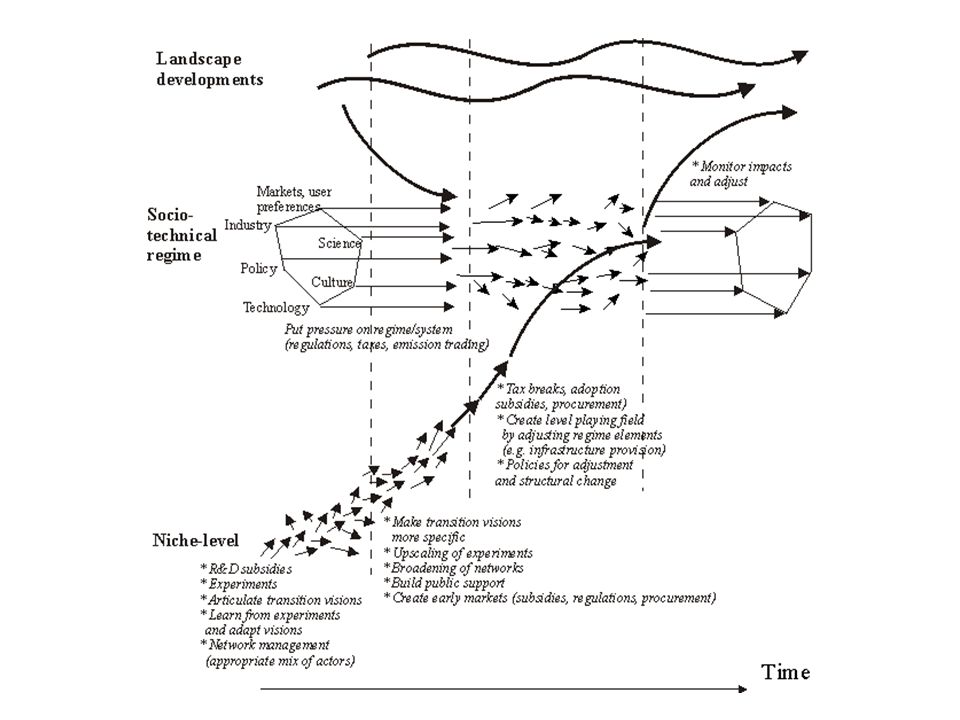
Two pronged policy strategy
1) Niche-level: Stimulate variety/innovation - Long-term visions + short-term action (projects): learning-by-doing, network building 2) Regime-level: Tighten selection environment (taxes, regulations, incentives)
 Niche-level: Stimulate variety/innovation. - Long-term visions + short-term action (projects): learning-by-doing, network building. 2) Regime-level: Tighten selection environment (taxes, regulations, incentives)")
54
Varieties of capitalism: different policy styles
No single policy recipe for system innovation Different policy styles : a) Liberal Market Economies (e.g. USA, UK, Canada). b) Coordinated Market Economies (e.g. Germany, Denmark) c) State-influenced Market Economies (e.g. France, Japan, Korea) d) State capitalism (China, Russia)
 Liberal Market Economies (e.g. USA, UK, Canada). b) Coordinated Market Economies (e.g. Germany, Denmark) c) State-influenced Market Economies (e.g. France, Japan, Korea) d) State capitalism (China, Russia)")
55
Different policy mixes and instruments
Command-and-control (top-down steering) Market model (incentivize bottom up agents) Policy networks (convening, orchestrating processes) Governance instruments Formal rules, regulations, laws Financial incentives (subsidies, taxes) Learning processes, projects/experiments, vision/scenario workshops, strategic conferences, public debates, platforms Foundation scientific disciplines Classic political science Neo-classical economics Sociology, innovation studies, neo-institutional political science
 Market model (incentivize bottom up agents) Policy networks (convening, orchestrating processes) Governance instruments. Formal rules, regulations, laws. Financial incentives (subsidies, taxes) Learning processes, projects/experiments, vision/scenario workshops, strategic conferences, public debates, platforms. Foundation scientific disciplines. Classic political science. Neo-classical economics. Sociology, innovation studies, neo-institutional political science.")
56
Niche-innovation initially carried by local/urban projects

57
Sequence of projects enables niche development trajectories (Geels/Raven, 2006)
")
58
Dynamic model of niche development (relations between mechanisms)
")
Similar presentations


 Workshop Zurich,>")


![10.12.2012 Susanna Porkka, Mikko Wahlroos. Regional potential and forecast for wind power IPCC scenario analysis The Energy [R]evolution scenario.](/19/5815120/big_thumb.jpg "10.12.2012 Susanna Porkka, Mikko Wahlroos. Regional potential and forecast for wind power IPCC scenario analysis The Energy [R]evolution scenario.>")


 in China.>")


